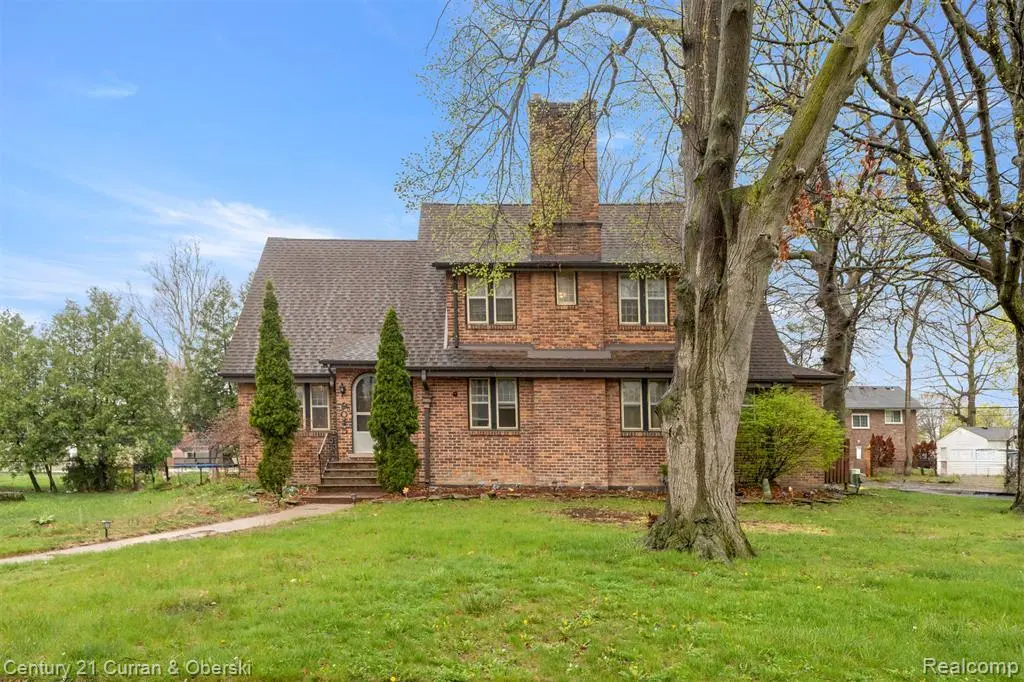
9045 Riverdale St · Redford, MI
Flood risk 1/10 · Minimal
- FEMA flood zone
- X (unshaded)
- Chance of flooding over 30 yrs
- 0.0%
- Est. flood insurance / yr
- $473 – $860
Fire risk 1/10 · Minimal
- Est. fire insurance / yr
- $784 – $1,456
Heat risk 3/10 · Minor
- Hot days now (above 98°F)
- 7 days/yr
- Hot days in 30 yrs
- 15 days/yr
Wind risk 2/10 · Minimal
- Chance of severe wind over 30 yrs
- —
Air-quality risk 3/10 · Minor
- Unhealthy air days now
- 2 days/yr
- Unhealthy air days in 30 yrs
- 3 days/yr
Risk factors via First Street. Map © Google.
Why this score? — see what drove the C grade
The composite is a weighted blend of 9 inputs, each scored 0–100. Each bar is that input's sub-score; the figure is the points it added to the 100-point composite (weight × sub-score).
- Cash flow +22.6/30.0
- ARV discount +14.5/15.0
- DSCR +7.3/10.0
- 1% rule +5.5/10.0
- Rent growth +3.3/5.0
- Livability +2.5/5.0
- Condition / age +2.5/5.0
- Schools +1.8/10.0
- Appreciation +0.0/10.0
$225,000
🖨 Deal sheet 📄 Offer letter ✓ Due diligence
Listing remarks MLS
This roomy 4-bed, 2-bath home sits on a large lot with endless possibilities. The 2-car garage, wide yard, and outdoor space make it ideal for gatherings, projects, or simply enjoying peaceful surroundings. Inside, the layout provides flexibility for living, working, and hosting. Bring your vision - this home needs some TLC but offers strong upside for the right buyer.
Key facts
- 0.38 acre lot
- 2 garage spots
- Built 1925
Neighborhood map
What this means for you Summary
Snapshot
- This is a 5-bed/1.5-bath single-family listed at $225k.
Deal economics
- At list price, monthly cash flow is $384 ($5k/yr) — positive.
- The deal already cash-flows at list — no discount required.
- Meets the 1% rule at list price ($2k rent vs $225k).
- Recommended offer: $212k (6.0% below list) — sets the bar for market timing.
Location & tenants
- Location reads: area grade C — affects rentability + tenant quality, not the cash-flow math above.
- South Redford School District (suburban): math 11% / reading 29% proficiency, ranked #455 of 540 in MI (top 84%) — low school quality limits family demand, transient renter base, plan for 1-2y turnover.
- Market conditions: Rents rising (+3.2%/yr); 188 active listings in the ZIP; 2,639 units permitted in Wayne County in 2024 (1,216 in 5+ unit buildings).
- This rent runs 40% of the median local income ($71k/yr) — at the standard rent-burdened threshold; future hikes will face affordability resistance.
Forward outlook
- Local home prices are declining (-3.0%/yr); year-one equity from $2k of loan paydown is wiped out by about $7k of value loss. Plan a longer hold.
- Wayne County population projected at -17% by 2050 — secular population decline; favor cash flow + early exit over multi-decade hold.
Negotiation context
- It's been on market 62 days — a 6% lower offer ($212k) is reasonable based on typical stale-listing flexibility.
- 10 sale attempts since 7y ago; this cycle's ask is 5% above the opening price — seller raised mid-cycle; expect resistance to lowballs.
- Current owner paid $165k; 36% above their basis — modest negotiation headroom, anchor on the comps not their cost.
Risks & watch-outs
- Watch-outs: built in 1925 — expect roof / HVAC / electrical / plumbing capex.
Questions for the listing agent
- It's been on market 62 days. Have you received any prior offers? Is the seller open to a 6% concession, seller financing, or rate buy-down credit?
- Built in 1925 — when were the roof, HVAC, electrical panel, plumbing, and water heater last replaced?
- Why hasn't it sold? Are there any deal-killer items the seller is aware of (foundation, flood, title, zoning, code violations)?
- Is there a deadline driving the sale (1031 exchange, divorce, estate, relocation)? That informs how much negotiation room exists.
- What's the average days-on-market for RENTAL listings here right now (not sales)? A rising rental-DOM trend means longer vacancies and softer asking-rent achievability than the comps imply.
- What's the recent tenant-quality profile in this submarket — average credit score on applications, eviction rate, late-payment / NSF rate, and stable-employment percentage? A property-management company in the area should have these aggregated.
- How much new for-sale + rental construction is in the pipeline within 1–3 miles? Heavy new supply typically softens prices + rents 12–24 months out; constrained supply supports both.
Investment metrics
- 1% rule
- 1.05% ✓
- Cap rate
- 8.34%
- Cash-on-cash
- 7.32%
- DSCR
- 1.33
- GRM
- 8.0
CMA / ARV
- ARV (median comp)
- $266,527
- List price
- $225,000
- Delta
- -15.58%
- Verdict
- UNDERPRICED
- Comps
- 14 within 1.0 mi
Show comp detail 4 sales within ~0.75 mi
| Address | Dist | Beds/Ba | Sqft | Sold | Price | $/sf | Match |
|---|---|---|---|---|---|---|---|
| 8128 Grayfield St | 0.63mi | 5/2.0 | 2,336 (+6%) | 9mo | $255,000 | $109 | 51 |
| 8126 Dale St | 0.66mi | 4/2.0 (-1) | 2,088 (-5%) | 9mo | $310,000 | $148 | 46 |
| 11314 Hazelton | 0.69mi | 4/2.5 (-1) | 2,432 (+10%) | 4mo | $240,000 | $99 | 38 |
| 8314 Fenton St | 0.67mi | 6/2.0 (+1) | 2,039 (-8%) | 20mo | $265,000 | $130 | 33 |
Match score weights: distance 35% · size 25% · config 20% · recency 20%. Top-matched comps best support the ARV.
Projected returns pro-forma
-3.0% appreciation · 3.25% rent growth · sell at horizon
- IRR
- -4.8%
- Equity multiple
- 0.82×
- Total profit
- $-11,413
- Equity at exit
- $33,548
- IRR
- 5.1%
- Equity multiple
- 1.38×
- Total profit
- $23,961
- Equity at exit
- $19,454
Cash invested: $63,000 (down + closing). Projections, not guarantees.
Landlord ↔ Tenant lean methodology
- Overall (STATE)
- 62 Landlord-Friendly
- State Michigan
- 62 Landlord-Friendly · EVEN
- County
- — inherits STATE
- City
- — inherits STATE
ZIP-level market 48239
- Rents YoY
- 3.2%
- Active inventory
- 188
- Price-to-rent
- 8.0×
Monthly cashflow live
- Estimated rent
- $2,355 medium interval (Pro) →
- Mortgage (P&I)
- −$1,180
- Tax from tax record
- −$203 /mo · $2,431/yr
- Insurance
- −$94
- HOA
- −$0
- Vacancy / Maint / Mgmt
- −$495
- Net cashflow
- $384
Break-even live
UW: 25.0% down · 7.5% · 30yr · 1.5% tax · 5.0% vac · 8.0% maint · 8.0% mgmt
Financing live
Cash to close
- Down payment
- $56,250
- Closing costs
- $6,750
- Reserves months
- —
- Total cash needed
- —
Loan-product check · same deal, 3 products live
Conventional
25% down · 7.5% · 30yr
- Down + closing
- —
- Monthly P&I
- —
- Monthly cashflow
- —
- DSCR
- —
- Eligible?
- —
Personal DTI + credit; lowest rate.
DSCR
20% down · 8.5% · 30yr
- Down + closing
- —
- Monthly P&I
- —
- Monthly cashflow
- —
- DSCR
- —
- Eligible?
- —
No personal income docs; deal must DSCR.
Hard money
10% down · 12.0% · 12mo
- Down + closing
- —
- Monthly P&I
- —
- Monthly cashflow
- —
- DSCR
- —
- Eligible?
- —
Short-term bridge; refi at stabilization.
Listing history 44 events
-
2026-06-17status $225,000 Pending 62 DOM
-
2026-06-17days on market $225,000 Active Under Contract 62 DOM
-
2026-06-16days on market $225,000 Active Under Contract 61 DOM
-
2026-06-15days on market $225,000 Active Under Contract 60 DOM
-
2026-06-13days on market $225,000 Active Under Contract 58 DOM
-
2026-06-09days on market $225,000 Active Under Contract 54 DOM
-
2026-06-08days on market $225,000 Active Under Contract 53 DOM
-
2026-06-07statusdays on market $225,000 Active Under Contract 52 DOM
-
2026-06-04days on market $225,000 Active 49 DOM
-
2026-06-03days on market $225,000 Active 48 DOM
-
2026-06-02days on market $225,000 Active 47 DOM
-
2026-06-01days on market $225,000 Active 46 DOM
-
2026-05-31days on market $225,000 Active 45 DOM
-
2026-05-18price $225,000 371-char remark
Show marketing remark (375 chars)
This roomy 4-bed, 2-bath home sits on a large lot with endless possibilities. The 2-car garage, wide yard, and outdoor space make it ideal for gatherings, projects, or simply enjoying peaceful surroundings. Inside, the layout provides flexibility for living, working, and hosting. Bring your vision—this home needs some TLC but offers strong upside for the right buyer.
-
2026-05-18price $225,000 375-char remark
Show marketing remark (375 chars)
This roomy 4-bed, 2-bath home sits on a large lot with endless possibilities. The 2-car garage, wide yard, and outdoor space make it ideal for gatherings, projects, or simply enjoying peaceful surroundings. Inside, the layout provides flexibility for living, working, and hosting. Bring your vision—this home needs some TLC but offers strong upside for the right buyer.
-
2026-04-17$215,000 Active 371-char remark
Show marketing remark (375 chars)
This roomy 4-bed, 2-bath home sits on a large lot with endless possibilities. The 2-car garage, wide yard, and outdoor space make it ideal for gatherings, projects, or simply enjoying peaceful surroundings. Inside, the layout provides flexibility for living, working, and hosting. Bring your vision—this home needs some TLC but offers strong upside for the right buyer.
-
2026-04-17$215,000 Active 375-char remark
Show marketing remark (375 chars)
This roomy 4-bed, 2-bath home sits on a large lot with endless possibilities. The 2-car garage, wide yard, and outdoor space make it ideal for gatherings, projects, or simply enjoying peaceful surroundings. Inside, the layout provides flexibility for living, working, and hosting. Bring your vision—this home needs some TLC but offers strong upside for the right buyer.
-
2026-04-13historical $215,000 371-char remark
Show marketing remark (371 chars)
This roomy 4-bed, 2-bath home sits on a large lot with endless possibilities. The 2-car garage, wide yard, and outdoor space make it ideal for gatherings, projects, or simply enjoying peaceful surroundings. Inside, the layout provides flexibility for living, working, and hosting. Bring your vision - this home needs some TLC but offers strong upside for the right buyer.
-
2026-04-06historical
-
2026-03-21status Active
-
2026-03-21status Active
-
2026-03-19status Pending
-
2026-03-19status Pending
-
2026-03-19historical
-
2026-03-05$215,000 Active
-
2026-03-05$215,000 Active
-
2026-03-03historical
-
2021-09-14soldstatus $165,395
-
2021-07-16historical
-
2021-01-31status Pending
-
2021-01-31status Pending
-
2021-01-31historical
-
2021-01-12historical Accepting Backup Offers
-
2021-01-12historical Accepting Backup Offers
-
2020-12-13$179,000 Active
-
2020-12-13$179,000 Active
-
2020-08-03historical
-
2020-02-27status Pending
-
2020-02-27status Pending
-
2020-02-26historical
-
2019-12-04price $180,000
-
2019-12-04price $180,000
-
2019-09-28$200,000 Active
-
2019-09-28$200,000 Active
ⓘ Source: listings_history table (triggers on properties + properties_extension) + one-shot
backfill from property_details.listing_events for pre-trigger history.
Tax reassessment forecast MI · Partial reset (capped growth)
- Current annual tax
- $2,431 · $203/mo
- Projected year-2 tax
- $2,948 · $246/mo
- Expected delta
- +$517/yr (+$43/mo · 21.3%)
ⓘ Screening estimate from a state-policy table — verify with the county assessor before closing.
Climate risk First Street
- Flood 1/10 Low FEMA zone X (unshaded) · 0% chance over 30 yrs
- Wildfire 1/10 Low
- Heat 3/10 Moderate 7 d/yr ≥98°F today · 15 d/yr by 30 yrs out
- Wind 2/10 Low
- Air quality 3/10 Moderate 2 unhealthy d/yr today · 3 by 30 yrs out
Nearby sold comps map
Loading sold comps map…
Walkable amenities ~0.75 mi
Loading nearby amenities…
Taxation est. · year 1
- Rental income
- $28,259
- − Mortgage interest
- −$12,603
- − Property taxes
- −$2,431
- − Insurance
- −$1,125
- − Repairs & maintenance
- −$2,261
- − Management
- −$2,261
- − Depreciation
- −$6,545
- Taxable income
- $1,033
- Est. tax owed @ 24.0%
- −$248
- After-tax cash flow
- $4,362/yr
For passive investors: Depreciation is non-cash, so a rental often shows a tax loss while cash-flowing — sheltering income. Rental losses are passive: they offset passive income freely, and up to $25,000/yr can offset ordinary (W-2) income if you actively participate and your MAGI is under $100k (phasing out to $0 by $150k); unused losses carry forward. On sale, claimed depreciation is recaptured at up to 25%, and gains may owe capital-gains tax (a 1031 exchange can defer both). Figures are a year-1 estimate at your 24.0% rate — not tax advice; consult a CPA.
Schools (NCES district)
- District
- South Redford School District
- NCES district ID
- 2632280
- Math proficiency
- 11% ▼ -9.00%
- Reading proficiency
- 29% ▼ -7.00%
- Median HH income
- $52,775
- Composite
- 18.1/100
- National rank
- #8972
- State rank
- #455 of 540 in MI
Livability — Redford
No livability data for this city. (Only ~50 U.S. cities are tracked.)
Census & demographics
- County
- Wayne County · 1,562,939 people
- City population
- 36,976
- Metro
- Detroit-Warren-Dearborn, MI
- Population (ZIP)
- 36,976
- Household income
- $71,151
- Rent vs Own
- Severe rent burden
- 1052.0
Population outlook (Wayne County) Hauer SSP2
- Today (2025)
- 1,675,273 people
- By 2030
- 1,620,300 · -3.3%
- By 2040
- 1,502,341 · -10.3%
- By 2050
- 1,384,039 · -17.4%
- By 2075
- 1,124,592 · -32.9%
- By 2100
- 881,193 · -47.4%
Race, ethnicity, and origin ACS 2023
- Neighborhood character
- Majority Black (58%)
- Race & ethnicity
- Black 58% White 34% Hispanic / Latino 4% Two or more races 4%
- Common ancestry
- Romanian 7% Slovak 2% Lithuanian 2%
- Foreign-born
- 2% · Canada
- Languages at home
- 96% English-only · Spanish 1% Other Indo-European 1% Arabic 1%
Political lean MEDSL · Wayne
- 2024 margin
- Strong D (+29.0) · D 62.7% · R 33.7% · Other 3.6%
- 2008→2024 swing
- -20.5pp toward R · 2008: 49.5pp · 2024: 29.0pp
- All cycles
- 2024: D+29.0 2020: D+38.1 2016: D+37.3 2012: D+46.9 2008: D+49.5
Not yet ingested
- Civics
- —
Market trends
- HPI YoY
- ▼ -202.97%
- Current HPI
- 236.1136
- Rent YoY
- ▲ 3.25%
- Metro
- Detroit-Warren-Dearborn, MI
- State GDP YoY
- ▲ 1.37%
- F500 in state
- 28
Industry mix (Fortune 500 HQ in MI)
| Industry | F500 HQs | Revenue |
|---|---|---|
| Automotive Parts | 3 | $48B |
|
||
| Automotive | 2 | $372B |
|
||
| Chemicals | 1 | $45B |
|
||
| Automotive Retail | 1 | $29B |
|
||
| Healthcare / Medical Devices | 1 | $23B |
|
||
| Automotive Technology | 1 | $20B |
|
||
Price history
+12.5% since first listed31 events — show timeline
- 2026-05-18 Price Changed $225,000 MiRealSource-MiMLS
- 2026-05-18 Price Changed $225,000 REALCOMP
- 2026-04-17 Listed $215,000 MiRealSource-MiMLS
- 2026-04-17 Listed $215,000 REALCOMP
- 2026-04-13 Coming Soon $215,000 MiRealSource-MiMLS
- 2026-04-06 Listing Removed — MiRealSource-MiMLS
- 2026-03-21 Relisted — MiRealSource-MiMLS
- 2026-03-21 Relisted — REALCOMP
- 2026-03-19 Pending — MiRealSource-MiMLS
- 2026-03-19 Pending — REALCOMP
- 2026-03-19 Listing Removed — REALCOMP
- 2026-03-05 Listed $215,000 MiRealSource-MiMLS
- 2026-03-05 Listed $215,000 REALCOMP
- 2026-03-03 Coming Soon — MiRealSource-MiMLS
- 2021-09-14 Sold (Public Records) $165,395 Public Records
- 2021-07-16 Listing Removed — REALCOMP
- 2021-01-31 Pending — MiRealSource-MiMLS
- 2021-01-31 Pending — REALCOMP
- 2021-01-31 Listing Removed — MiRealSource-MiMLS
- 2021-01-12 Contingent — MiRealSource-MiMLS
- 2021-01-12 Contingent — REALCOMP
- 2020-12-13 Listed $179,000 MiRealSource-MiMLS
- 2020-12-13 Listed $179,000 REALCOMP
- 2020-08-03 Listing Removed — REALCOMP
- 2020-02-27 Pending — MiRealSource-MiMLS
- 2020-02-27 Pending — REALCOMP
- 2020-02-26 Listing Removed — MiRealSource-MiMLS
- 2019-12-04 Price Changed $180,000 MiRealSource-MiMLS
- 2019-12-04 Price Changed $180,000 REALCOMP
- 2019-09-28 Listed $200,000 MiRealSource-MiMLS
- 2019-09-28 Listed $200,000 REALCOMP
Property tax history
-1.0%/yrLatest (2025): $2,431 · -65.2% YoY. Source: county tax records.
Cash-flow waterfall
monthlySold comps — $/sqft
last 12 mo · ≤1 miLoading sold comps…