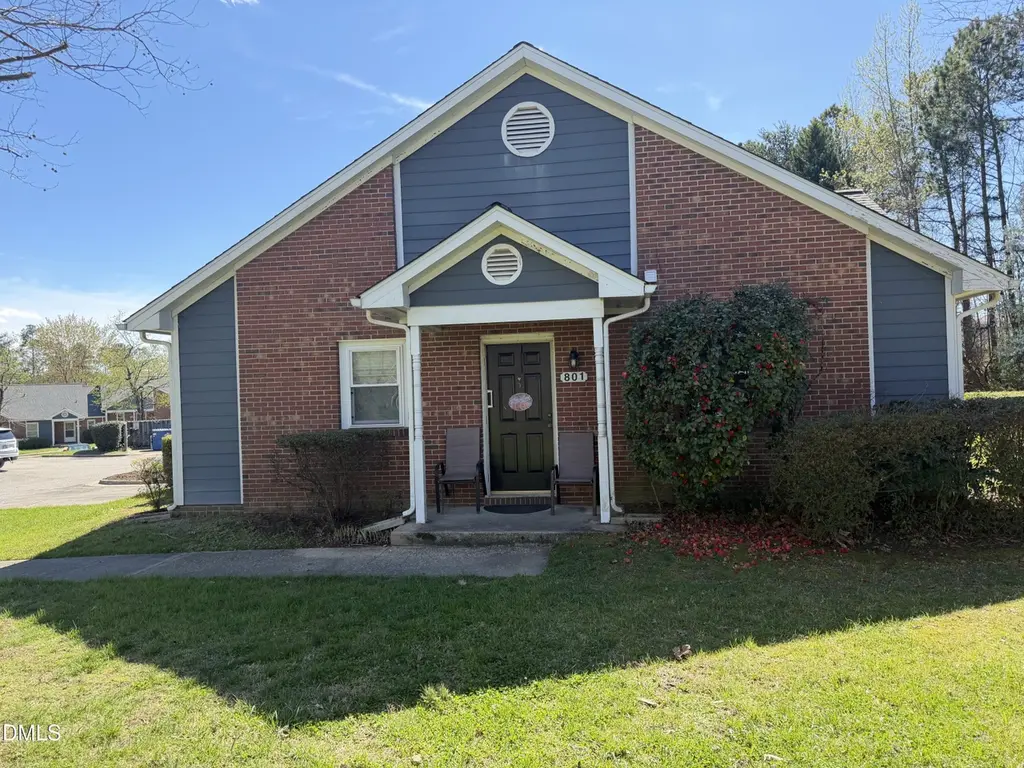
801 Pine Forest Trl · Knightdale, NC
Flood risk 1/10 · Minimal
- FEMA flood zone
- X (unshaded)
- Chance of flooding over 30 yrs
- 0.0%
- Est. flood insurance / yr
- $507 – $1,088
Fire risk 3/10 · Minor
- Est. fire insurance / yr
- $906 – $1,684
Heat risk 7/10 · Major
- Hot days now (above 105°F)
- 7 days/yr
- Hot days in 30 yrs
- 17 days/yr
Wind risk 6/10 · Moderate
- Chance of severe wind over 30 yrs
- 62.0%
Air-quality risk 3/10 · Minor
- Unhealthy air days now
- 2 days/yr
- Unhealthy air days in 30 yrs
- 3 days/yr
Risk factors via First Street. Map © Google.
Why this score? — see what drove the D grade
The composite is a weighted blend of 9 inputs, each scored 0–100. Each bar is that input's sub-score; the figure is the points it added to the 100-point composite (weight × sub-score).
- Cash flow +12.2/30.0
- ARV discount +7.5/15.0
- 1% rule +5.3/10.0
- Schools +4.9/10.0
- Livability +4.1/5.0
- DSCR +3.6/10.0
- Condition / age +2.5/5.0
- Rent growth +2.1/5.0
- Appreciation +0.0/10.0
$152,250
🖨 Deal sheet (PDF) 📄 Offer letter ✓ Due diligence
Listing remarks MLS
END UNIT surrounded by park-like atmosphere, with two doors and plenty of windows. New windows.
Key facts
- 5 minutes from 540
- Close to amenities
- End-unit privacy
Tags
Property features AI
Finance
- Other: Zoning: GR8
- HOA & community: HOA (Woods of Parkside HOA); HOA covers grounds maintenance and trash; Monthly HOA fee of $210; additional annual fee of $225; Community features include curbs, sidewalks, street lights and suburban setting; Parking and management provided by association
Exterior
- Parking: 2 open/assigned asphalt parking spaces
- Utilities: Public water; Public sewer; Cable available; Phone available; Sewer connected; Water connected
- Home design: Townhouse end unit with one level; One common wall, no one above or below; Fixer condition; Facing direction not specified
- Construction: Brick and vinyl siding construction; Shingle roof; Slab foundation; Built as townhouse
- Exterior features: Covered front porch and patio; Patio; Porch; Cleared and grassed yard; City street frontage; Public maintained asphalt road
Interior
- Kitchen: Dishwasher; Oven; Refrigerator; Freezer; Water heater
- Bedrooms: 2 bedrooms (both on main level)
- Flooring: Luxury vinyl; Tile
- Bathrooms: 1 full bathroom
- Heating & cooling: Central heating; Central air conditioning
- Interior features: Dual closets; Walk-in shower; Storm door(s)
- Laundry & utility: Washer and dryer (laundry closet, in hall on main level)
Neighborhood map
What this means for you Summary
Snapshot
- This is a 2-bed/1.0-bath townhouse listed at $152k.
Deal economics
- At list price, monthly cash flow is $-31 ($-372/yr) — negative.
- To cash-flow at today's rent, offer at most $147k (3.6% below list).
- Meets the 1% rule at list price ($2k rent vs $152k).
- Recommended offer: $143k (6.0% below list) — sets the bar for market timing.
- Cap rate 6.0% vs local median 2.9% in Knightdale — top-decile yield for the area; either an underpriced asset or a hidden risk that comps aren't pricing in. Stress-test before assuming the spread holds.
Location & tenants
- Location reads 82/100 on livability (#11 in NC, #1,212 nationally) — a professional / high-income tenant draw. Strengths: housing A+, health & safety A+, commute A; Watch: amenities C-.
- Wake County Schools (suburban): math 52% / reading 60% proficiency, ranked #35 of 178 in NC (top 20%) — acceptable for families but not a draw, mixed tenant base, ~2y average lease.
- Zoned schools: Lockhart Elementary (math 18% / reading 28%, grade F, #1,168 of 1,410 statewide, top 83%, 459 students, 74% FRL); Neuse River Middle (math 20% / reading 30%, grade F, #396 of 475 statewide, top 84%, 908 students, 77% FRL); Knightdale High (math 15% / reading 50%, grade F, #441 of 535 statewide, top 83%, 1,702 students, 63% FRL) — zoned schools average 71% FRL vs 30% district-wide (41 pts higher); higher-poverty schools than district average — tighter screening recommended.
- Zoned-school proficiency averages 27% at this address vs 56% district-wide (-29 pts) — the specific schools serving this property underperform the Wake County Schools average; the district grade overstates school quality for this exact location.
- Market conditions: Rents soft (-1.4%/yr); 406 active listings in the ZIP; 15 comparable units currently listed for rent nearby; rentals at typical pace (median 22d on market — plan ~3-4 weeks tenant-placement turnaround); solid renter incomes; 15,249 units permitted in Wake County in 2024 (5,568 in 5+ unit buildings).
Forward outlook
- Local home prices are declining (-3.0%/yr); year-one equity from $1k of loan paydown is wiped out by about $5k of value loss. Plan a longer hold.
- Wake County population projected at +51% by 2050 — long-run rental-demand tailwind backs the buy-and-hold thesis.
Negotiation context
- It's been on market 76 days — a 6% lower offer ($143k) is reasonable based on typical stale-listing flexibility.
- 3 sale attempts since 18y ago; this cycle's ask has dropped $53k (26%) from the opening price — seller is motivated, your offer sets the floor, not the list.
- Current owner paid $71k; list at $152k implies a 114% gain — meaningful room to come down on a strong offer.
Risks & watch-outs
- Climate carrying-cost: major wind risk, 62% chance of damaging wind over 30y; extreme-heat days projected 7→17/yr by 2055 (HVAC capex compounding) — expect insurance premiums to compound above CPI over the hold.
Questions for the listing agent
- What do current leases actually rent for vs. the listed asking? Can we see a recent rent roll and the last 12 months of T-12 income?
- It's been on market 76 days. Have you received any prior offers? Is the seller open to a 6% concession, seller financing, or rate buy-down credit?
- What does the HOA fee cover, when was the last increase, and are there any pending special assessments or reserve-fund shortfalls?
- Why hasn't it sold? Are there any deal-killer items the seller is aware of (foundation, flood, title, zoning, code violations)?
- Is there a deadline driving the sale (1031 exchange, divorce, estate, relocation)? That informs how much negotiation room exists.
- Schools are F-rated, which usually means shorter tenancies and higher turnover. Who's the typical renter profile here, and what's been the actual vacancy rate?
- The area grade is low — what's the realistic commute time and amenity access for the typical tenant pool here? Any planned neighborhood developments (good or bad) we should know about?
- What's the average days-on-market for RENTAL listings here right now (not sales)? A rising rental-DOM trend means longer vacancies and softer asking-rent achievability than the comps imply.
- What's the recent tenant-quality profile in this submarket — average credit score on applications, eviction rate, late-payment / NSF rate, and stable-employment percentage? A property-management company in the area should have these aggregated.
- How much new for-sale + rental construction is in the pipeline within 1–3 miles? Heavy new supply typically softens prices + rents 12–24 months out; constrained supply supports both.
Investment metrics
- 1% rule
- 1.03% ✓
- Cap rate
- 6.05%
- Cash-on-cash
- -0.87%
- DSCR
- 0.96
- GRM
- 8.1
CMA / ARV
No comps found within radius.
Projected returns pro-forma
-3.0% appreciation · 0.0% rent growth · sell at horizon
- IRR
- -21.8%
- Equity multiple
- 0.27×
- Total profit
- $-31,087
- Equity at exit
- $22,701
- IRR
- -28.2%
- Equity multiple
- -0.10×
- Total profit
- $-46,751
- Equity at exit
- $13,164
Cash invested: $42,630 (down + closing). Projections, not guarantees.
Landlord ↔ Tenant lean methodology
- Overall (STATE)
- 85 Strongly Landlord-Friendly
- State North Carolina
- 85 Strongly Landlord-Friendly · R+3
- County
- — inherits STATE
- City
- — inherits STATE
ZIP-level market 27545
- Home prices YoY
- -33.1%
- Rents YoY
- -1.4%
- Active inventory
- 406
- Price-to-rent
- 8.1×
Monthly cashflow live
- Estimated rent
- $1,570 high interval (Pro) →
- Mortgage (P&I)
- −$798
- Tax from tax record
- −$182 /mo · $2,180/yr
- Insurance
- −$63
- HOA
- −$228
- Vacancy / Maint / Mgmt
- −$330
- Net cashflow
- $-31
Break-even live
Sensitivity live
| Price | -10% $55 | -5% $12 | +0% $-31 | +5% $-74 | +10% $-117 |
|---|---|---|---|---|---|
| Rent | -10% $-155 | -5% $-93 | +0% $-31 | +5% $31 | +10% $93 |
| Rate | -1.0pp $46 | -0.5pp $8 | base $-31 | +0.5pp $-70 | +1.0pp $-111 |
UW: 25.0% down · 7.5% · 30yr · 1.5% tax · 5.0% vac · 8.0% maint · 8.0% mgmt
Financing live
Cash to close
- Down payment
- $38,062
- Closing costs
- $4,568
- Reserves months
- —
- Total cash needed
- —
Loan-product check · same deal, 3 products live
Conventional
25% down · 7.5% · 30yr
- Down + closing
- —
- Monthly P&I
- —
- Monthly cashflow
- —
- DSCR
- —
- Eligible?
- —
Personal DTI + credit; lowest rate.
DSCR
20% down · 8.5% · 30yr
- Down + closing
- —
- Monthly P&I
- —
- Monthly cashflow
- —
- DSCR
- —
- Eligible?
- —
No personal income docs; deal must DSCR.
Hard money
10% down · 12.0% · 12mo
- Down + closing
- —
- Monthly P&I
- —
- Monthly cashflow
- —
- DSCR
- —
- Eligible?
- —
Short-term bridge; refi at stabilization.
Rent comps 15 comps
| Address | Beds | Baths | Sqft | Rent | $/sqft | DOM | Units | Dist |
|---|---|---|---|---|---|---|---|---|
| 1001 Greystone Common Dr Knightdale, NC | 1.0–3.0 | 1.0–2.0 | 948 | $1,490 | $1.57 | 3d | 32 | 0.39mi |
| 100 E Cameo Ln Knightdale, NC | 1.0–3.0 | 1.0–2.0 | 875 | $1,376 | $1.57 | 25d | 12 | 0.41mi |
| 1001 Mulford Ct Knightdale, NC | 1.0 | 1.0 | 858 | $1,990 | $2.32 | 5d | 6 | 0.45mi |
| 1025 Luxury Ln Durham, NC | 1.0–3.0 | 1.0–2.0 | 1093 | $2,244 | $2.05 | 3d | 58 | 0.53mi |
| 1201 Aragon Dr Knightdale, NC | 1.0–3.0 | 1.0–2.0 | 1028 | $1,358 | $1.32 | 3d | 22 | 0.79mi |
| 332 Bethlehem Rd Unit 338 Knightdale, NC | 2.0 | 1.0 | 800 | $1,325 | $1.66 | 25d | 1 | 0.97mi |
| 332 Bethlehem Rd Unit 340 Knightdale, NC | 2.0 | 1.0 | 800 | $1,275 | $1.59 | 25d | 1 | 0.97mi |
| 375 Railroad St Knightdale, NC | 2.0 | 1.0 | 816 | $1,295 | $1.59 | 25d | 1 | 0.99mi |
| 335 Railroad St Knightdale, NC | 2.0 | 1.0 | 810 | $1,245 | $1.54 | 4d | 3 | 1.00mi |
| 357 Railroad St Knightdale, NC | 2.0 | 1.0 | 816 | $1,245 | $1.53 | 22d | 1 | 1.00mi |
| 323 Railroad St Knightdale, NC | 2.0 | 1.0 | 805 | $1,195 | $1.48 | 22d | 1 | 1.02mi |
| 6833 Forestville Rd Raleigh, NC | 3.0 | 1.5 | 1092 | $1,600 | $1.47 | 25d | 1 | 1.16mi |
| 485 Traebert Cir Knightdale, NC | 1.0 | 1.0 | 949 | $1,415 | $1.49 | 25d | 1 | 1.30mi |
| 485 Traebert Cir Knightdale, NC | 2.0 | 2.0 | 1122 | $1,485 | $1.32 | 5d | 1 | 1.30mi |
| 341 Sugar Magnolia Ln Knightdale, NC | 1.0–2.0 | 1.0–2.0 | 950 | $2,075 | $2.18 | 25d | 85 | 1.49mi |
HOA detail
- Monthly dues
- $228 · $2,736/yr
Listing history 13 events
-
2026-06-02statusdays on market $152,250 Pending 76 DOM
-
2026-06-01days on market $152,250 Active 75 DOM
-
2026-05-31days on market $152,250 Active 74 DOM
-
2026-04-24price $175,000
-
2026-03-27price $195,000
-
2026-03-18$205,000 Active
-
2008-08-15soldstatus $71,000 95-char remark
Show marketing remark (95 chars)
END UNIT surrounded by park-like atmosphere, with two doors and plenty of windows. New windows.
-
2008-08-15soldstatus $71,000
Show marketing remark (95 chars)
END UNIT surrounded by park-like atmosphere, with two doors and plenty of windows. New windows.
-
2008-07-31historical 95-char remark
Show marketing remark (95 chars)
END UNIT surrounded by park-like atmosphere, with two doors and plenty of windows. New windows.
-
2008-06-13historical
-
2008-06-12$69,900 95-char remark
Show marketing remark (95 chars)
END UNIT surrounded by park-like atmosphere, with two doors and plenty of windows. New windows.
-
2008-04-29$74,000
-
1989-03-07soldstatus $56,500
ⓘ Source: listings_history table (triggers on properties + properties_extension) + one-shot
backfill from property_details.listing_events for pre-trigger history.
Tax reassessment forecast NC · Resets to sale price
- Current annual tax
- $2,180 · $182/mo
- Projected year-2 tax
- $2,180 · $182/mo
- Expected delta
- $0/yr ($0/mo · 0.0%)
ⓘ Screening estimate from a state-policy table — verify with the county assessor before closing.
Climate risk First Street
- Flood 1/10 Low FEMA zone X (unshaded) · 0% chance over 30 yrs
- Wildfire 3/10 Moderate
- Heat 7/10 Severe 7 d/yr ≥105°F today · 17 d/yr by 30 yrs out
- Wind 6/10 Major 62% chance of damaging wind over 30 yrs
- Air quality 3/10 Moderate 2 unhealthy d/yr today · 3 by 30 yrs out
Nearby sold comps map
Loading sold comps map…
Walkable amenities ~0.75 mi
Loading nearby amenities…
Taxation est. · year 1
- Rental income
- $18,844
- − Mortgage interest
- −$8,528
- − Property taxes
- −$2,180
- − Insurance
- −$761
- − Repairs & maintenance
- −$1,507
- − Management
- −$1,507
- − HOA
- −$2,736
- − Depreciation
- −$4,429
- Taxable loss
- −$2,806
- Est. tax savings @ 24.0%
- +$673
- After-tax cash flow
- $302/yr
For passive investors: Depreciation is non-cash, so a rental often shows a tax loss while cash-flowing — sheltering income. Rental losses are passive: they offset passive income freely, and up to $25,000/yr can offset ordinary (W-2) income if you actively participate and your MAGI is under $100k (phasing out to $0 by $150k); unused losses carry forward. On sale, claimed depreciation is recaptured at up to 25%, and gains may owe capital-gains tax (a 1031 exchange can defer both). Figures are a year-1 estimate at your 24.0% rate — not tax advice; consult a CPA.
Schools (NCES district)
- District
- Wake County Schools
- NCES district ID
- 3704720
- Math proficiency
- 52% ▲ 2.00%
- Reading proficiency
- 60% ▲ 4.00%
- Median HH income
- $67,509
- Composite
- 49.41/100
- National rank
- #2010
- State rank
- #35 of 178 in NC
Livability — Knightdale
- Score
- 82/100
- State rank
- #11
- US rank
- #1212
Category grades
Schools grade is shown separately in the Schools card above.
Census & demographics
- Census place
- Knightdale, NC
- County
- Wake County · 1,216,256 people
- City population
- 34,163
- Metro
- Raleigh-Cary, NC
- Population (ZIP)
- 34,163
- Household income
- $91,527
- Rent vs Own
- Severe rent burden
- 637.0
Population outlook (Wake County) Hauer SSP2
- Today (2025)
- 1,293,152 people
- By 2030
- 1,428,223 · +10.4%
- By 2040
- 1,698,188 · +31.3%
- By 2050
- 1,955,807 · +51.2%
- By 2075
- 2,520,273 · +94.9%
- By 2100
- 2,893,335 · +123.7%
Race, ethnicity, and origin ACS 2023
- Neighborhood character
- Highly diverse neighborhood (Simpson 0.70)
- Race & ethnicity
- Black 37% White 34% Hispanic / Latino 20% Two or more races 12% Asian 3%
- Hispanic origin (detail)
- Mexican 12% Dominican 2%
- Common ancestry
- Lithuanian 1% Romanian 1% Italian 1%
- Foreign-born
- 17% · Canada, Vietnam, Philippines
- Languages at home
- 77% English-only · Spanish 18% Other Indo-European 1% Other Asian/Pacific 1%
Political lean MEDSL · Wake
- 2024 margin
- Strong D (+25.5) · D 61.9% · R 36.4% · Other 1.7%
- 2008→2024 swing
- +11.1pp toward D · 2008: 14.4pp · 2024: 25.5pp
- All cycles
- 2024: D+25.5 2020: D+26.4 2016: D+20.5 2012: D+10.2 2008: D+14.4
Not yet ingested
- Civics
- —
Market trends
- HPI YoY
- ▼ -112.68%
- Current HPI
- 228.2131
- Rent YoY
- ▼ -1.44%
- Metro
- Raleigh-Cary, NC
- State GDP YoY
- ▲ 3.28%
- F500 in state
- 26
Industry mix (Fortune 500 HQ in NC)
| Industry | F500 HQs | Revenue |
|---|---|---|
| Financial Services | 2 | $213B |
|
||
| Retail | 2 | $95B |
|
||
| Industrial Conglomerate | 1 | $38B |
|
||
| Metals / Steel | 1 | $35B |
|
||
| Utilities | 1 | $30B |
|
||
| Industrial Machinery | 1 | $19B |
|
||
Price history
+209.7% since first listed10 events — show timeline
- 2026-04-24 Price Changed $175,000 TMLS
- 2026-03-27 Price Changed $195,000 TMLS
- 2026-03-18 Listed $205,000 TMLS
- 2008-08-15 Sold (Public Records) $71,000 Public Records
- 2008-08-15 Sold (MLS) $71,000 TMLS
- 2008-07-31 Listing Removed — TMLS
- 2008-06-13 Listing Removed — TMLS
- 2008-06-12 Listed $69,900 TMLS
- 2008-04-29 Listed $74,000 TMLS
- 1989-03-07 Sold (Public Records) $56,500 Public Records
Property tax history
+13.9%/yrLatest (2025): $2,180 · +98.9% YoY. Source: county tax records.
Cash-flow waterfall
monthlySold comps — $/sqft
last 12 mo · ≤1 miLoading sold comps…