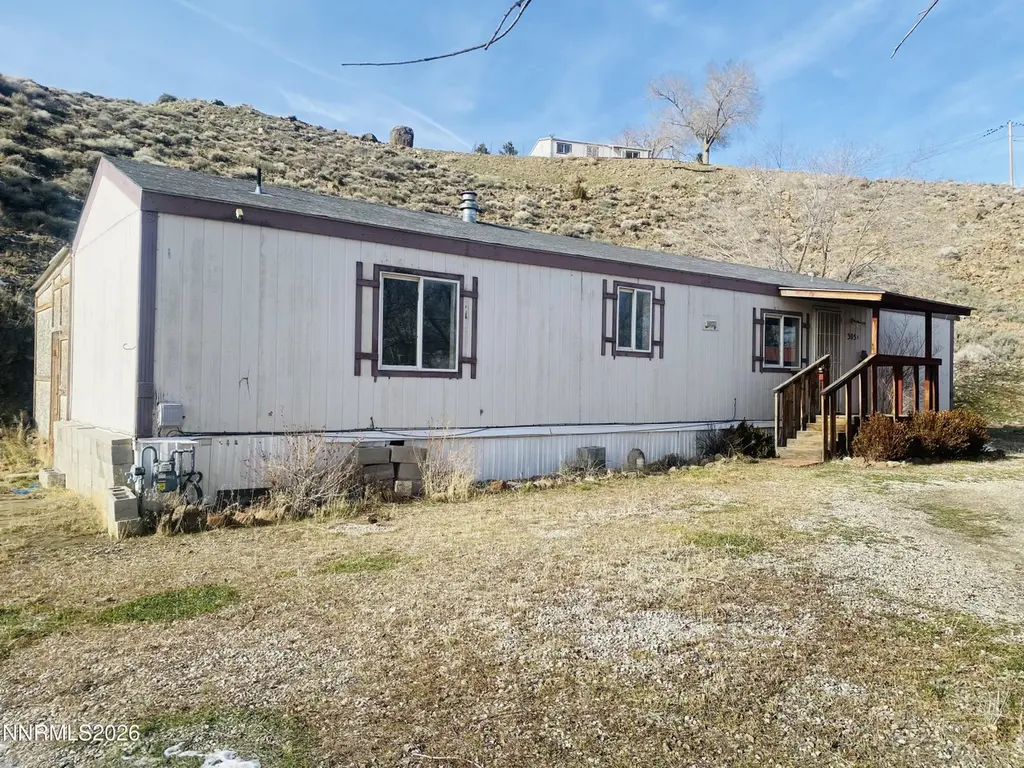
305 A Grosh Ave · Dayton, NV
Flood risk 5/10 · Moderate
- FEMA flood zone
- X (unshaded)
- Chance of flooding over 30 yrs
- 0.24%
- Est. flood insurance / yr
- $507 – $1,088
Fire risk 7/10 · Major
- Est. fire insurance / yr
- $490 – $910
Heat risk 5/10 · Moderate
- Hot days now (above 94°F)
- 8 days/yr
- Hot days in 30 yrs
- 22 days/yr
Wind risk 1/10 · Minimal
- Chance of severe wind over 30 yrs
- —
Air-quality risk 9/10 · Severe
- Unhealthy air days now
- 18 days/yr
- Unhealthy air days in 30 yrs
- 20 days/yr
Risk factors via First Street. Map © Google.
Why this score? — see what drove the C- grade
The composite is a weighted blend of 9 inputs, each scored 0–100. Each bar is that input's sub-score; the figure is the points it added to the 100-point composite (weight × sub-score).
- Cash flow +17.2/30.0
- ARV discount +15.0/15.0
- DSCR +5.4/10.0
- 1% rule +3.4/10.0
- Livability +3.2/5.0
- Rent growth +2.5/5.0
- Condition / age +2.5/5.0
- Schools +2.4/10.0
- Appreciation +0.0/10.0
$185,000
🖨 Deal sheet (PDF) 📄 Offer letter ✓ Due diligence
Listing remarks MLS
Single wide home on 1 acre of property. No HOA to contend with. House is on natural gas, city water, power and a septic system. Home has not been converted to real property but could be converted. Property has not been moved.
Key facts
- 1 acre lot
- Built 1996
- Listed 160 days
Neighborhood map
What this means for you Summary
Snapshot
- This is a 2-bed/2.0-bath manufactured listed at $185k.
Deal economics
- At list price, monthly cash flow is $131 ($2k/yr) — positive.
- The deal already cash-flows at list — no discount required.
- To meet the 1% rule (rent ≥ 1% of price), the offer needs to be $155k (16.4% below list).
- Recommended offer: $155k (16.4% below list) — sets the bar for 1% rule.
- Cap rate 7.1% vs local median 2.6% in Dayton — top-decile yield for the area; either an underpriced asset or a hidden risk that comps aren't pricing in. Stress-test before assuming the spread holds.
Location & tenants
- Location reads 64/100 on livability (#51 in NV) — a middle-class / working-renter tenant base. Strengths: housing A+; Watch: schools F, amenities F, commute F.
- Lyon County School District (town): math 21% / reading 35% proficiency, ranked #14 of 17 in NV (top 82%) — low school quality limits family demand, transient renter base, plan for 1-2y turnover.
- Market conditions: 142 active listings in the ZIP; 2 comparable units currently listed for rent nearby; 297 units permitted in Lyon County in 2024 (80 in 5+ unit buildings).
Forward outlook
- Local home prices are declining (-3.0%/yr); year-one equity from $1k of loan paydown is wiped out by about $6k of value loss. Plan a longer hold.
- Lyon County population projected at -20% by 2050 — secular population decline; favor cash flow + early exit over multi-decade hold.
Negotiation context
- It's been on market 160 days — a 12% lower offer ($163k) is reasonable based on typical stale-listing flexibility.
- 4 sale attempts since 18y ago with the ask held roughly flat each time — persistent listings suggest the price (not the market) is what's stuck; bring a comps-based counter.
- Current owner paid $92k; list at $185k implies a 100% gain — meaningful room to come down on a strong offer.
Risks & watch-outs
- Climate carrying-cost: moderate flood risk; major wildfire risk; extreme-heat days projected 8→22/yr by 2055 (HVAC capex compounding) — expect insurance premiums to compound above CPI over the hold.
Questions for the listing agent
- It's been on market 160 days. Have you received any prior offers? Is the seller open to a 16% concession, seller financing, or rate buy-down credit?
- Why hasn't it sold? Are there any deal-killer items the seller is aware of (foundation, flood, title, zoning, code violations)?
- Is there a deadline driving the sale (1031 exchange, divorce, estate, relocation)? That informs how much negotiation room exists.
- Schools are F-rated, which usually means shorter tenancies and higher turnover. Who's the typical renter profile here, and what's been the actual vacancy rate?
- What's the average days-on-market for RENTAL listings here right now (not sales)? A rising rental-DOM trend means longer vacancies and softer asking-rent achievability than the comps imply.
- What's the recent tenant-quality profile in this submarket — average credit score on applications, eviction rate, late-payment / NSF rate, and stable-employment percentage? A property-management company in the area should have these aggregated.
- How much new for-sale + rental construction is in the pipeline within 1–3 miles? Heavy new supply typically softens prices + rents 12–24 months out; constrained supply supports both.
Investment metrics
- 1% rule
- 0.84% ✗
- Cap rate
- 7.14%
- Cash-on-cash
- 3.04%
- DSCR
- 1.14
- GRM
- 10.0
CMA / ARV
- ARV (median comp)
- $351,260
- List price
- $185,000
- Delta
- -47.33%
- Verdict
- UNDERPRICED
- Comps
- 3 within 1.0 mi
Show comp detail 1 sale within ~0.75 mi
| Address | Dist | Beds/Ba | Sqft | Sold | Price | $/sf | Match |
|---|---|---|---|---|---|---|---|
| 212 Coons Cir Unit E | 0.34mi | 2/2.0 | 960 (+14%) | 19mo | $229,000 | $239 | 45 |
Match score weights: distance 35% · size 25% · config 20% · recency 20%. Top-matched comps best support the ARV.
Projected returns pro-forma
-3.0% appreciation · 3.0% rent growth · sell at horizon
- IRR
- -11.6%
- Equity multiple
- 0.58×
- Total profit
- $-21,725
- Equity at exit
- $27,584
- IRR
- -2.4%
- Equity multiple
- 0.83×
- Total profit
- $-8,548
- Equity at exit
- $15,995
Cash invested: $51,800 (down + closing). Projections, not guarantees.
Landlord ↔ Tenant lean methodology
- Overall (STATE)
- 71 Landlord-Friendly
- State Nevada
- 71 Landlord-Friendly · R+1
- County
- — inherits STATE
- City
- — inherits STATE
ZIP-level market 89403
- Home prices YoY
- -27.8%
- Active inventory
- 142
- Price-to-rent
- 10.0×
Monthly cashflow live
- Estimated rent
- $1,546 medium interval (Pro) →
- Mortgage (P&I)
- −$970
- Tax from tax record
- −$43 /mo · $518/yr
- Insurance
- −$77
- HOA
- −$0
- Vacancy / Maint / Mgmt
- −$325
- Net cashflow
- $131
Break-even live
Sensitivity live
| Price | -10% $236 | -5% $183 | +0% $131 | +5% $79 | +10% $26 |
|---|---|---|---|---|---|
| Rent | -10% $9 | -5% $70 | +0% $131 | +5% $192 | +10% $253 |
| Rate | -1.0pp $224 | -0.5pp $178 | base $131 | +0.5pp $83 | +1.0pp $34 |
UW: 25.0% down · 7.5% · 30yr · 1.5% tax · 5.0% vac · 8.0% maint · 8.0% mgmt
Financing live
Cash to close
- Down payment
- $46,250
- Closing costs
- $5,550
- Reserves months
- —
- Total cash needed
- —
Loan-product check · same deal, 3 products live
Conventional
25% down · 7.5% · 30yr
- Down + closing
- —
- Monthly P&I
- —
- Monthly cashflow
- —
- DSCR
- —
- Eligible?
- —
Personal DTI + credit; lowest rate.
DSCR
20% down · 8.5% · 30yr
- Down + closing
- —
- Monthly P&I
- —
- Monthly cashflow
- —
- DSCR
- —
- Eligible?
- —
No personal income docs; deal must DSCR.
Hard money
10% down · 12.0% · 12mo
- Down + closing
- —
- Monthly P&I
- —
- Monthly cashflow
- —
- DSCR
- —
- Eligible?
- —
Short-term bridge; refi at stabilization.
Rent comps 2 comps
| Address | Beds | Baths | Sqft | Rent | $/sqft | DOM | Units | Dist |
|---|---|---|---|---|---|---|---|---|
| 415 Valley Cir Unit D Dayton, NV | 2.0 | 2.5 | 1053 | $1,450 | $1.38 | 23d | 1 | 0.45mi |
| 300 Sweetwater Cir Unit D Dayton, NV | 2.0 | 1.5 | 1100 | $1,700 | $1.55 | 16d | 1 | 0.69mi |
Listing history 24 events
-
2026-06-22days on market $185,000 Active 160 DOM
-
2026-06-18days on market $185,000 Active 157 DOM
-
2026-06-17days on market $185,000 Active 156 DOM
-
2026-06-16days on market $185,000 Active 155 DOM
-
2026-06-15days on market $185,000 Active 154 DOM
-
2026-06-14days on market $185,000 Active 152 DOM
-
2026-06-13days on market $185,000 Active 151 DOM
-
2026-06-10days on market $185,000 Active 149 DOM
-
2026-06-09days on market $185,000 Active 148 DOM
-
2026-06-08days on market $185,000 Active 147 DOM
-
2026-06-07days on market $185,000 Active 146 DOM
-
2026-06-03days on market $185,000 Active 142 DOM
-
2026-06-02days on market $185,000 Active 141 DOM
-
2026-06-01days on market $185,000 Active 140 DOM
-
2026-05-31days on market $185,000 Active 139 DOM
-
2026-05-30days on market $185,000 Active 138 DOM
-
2026-02-14status Active 225-char remark
Show marketing remark (225 chars)
Single wide home on 1 acre of property. No HOA to contend with. House is on natural gas, city water, power and a septic system. Home has not been converted to real property but could be converted. Property has not been moved.
-
2026-02-06historical Active Under Contract-Show 225-char remark
Show marketing remark (225 chars)
Single wide home on 1 acre of property. No HOA to contend with. House is on natural gas, city water, power and a septic system. Home has not been converted to real property but could be converted. Property has not been moved.
-
2026-01-12$185,000 Active 225-char remark
Show marketing remark (225 chars)
Single wide home on 1 acre of property. No HOA to contend with. House is on natural gas, city water, power and a septic system. Home has not been converted to real property but could be converted. Property has not been moved.
-
2025-12-26soldstatus $92,308
-
2009-05-11historical
-
2009-03-23$99,900
-
2009-01-16historical
-
2008-10-01$88,999
ⓘ Source: listings_history table (triggers on properties + properties_extension) + one-shot
backfill from property_details.listing_events for pre-trigger history.
Tax reassessment forecast NV · Resets to sale price
- Current annual tax
- $518 · $43/mo
- Projected year-2 tax
- $1,092 · $91/mo
- Expected delta
- +$573/yr (+$48/mo · 110.7%)
ⓘ Screening estimate from a state-policy table — verify with the county assessor before closing.
Climate risk First Street
- Flood 5/10 Major FEMA zone X (unshaded) · 24% chance over 30 yrs
- Wildfire 7/10 Severe
- Heat 5/10 Major 8 d/yr ≥94°F today · 22 d/yr by 30 yrs out
- Wind 1/10 Low
- Air quality 9/10 Extreme 18 unhealthy d/yr today · 20 by 30 yrs out
Nearby sold comps map
Loading sold comps map…
Walkable amenities ~0.75 mi
Loading nearby amenities…
Taxation est. · year 1
- Rental income
- $18,553
- − Mortgage interest
- −$10,363
- − Property taxes
- −$518
- − Insurance
- −$925
- − Repairs & maintenance
- −$1,484
- − Management
- −$1,484
- − Depreciation
- −$5,382
- Taxable loss
- −$1,603
- Est. tax savings @ 24.0%
- +$385
- After-tax cash flow
- $1,957/yr
For passive investors: Depreciation is non-cash, so a rental often shows a tax loss while cash-flowing — sheltering income. Rental losses are passive: they offset passive income freely, and up to $25,000/yr can offset ordinary (W-2) income if you actively participate and your MAGI is under $100k (phasing out to $0 by $150k); unused losses carry forward. On sale, claimed depreciation is recaptured at up to 25%, and gains may owe capital-gains tax (a 1031 exchange can defer both). Figures are a year-1 estimate at your 24.0% rate — not tax advice; consult a CPA.
Schools (NCES district)
- District
- Lyon County School District
- NCES district ID
- 3200300
- Math proficiency
- 21% ▼ -11.00%
- Reading proficiency
- 35% ▼ -7.00%
- Median HH income
- $48,197
- Composite
- 24.32/100
- National rank
- #7707
- State rank
- #14 of 17 in NV
Livability — Dayton
- Score
- 64/100
- State rank
- #51
- US rank
- #14849
Category grades
Schools grade is shown separately in the Schools card above.
Census & demographics
- Census place
- Dayton, NV
- Population (ZIP)
- 17,391
Population outlook (Lyon County) Hauer SSP2
- Today (2025)
- 51,655 people
- By 2030
- 50,194 · -2.8%
- By 2040
- 46,155 · -10.6%
- By 2050
- 41,580 · -19.5%
- By 2075
- 32,687 · -36.7%
- By 2100
- 24,111 · -53.3%
Race, ethnicity, and origin ACS 2023
- Neighborhood character
- Predominantly White (72%)
- Race & ethnicity
- White 72% Hispanic / Latino 23% Two or more races 14% Asian 2% Native American 1%
- Hispanic origin (detail)
- Mexican 18% Cuban 2%
- Common ancestry
- Lithuanian 3% Portuguese 3% Italian 2%
- Foreign-born
- 8% · Canada
- Languages at home
- 85% English-only · Spanish 12% Tagalog/Filipino 1%
Political lean MEDSL · Lyon
- 2024 margin
- Solid R (+44.4) · D 26.7% · R 71.1% · Other 2.2%
- 2008→2024 swing
- -26.5pp toward R · 2008: -17.9pp · 2024: -44.4pp
- All cycles
- 2024: R+44.4 2020: R+41.1 2016: R+41.5 2012: R+28.6 2008: R+17.9
Not yet ingested
- Civics
- —
Market trends
- HPI YoY
- ▼ -93.09%
- Current HPI
- 241.5196
- Rent YoY
- —
- Metro
- —
- State GDP YoY
- ▲ 3.08%
- F500 in state
- 6
Industry mix (Fortune 500 HQ in NV)
| Industry | F500 HQs | Revenue |
|---|---|---|
| Hotels / Casinos | 3 | $36B |
|
||
Price history
+107.9% since first listed8 events — show timeline
- 2026-02-14 Relisted — NNRMLS
- 2026-02-06 Contingent — NNRMLS
- 2026-01-12 Listed $185,000 NNRMLS
- 2025-12-26 Sold (Public Records) $92,308 Public Records
- 2009-05-11 Listing Removed — NNRMLS
- 2009-03-23 Listed $99,900 NNRMLS
- 2009-01-16 Listing Removed — NNRMLS
- 2008-10-01 Listed $88,999 NNRMLS
Property tax history
+5.3%/yrLatest (2025): $518 · +3.0% YoY. Source: county tax records.
Cash-flow waterfall
monthlySold comps — $/sqft
last 12 mo · ≤1 miLoading sold comps…