5484 N 43rd Ave #5 · Glendale, AZ
Flood risk 1/10 · Minimal
- FEMA flood zone
- X (shaded)
- Chance of flooding over 30 yrs
- 0.0%
- Est. flood insurance / yr
- $507 – $1,088
Fire risk 1/10 · Minimal
- Est. fire insurance / yr
- $610 – $1,132
Heat risk 9/10 · Severe
- Hot days now (above 112°F)
- 7 days/yr
- Hot days in 30 yrs
- 17 days/yr
Wind risk 1/10 · Minimal
- Chance of severe wind over 30 yrs
- —
Air-quality risk 2/10 · Minimal
- Unhealthy air days now
- 0 days/yr
- Unhealthy air days in 30 yrs
- 1 days/yr
Risk factors via First Street. Map © Google.
Why this score? — see what drove the B grade
The composite is a weighted blend of 9 inputs, each scored 0–100. Each bar is that input's sub-score; the figure is the points it added to the 100-point composite (weight × sub-score).
- Cash flow +30.0/30.0
- ARV discount +15.0/15.0
- 1% rule +10.0/10.0
- DSCR +10.0/10.0
- Livability +3.8/5.0
- Condition / age +2.2/5.0
- Rent growth +1.8/5.0
- Schools +1.1/10.0
- Appreciation +0.0/10.0
$65,000
🖨 Deal sheet 📄 Offer letter ✓ Due diligence
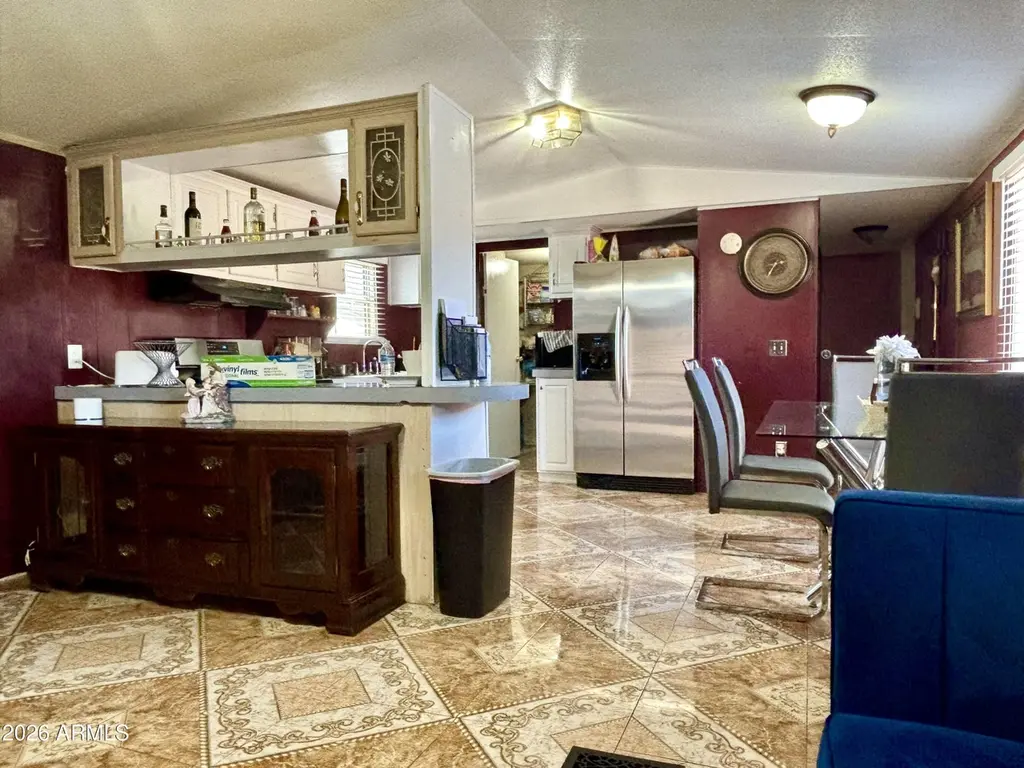
Listing remarks
PRIVATE-FENCED BACKYARD IN ALL AGES COMMUNITY- FINANCING AVAILABLE WITH LOW DOWNPAYMENT. RENOVATED AND MOVE IN READY. 3 Bedroom / 2 Bathroom manufactured home on affordable land lease. ALL APPLIANCES INCLUDED. Newer Roof. Lots of Storage. Central AC and mini-splits both are installed and available to be use.
Key facts
- 2 parking spots
- Built 1995
- Listed 28 days
Property features AI
Finance
- HOA & community: Land lease of $650 monthly; No association fees
Exterior
- Parking: 2 open parking spaces; Assigned parking
- Utilities: City water; Public sewer
- Home design: Manufactured/Mobile home; Leasehold ownership; Asphalt road access
- Construction: Vinyl siding; Steel frame construction; Composition roof; Building area provided by owner
- Exterior features: Storage; Gravel/stone at back of lot; City maintained road
Interior
- Bedrooms: 3 possible bedrooms
- Flooring: Tile flooring
- Bathrooms: 2 full bathrooms
- Heating & cooling: Mini split heating; Central air; Ceiling fans; Window/wall unit
- Interior features: Granite counters; Eat-in kitchen; Full bath in master bedroom; Dual pane windows
Neighborhood map
What this means for you Summary
Snapshot
- This is a 3-bed/2.0-bath manufactured listed at $65k. Condition is rated fair.
Deal economics
- At list price, monthly cash flow is $707 ($8k/yr) — positive.
- The deal already cash-flows at list — no discount required.
- Meets the 1% rule at list price ($1k rent vs $65k).
- Recommended offer: $64k (1.5% below list) — sets the bar for market timing.
- Cap rate 19.4% vs local median 3.5% in Glendale — top-decile yield for the area; either an underpriced asset or a hidden risk that comps aren't pricing in. Stress-test before assuming the spread holds.
Location & tenants
- Location reads 76/100 on livability (#12 in AZ, #3,235 nationally) — a middle-class / working-renter tenant base. Strengths: commute A+, housing A+, amenities B; Watch: health & safety D+, crime F.
- Phoenix Union High School District (4286) (urban): math 10% / reading 15% proficiency, ranked #224 of 249 in AZ (top 90%) — low school quality limits family demand, transient renter base, plan for 1-2y turnover.
- Zoned schools: Alhambra High School (math 8% / reading 17%, grade F, #281 of 381 statewide, top 75%, 2,282 students, 86% FRL).
- Market conditions: Rents soft (-3.0%/yr); 215 active listings in the ZIP; 40 comparable units currently listed for rent nearby; rentals leasing fast (median 1d on market — plan ~1-2 weeks tenant-placement turnaround); 36,011 units permitted in Maricopa County in 2024 (12,801 in 5+ unit buildings).
- This rent runs 33% of the median local income ($54k/yr) — at the standard rent-burdened threshold; future hikes will face affordability resistance.
Forward outlook
- Local home prices are declining (-3.0%/yr); year-one equity from $449 of loan paydown is wiped out by about $2k of value loss. Plan a longer hold.
- Maricopa County population projected at +38% by 2050 — long-run rental-demand tailwind backs the buy-and-hold thesis.
- At projected returns (-3.0% appreciation + 0.0% rent growth), your $18k cash investment doubles in ~3 years — after that, you're playing with house money.
Negotiation context
- It's been on market 28 days — a 2% lower offer ($64k) is reasonable based on typical stale-listing flexibility.
Risks & watch-outs
- Climate carrying-cost: extreme-heat days projected 7→17/yr by 2055 (HVAC capex compounding) — expect insurance premiums to compound above CPI over the hold.
Questions for the listing agent
- Have any recent inspections been done? Can we get a copy of the seller's disclosures and any deferred-maintenance estimates?
- Is there a deadline driving the sale (1031 exchange, divorce, estate, relocation)? That informs how much negotiation room exists.
- Crime grade is F in this area — have there been break-ins, vandalism, or insurance claims at this property in the last 3 years? What carrier currently insures it and at what premium?
- What's the average days-on-market for RENTAL listings here right now (not sales)? A rising rental-DOM trend means longer vacancies and softer asking-rent achievability than the comps imply.
- What's the recent tenant-quality profile in this submarket — average credit score on applications, eviction rate, late-payment / NSF rate, and stable-employment percentage? A property-management company in the area should have these aggregated.
- How much new for-sale + rental construction is in the pipeline within 1–3 miles? Heavy new supply typically softens prices + rents 12–24 months out; constrained supply supports both.
Investment metrics
- 1% rule
- 2.25% ✓
- Cap rate
- 19.35%
- Cash-on-cash
- 46.64%
- DSCR
- 3.08
- GRM
- 3.7
CMA / ARV
- ARV (on-the-fly)
- $82,688
- Comps found
- 7
Show comp detail 7 sales within ~0.75 mi
| Address | Dist | Beds/Ba | Sqft | Sold | Price | $/sf | Match |
|---|---|---|---|---|---|---|---|
| 5484 N 43rd Ave #5 | 0.00mi | 3/2.0 | 1,216 (0%) | 1mo | $65,000 | $53 | 99 |
| 4400 W Missouri Ave #45 | 0.10mi | 3/2.0 | 1,296 (+7%) | 8mo | $54,000 | $42 | 77 |
| 4400 W Missouri Ave #286 | 0.10mi | 3/2.0 | 1,120 (-8%) | 10mo | $105,000 | $94 | 74 |
| 4400 W Missouri Ave #76 | 0.10mi | 3/2.0 | 1,248 (+3%) | 21mo | $80,000 | $64 | 73 |
| 4400 W Missouri Ave #25 | 0.18mi | 4/2.0 (+1) | 1,344 (+10%) | 2mo | $92,000 | $68 | 68 |
| 4400 W Missouri Ave #219 | 0.10mi | 2/2.0 (-1) | 1,040 (-14%) | 15mo | $89,500 | $86 | 53 |
| 4400 W Missouri Ave #230 | 0.10mi | 2/2.0 (-1) | 1,040 (-14%) | 18mo | $89,200 | $86 | 51 |
Match score weights: distance 35% · size 25% · config 20% · recency 20%. Top-matched comps best support the ARV.
Projected returns pro-forma
-3.0% appreciation · 0.0% rent growth · sell at horizon
- IRR
- 40.5%
- Equity multiple
- 2.66×
- Total profit
- $30,253
- Equity at exit
- $9,692
- IRR
- 45.3%
- Equity multiple
- 4.73×
- Total profit
- $67,868
- Equity at exit
- $5,620
Cash invested: $18,200 (down + closing). Projections, not guarantees.
Landlord ↔ Tenant lean methodology
- Overall (STATE)
- 87 Strongly Landlord-Friendly
- State Arizona
- 87 Strongly Landlord-Friendly · R+3
- County
- — inherits STATE
- City
- — inherits STATE
ZIP-level market 85301
- Home prices YoY
- -10.6%
- Rents YoY
- -3.0%
- Active inventory
- 215
- Price-to-rent
- 3.7×
Monthly cashflow live
- Estimated rent
- $1,464 high interval (Pro) →
- Mortgage (P&I)
- −$341
- Tax est. 1.5%
- −$81 /mo · $975/yr
- Insurance
- −$27
- HOA
- −$0
- Vacancy / Maint / Mgmt
- −$307
- Net cashflow
- $707
Break-even live
UW: 25.0% down · 7.5% · 30yr · 1.5% tax · 5.0% vac · 8.0% maint · 8.0% mgmt
Financing live
Cash to close
- Down payment
- $16,250
- Closing costs
- $1,950
- Reserves months
- —
- Total cash needed
- —
Loan-product check · same deal, 3 products live
Conventional
25% down · 7.5% · 30yr
- Down + closing
- —
- Monthly P&I
- —
- Monthly cashflow
- —
- DSCR
- —
- Eligible?
- —
Personal DTI + credit; lowest rate.
DSCR
20% down · 8.5% · 30yr
- Down + closing
- —
- Monthly P&I
- —
- Monthly cashflow
- —
- DSCR
- —
- Eligible?
- —
No personal income docs; deal must DSCR.
Hard money
10% down · 12.0% · 12mo
- Down + closing
- —
- Monthly P&I
- —
- Monthly cashflow
- —
- DSCR
- —
- Eligible?
- —
Short-term bridge; refi at stabilization.
Rent comps 40 comps
| Address | Beds | Baths | Sqft | Rent | $/sqft | DOM | Units | Dist |
|---|---|---|---|---|---|---|---|---|
| 4132 W Colter St Phoenix, AZ | 3.0 | 2.0 | 1332 | $1,795 | $1.35 | 1d | 1 | 0.32mi |
| 5710 N 43rd Dr Glendale, AZ | 3.0 | 2.5 | 1296 | $1,900 | $1.47 | 1d | 1 | 0.33mi |
| 4056 W Mesquite Ln Phoenix, AZ | 3.0 | 1.5 | 1005 | $1,500 | $1.49 | 1d | 1 | 0.47mi |
| 4029 W Mesquite Ln Phoenix, AZ | 2.0 | 1.0 | 924 | $1,195 | $1.29 | 21d | 1 | 0.52mi |
| 5040 N 40th Ave Phoenix, AZ | 2.0 | 1.0 | 924 | $1,195 | $1.29 | 1d | 1 | 0.53mi |
| 5030 N 40th Ave Phoenix, AZ | 2.0 | 1.0 | 924 | $1,100 | $1.19 | 1d | 1 | 0.55mi |
| 5041 N 40th Ave Phoenix, AZ | 3.0 | 1.0 | 1005 | $1,195 | $1.19 | 1d | 1 | 0.56mi |
| 4404 W Bethany Home Rd Glendale, AZ | 1.0–2.0 | 1.0 | 665 | $1,370 | $2.06 | 1d | 4 | 0.59mi |
| 4749 N 39th Dr Phoenix, AZ | 3.0 | 2.0 | 1280 | $1,720 | $1.34 | 1d | 1 | 0.78mi |
| 3734 W Camelback Rd Phoenix, AZ | 1.0–2.0 | 1.0 | 725 | $1,249 | $1.72 | 1d | 1 | 0.86mi |
| 6251 N 48th Ave Apt 4 Glendale, AZ | 2.0 | 1.0 | 850 | $925 | $1.09 | 3d | 1 | 0.94mi |
| 4647 N 39th Ave Phoenix, AZ | 1.0–2.0 | 1.0–1.5 | 727 | $1,000 | $1.37 | 1d | 1 | 0.96mi |
| 4540 N 39th Ave Phoenix, AZ | 2.0 | 1.0 | 810 | $1,397 | $1.72 | 1d | 1 | 1.03mi |
| 3839 W Hazelwood St Unit 5 Phoenix, AZ | 2.0 | 1.0 | 995 | $950 | $0.95 | 1d | 1 | 1.07mi |
| 3839 W Hazelwood St Unit 5 Phoenix, AZ | 2.0 | 1.0 | 995 | $1,050 | $1.06 | 23d | 1 | 1.07mi |
| 4436 N 47th Ave Phoenix, AZ | 3.0 | 2.0 | 1296 | $1,510 | $1.17 | 18d | 1 | 1.08mi |
| 3807 W Hazelwood St Phoenix, AZ | 3.0 | 2.0 | 1121 | $1,635 | $1.46 | 1d | 1 | 1.11mi |
| 4608 W Maryland Ave Glendale, AZ | 2.0–3.0 | 2.0 | 1141 | $1,700 | $1.49 | 2d | 4 | 1.11mi |
| 4608 W Maryland Ave Glendale, AZ | 3.0 | 2.0 | 1215 | $1,598 | $1.31 | 1d | 3 | 1.11mi |
| 4608 W Maryland Ave Glendale, AZ | 2.0–3.0 | 2.0 | 1141 | $1,700 | $1.49 | 1d | 4 | 1.11mi |
| 4562 W Maryland Ave Glendale, AZ | 3.0 | 2.0 | 1230 | $1,798 | $1.46 | 19d | 1 | 1.12mi |
| 3636 W Keim Dr Phoenix, AZ | 3.0 | 2.0 | 1389 | $1,995 | $1.44 | 1d | 1 | 1.16mi |
| 3515 W Rovey Ave Unit 3515-01 Phoenix, AZ | 2.0 | 1.0 | 900 | $1,250 | $1.39 | 14d | 1 | 1.19mi |
| 6550 N 47th Ave Phoenix, AZ | 2.0 | 2.0 | 1044 | $1,400 | $1.34 | 1d | 1 | 1.21mi |
| 4530 W McLellan Rd Glendale, AZ | 1.0–3.0 | 1.0 | 782 | $1,749 | $2.24 | 1d | 6 | 1.23mi |
| 6144 N 35th Dr Phoenix, AZ | 2.0 | 1.0 | 800 | $1,775 | $2.22 | 1d | 1 | 1.26mi |
| 6551 N 49th Ave Glendale, AZ | 2.0–3.0 | 2.0 | 1165 | $2,150 | $1.84 | 1d | 6 | 1.27mi |
| 4748 W Sierra Vista Dr Unit B1 Glendale, AZ | 2.0 | 2.0 | 875 | $1,170 | $1.34 | 1d | 1 | 1.28mi |
| 4748 W Sierra Vista Dr Glendale, AZ | 2.0 | 2.0 | 875 | $1,262 | $1.44 | 21d | 1 | 1.31mi |
| 4748 W Sierra Vista Dr Glendale, AZ | 2.0 | 2.0 | 875 | $1,185 | $1.35 | 3d | 1 | 1.31mi |
| 4444 W Ocotillo Rd Glendale, AZ | 1.0–2.0 | 1.0–1.5 | 766 | $1,250 | $1.63 | 1d | 3 | 1.35mi |
| 5044 W Maryland Ave Glendale, AZ | 3.0 | 1.0 | 1065 | $1,295 | $1.22 | 2d | 1 | 1.38mi |
| 6741 N 45th Ave Unit 29 Glendale, AZ | 2.0 | 1.0 | 900 | $1,195 | $1.33 | 1d | 1 | 1.40mi |
| 5012 W McLellan Rd Glendale, AZ | 3.0 | 2.0 | 1058 | $1,595 | $1.51 | 17d | 1 | 1.42mi |
| 4326 N 35th Ave Phoenix, AZ | 2.0 | 1.0–2.0 | 520 | $1,299 | $2.50 | 1d | 1 | 1.44mi |
| 6814 N 44th Ave #2 Glendale, AZ | 2.0 | 1.5 | 980 | $1,436 | $1.47 | 2d | 1 | 1.44mi |
| 4141 W Glendale Ave Phoenix, AZ | 2.0 | 1.0–2.0 | 589 | $1,626 | $2.76 | 1d | 20 | 1.46mi |
| 6850 N 44th Ave #4 Glendale, AZ | 2.0 | 1.5 | 980 | $1,436 | $1.47 | 2d | 1 | 1.47mi |
| 4336 N 35th Ave Unit 238 Phoenix, AZ | 2.0 | 2.0 | 822 | $1,099 | $1.34 | 12d | 1 | 1.47mi |
| 6821 N 45th Ave Glendale, AZ | 2.0 | 1.0 | 840 | $1,250 | $1.49 | 1d | 2 | 1.48mi |
Listing history 2 events
-
2026-05-01status Pending
-
2026-04-03$65,000 Active
ⓘ Source: listings_history table (triggers on properties + properties_extension) + one-shot
backfill from property_details.listing_events for pre-trigger history.
Climate risk First Street
- Flood 1/10 Low FEMA zone X (shaded) · 0% chance over 30 yrs
- Wildfire 1/10 Low
- Heat 9/10 Extreme 7 d/yr ≥112°F today · 17 d/yr by 30 yrs out
- Wind 1/10 Low
- Air quality 2/10 Low 0 unhealthy d/yr today · 1 by 30 yrs out
Nearby sold comps map
Loading sold comps map…
Walkable amenities ~0.75 mi
Loading nearby amenities…
Taxation est. · year 1
- Rental income
- $17,569
- − Mortgage interest
- −$3,641
- − Property taxes
- −$975
- − Insurance
- −$325
- − Repairs & maintenance
- −$1,405
- − Management
- −$1,405
- − Depreciation
- −$1,891
- Taxable income
- $7,926
- Est. tax owed @ 24.0%
- −$1,902
- After-tax cash flow
- $6,587/yr
For passive investors: Depreciation is non-cash, so a rental often shows a tax loss while cash-flowing — sheltering income. Rental losses are passive: they offset passive income freely, and up to $25,000/yr can offset ordinary (W-2) income if you actively participate and your MAGI is under $100k (phasing out to $0 by $150k); unused losses carry forward. On sale, claimed depreciation is recaptured at up to 25%, and gains may owe capital-gains tax (a 1031 exchange can defer both). Figures are a year-1 estimate at your 24.0% rate — not tax advice; consult a CPA.
Condition & rehab AI · 12 photos
This manufactured home is in fair condition with cosmetic updates needed. It's move-in ready with a private fenced yard and newer roof, but could benefit from fresh paint, new flooring, and updated fixtures to boost its value.
Repairs flagged
- Minor kitchen cabinets — slight wear
- Minor bathroom fixtures — slight wear
Value-add opportunities
- Both paint interior walls — fresh paint enhances curb appeal and interior aesthetics
- Both replace kitchen flooring — new flooring improves functionality and aesthetics
- Both update bathroom fixtures — new fixtures enhance functionality and aesthetics
Renovation cost estimate screening
| Repair item | Severity | Est. cost |
|---|---|---|
| kitchen cabinets · slight wear | Minor | $500–3,000 |
| bathroom fixtures · slight wear | Minor | $500–3,000 |
| Total estimated repair cost · 2 items | $1,000–6,000 |
Value-add ROI direction
- Both paint interior walls — fresh paint enhances curb appeal and interior aesthetics ↑
- Both replace kitchen flooring — new flooring improves functionality and aesthetics ↑
- Both update bathroom fixtures — new fixtures enhance functionality and aesthetics ↑
ⓘ Cost ranges are severity-bucket heuristics (US national rule-of-thumb). Get contractor quotes + a written scope before underwriting a rehab budget.
Schools (NCES district)
- District
- Phoenix Union High School District (4286)
- NCES district ID
- 0406330
- Math proficiency
- 10% ▼ -27.00%
- Reading proficiency
- 15% ▼ -18.00%
- Median HH income
- $39,055
- Composite
- 10.63/100
- National rank
- #9773
- State rank
- #224 of 249 in AZ
Livability — Glendale
- Score
- 76/100
- State rank
- #12
- US rank
- #3235
Category grades
Schools grade is shown separately in the Schools card above.
Census & demographics
- Census place
- Glendale, AZ
- County
- Maricopa County · 4,537,380 people
- City population
- 294,586
- Metro
- Phoenix-Mesa-Chandler, AZ
- Population (ZIP)
- 68,178
- Household income
- $53,827
- Rent vs Own
- Severe rent burden
- 3741.0
Population outlook (Maricopa County) Hauer SSP2
- Today (2025)
- 4,979,203 people
- By 2030
- 5,378,229 · +8.0%
- By 2040
- 6,156,598 · +23.6%
- By 2050
- 6,872,376 · +38.0%
- By 2075
- 8,401,270 · +68.7%
- By 2100
- 9,247,439 · +85.7%
Race, ethnicity, and origin ACS 2023
- Neighborhood character
- Majority Hispanic (63%)
- Race & ethnicity
- Hispanic / Latino 63% Two or more races 37% White 22% Black 8% Asian 2% Native American 2%
- Hispanic origin (detail)
- Mexican 57% Cuban 1%
- Common ancestry
- Slovak 1% Italian 1%
- Foreign-born
- 26% · Canada, Vietnam, Philippines
- Languages at home
- 46% English-only · Spanish 48% Arabic 1% Other Indo-European 1%
Political lean MEDSL · Maricopa
- 2024 margin
- Toss-up / Even · D 47.7% · R 51.2% · Other 1.1%
- 2008→2024 swing
- +7.1pp toward D · 2008: -10.6pp · 2024: -3.5pp
- All cycles
- 2024: R+3.5 2020: D+2.2 2016: R+3.5 2012: R+12.0 2008: R+10.6
Not yet ingested
- Civics
- —
Market trends
- HPI YoY
- ▼ -50.49%
- Current HPI
- 427.3069
- Rent YoY
- ▼ -2.98%
- Metro
- Phoenix-Mesa-Chandler, AZ
- State GDP YoY
- ▲ 4.54%
- F500 in state
- 20
Industry mix (Fortune 500 HQ in AZ)
| Industry | F500 HQs | Revenue |
|---|---|---|
| Technology | 2 | $13B |
|
||
| Mining / Metals | 1 | $23B |
|
||
| Environmental Services | 1 | $16B |
|
||
| Metals / Steel | 1 | $14B |
|
||
| Technology Distribution | 1 | $9B |
|
||
| Homebuilding | 1 | $8B |
|
||
Price history
2 events — show timeline
- 2026-05-01 Pending — ARMLS
- 2026-04-03 Listed $65,000 ARMLS
Cash-flow waterfall
monthlySold comps — $/sqft
last 12 mo · ≤1 miLoading sold comps…