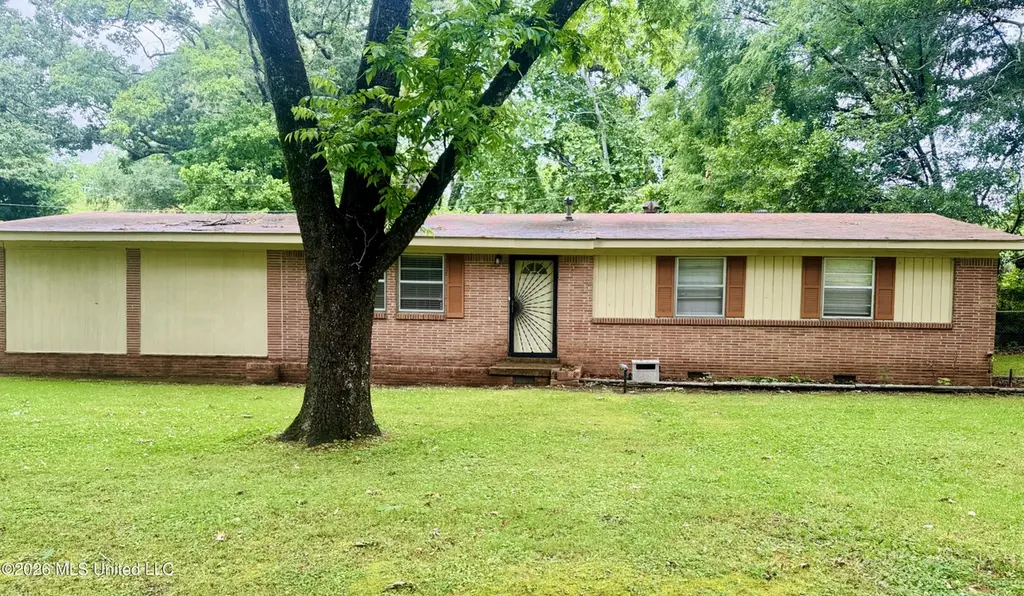
185 Chatham Dr · Holly Springs, MS
Flood risk 6/10 · Moderate
- FEMA flood zone
- X (unshaded)
- Chance of flooding over 30 yrs
- 0.75%
- Est. flood insurance / yr
- $507 – $1,088
Fire risk 4/10 · Minor
- Est. fire insurance / yr
- $1,241 – $2,305
Heat risk 6/10 · Moderate
- Hot days now (above 108°F)
- 7 days/yr
- Hot days in 30 yrs
- 21 days/yr
Wind risk 4/10 · Minor
- Chance of severe wind over 30 yrs
- 21.0%
Air-quality risk 1/10 · Minimal
- Unhealthy air days now
- 0 days/yr
- Unhealthy air days in 30 yrs
- 0 days/yr
Risk factors via First Street. Map © Google.
Why this score? — see what drove the B grade
The composite is a weighted blend of 9 inputs, each scored 0–100. Each bar is that input's sub-score; the figure is the points it added to the 100-point composite (weight × sub-score).
- Cash flow +26.2/30.0
- ARV discount +15.0/15.0
- DSCR +8.9/10.0
- 1% rule +6.6/10.0
- Appreciation +5.0/10.0
- Livability +3.1/5.0
- Rent growth +2.5/5.0
- Condition / age +2.5/5.0
- Schools +1.1/10.0
$137,900
🖨 Deal sheet 📄 Offer letter ✓ Due diligence
Listing remarks
This home is a must see! Pictures does this home no justice. If you are looking for space at the right price you have found it! This home has a large eat in kitchen, a den with a fireplace and two full bath, original hardwood floor and a garage. The master bedroom has a full bath and 3 closet for plenty of storage. This home has been well kept and in great condition. This neighborhood is quiet and is just waiting for you.
Key facts
- Large eat in kitchen
- Quiet neighborhood
- Den with fireplace
Tags
Property features AI
Exterior
- Parking: 1-car garage; Driveway; Garage door opener; Garage faces side; Concrete parking surfaces
- Utilities: Public water; Public sewer; Electricity connected; Cable available
- Home design: Single family residence; House; One level; Move-in ready
- Construction: Brick and siding exterior; Architectural shingle roof; Slab foundation; Estimated living area 1,658
- Exterior features: Patio; Corner lot
Interior
- Kitchen: Large eat-in kitchen; Open to living room with breakfast bar; Free-standing electric range; Kitchen island
- Bedrooms: Primary bedroom (main level); Additional bedrooms (main level)
- Flooring: Ceramic tile; Hardwood
- Bathrooms: 2 full bathrooms
- Heating & cooling: Central heating; Central air conditioning
- Interior features: Built-in features; Ceiling fans; Eat-in kitchen; Kitchen island; Open floorplan; Storm doors; Hearth masonry wood-burning fireplace
- Laundry & utility: Washer/dryer hookups likely available (utilities connected)
Neighborhood map
What this means for you Summary
Snapshot
- This is a 3-bed/1.0-bath single-family listed at $138k.
Deal economics
- At list price, monthly cash flow is $353 ($4k/yr) — positive.
- The deal already cash-flows at list — no discount required.
- Meets the 1% rule at list price ($2k rent vs $138k).
- Cap rate 9.4% vs local median 5.4% in Holly Springs — top-decile yield for the area; either an underpriced asset or a hidden risk that comps aren't pricing in. Stress-test before assuming the spread holds.
Location & tenants
- Location reads 62/100 on livability (#178 in MS) — a middle-class / working-renter tenant base. Strengths: cost of living A+, housing A+, crime B; Watch: amenities F, commute F, employment F.
- Holly Springs School District (town): math 12% / reading 15% proficiency, ranked #111 of 130 in MS (top 85%) — low school quality limits family demand, transient renter base, plan for 1-2y turnover; 92% free/reduced lunch — lower-income household profile, screen leases tightly.
- Zoned schools: Holly Springs Primary School (math 12% / reading 12%, grade F, #308 of 375 statewide, top 83%, 358 students, 100% FRL); Holly Springs Junior High School (math 17% / reading 17%, grade F, #125 of 179 statewide, top 70%, 138 students, 100% FRL); Holly Springs High School (math 12% / reading 12%, grade F, #164 of 197 statewide, top 84%, 301 students, 100% FRL).
- Market conditions: 146 active listings in the ZIP; 1 comparable units currently listed for rent nearby; 310 units permitted in Marshall County in 2024 (0 in 5+ unit buildings).
Forward outlook
- In year one you build about $939 of equity ($953 loan paydown + $-14 appreciation (-0.0% local appreciation)).
- Marshall County population projected at -24% by 2050 — secular population decline; favor cash flow + early exit over multi-decade hold.
- At projected returns (-0.0% appreciation + 3.0% rent growth), your $39k cash investment doubles in ~7 years — after that, you're playing with house money.
Negotiation context
- Only 7 days on market — expect competitive offers; lowballing is unlikely to land.
- 4 sale attempts with the ask held roughly flat each time — persistent listings suggest the price (not the market) is what's stuck; bring a comps-based counter.
Risks & watch-outs
- Climate carrying-cost: major flood risk; extreme-heat days projected 7→21/yr by 2055 (HVAC capex compounding) — expect insurance premiums to compound above CPI over the hold.
Questions for the listing agent
- Built in 1964 — when were the roof, HVAC, electrical panel, plumbing, and water heater last replaced?
- Is there a deadline driving the sale (1031 exchange, divorce, estate, relocation)? That informs how much negotiation room exists.
- Schools are F-rated, which usually means shorter tenancies and higher turnover. Who's the typical renter profile here, and what's been the actual vacancy rate?
- What's the average days-on-market for RENTAL listings here right now (not sales)? A rising rental-DOM trend means longer vacancies and softer asking-rent achievability than the comps imply.
- What's the recent tenant-quality profile in this submarket — average credit score on applications, eviction rate, late-payment / NSF rate, and stable-employment percentage? A property-management company in the area should have these aggregated.
- How much new for-sale + rental construction is in the pipeline within 1–3 miles? Heavy new supply typically softens prices + rents 12–24 months out; constrained supply supports both.
Investment metrics
- 1% rule
- 1.16% ✓
- Cap rate
- 9.37%
- Cash-on-cash
- 10.98%
- DSCR
- 1.49
- GRM
- 7.2
CMA / ARV
- ARV (on-the-fly)
- $218,856
- Comps found
- 4
Show comp detail 4 sales within ~0.75 mi
| Address | Dist | Beds/Ba | Sqft | Sold | Price | $/sf | Match |
|---|---|---|---|---|---|---|---|
| 260 Roberts Ave | 0.43mi | 3/2.0 | 1,656 (-0%) | 22mo | $199,500 | $120 | 58 |
| 659 Coleman Ave | 0.57mi | 3/2.0 | 1,722 (+4%) | 11mo | $189,900 | $110 | 54 |
| 27 Jepson St | 0.56mi | 3/2.5 | 1,414 (-15%) | 3mo | $273,990 | $194 | 41 |
| 605 Salem Ave | 0.57mi | 3/1.0 | 1,437 (-13%) | 13mo | $189,000 | $132 | 40 |
Match score weights: distance 35% · size 25% · config 20% · recency 20%. Top-matched comps best support the ARV.
Projected returns pro-forma
-0.01% appreciation · 3.0% rent growth · sell at horizon
- IRR
- 10.0%
- Equity multiple
- 1.48×
- Total profit
- $18,399
- Equity at exit
- $39,973
- IRR
- 14.9%
- Equity multiple
- 2.63×
- Total profit
- $63,003
- Equity at exit
- $47,994
Cash invested: $38,612 (down + closing). Projections, not guarantees.
Landlord ↔ Tenant lean methodology
- Overall (STATE)
- 90 Strongly Landlord-Friendly
- State Mississippi
- 90 Strongly Landlord-Friendly · R+11
- County
- — inherits STATE
- City
- — inherits STATE
ZIP-level market 38635
- Home prices YoY
- -0.0%
- Active inventory
- 146
- Price-to-rent
- 7.2×
Monthly cashflow live
- Estimated rent
- $1,600 medium interval (Pro) →
- Mortgage (P&I)
- −$723
- Tax from tax record
- −$130 /mo · $1,561/yr
- Insurance
- −$57
- HOA
- −$0
- Vacancy / Maint / Mgmt
- −$336
- Net cashflow
- $353
Break-even live
UW: 25.0% down · 7.5% · 30yr · 1.5% tax · 5.0% vac · 8.0% maint · 8.0% mgmt
Financing live
Cash to close
- Down payment
- $34,475
- Closing costs
- $4,137
- Reserves months
- —
- Total cash needed
- —
Loan-product check · same deal, 3 products live
Conventional
25% down · 7.5% · 30yr
- Down + closing
- —
- Monthly P&I
- —
- Monthly cashflow
- —
- DSCR
- —
- Eligible?
- —
Personal DTI + credit; lowest rate.
DSCR
20% down · 8.5% · 30yr
- Down + closing
- —
- Monthly P&I
- —
- Monthly cashflow
- —
- DSCR
- —
- Eligible?
- —
No personal income docs; deal must DSCR.
Hard money
10% down · 12.0% · 12mo
- Down + closing
- —
- Monthly P&I
- —
- Monthly cashflow
- —
- DSCR
- —
- Eligible?
- —
Short-term bridge; refi at stabilization.
Rent comps 1 comps
| Address | Beds | Baths | Sqft | Rent | $/sqft | DOM | Units | Dist |
|---|---|---|---|---|---|---|---|---|
| 275 W Chulahoma Ave Holly Springs, MS | 3.0 | 3.0 | 2243 | $1,600 | $0.71 | 21d | 1 | 0.86mi |
Listing history 9 events
-
2026-05-20$137,900 Active
-
2026-03-18status Active
-
2026-03-18historical
-
2026-03-12status Active
-
2026-02-26historical
-
2026-02-26historical
-
2026-01-20price $145,000
-
2025-08-28price $170,000
-
2025-08-26$165,000 Active
ⓘ Source: listings_history table (triggers on properties + properties_extension) + one-shot
backfill from property_details.listing_events for pre-trigger history.
Tax reassessment forecast MS · Resets to sale price
- Current annual tax
- $1,561 · $130/mo
- Projected year-2 tax
- $1,561 · $130/mo
- Expected delta
- $0/yr ($0/mo · 0.0%)
ⓘ Screening estimate from a state-policy table — verify with the county assessor before closing.
Climate risk First Street
- Flood 6/10 Major FEMA zone X (unshaded) · 75% chance over 30 yrs
- Wildfire 4/10 Moderate
- Heat 6/10 Major 7 d/yr ≥108°F today · 21 d/yr by 30 yrs out
- Wind 4/10 Moderate 21% chance of damaging wind over 30 yrs
- Air quality 1/10 Low 0 unhealthy d/yr today · 0 by 30 yrs out
Nearby sold comps map
Loading sold comps map…
Walkable amenities ~0.75 mi
Loading nearby amenities…
Taxation est. · year 1
- Rental income
- $19,200
- − Mortgage interest
- −$7,725
- − Property taxes
- −$1,561
- − Insurance
- −$690
- − Repairs & maintenance
- −$1,536
- − Management
- −$1,536
- − Depreciation
- −$4,012
- Taxable income
- $2,141
- Est. tax owed @ 24.0%
- −$514
- After-tax cash flow
- $3,725/yr
For passive investors: Depreciation is non-cash, so a rental often shows a tax loss while cash-flowing — sheltering income. Rental losses are passive: they offset passive income freely, and up to $25,000/yr can offset ordinary (W-2) income if you actively participate and your MAGI is under $100k (phasing out to $0 by $150k); unused losses carry forward. On sale, claimed depreciation is recaptured at up to 25%, and gains may owe capital-gains tax (a 1031 exchange can defer both). Figures are a year-1 estimate at your 24.0% rate — not tax advice; consult a CPA.
Schools (NCES district)
- District
- Holly Springs School District
- NCES district ID
- 2801950
- Math proficiency
- 12% ▼ -12.00%
- Reading proficiency
- 15% ▼ -7.00%
- Median HH income
- $33,106
- Composite
- 10.9/100
- National rank
- #9752
- State rank
- #111 of 130 in MS
Livability — Holly Springs
- Score
- 62/100
- State rank
- #178
- US rank
- #16836
Category grades
Schools grade is shown separately in the Schools card above.
Census & demographics
- Census place
- Holly Springs, MS
- Population (ZIP)
- 15,312
Population outlook (Marshall County) Hauer SSP2
- Today (2025)
- 33,542 people
- By 2030
- 31,983 · -4.6%
- By 2040
- 28,556 · -14.9%
- By 2050
- 25,352 · -24.4%
- By 2075
- 20,032 · -40.3%
- By 2100
- 16,738 · -50.1%
Race, ethnicity, and origin ACS 2023
- Neighborhood character
- Majority Black (64%)
- Race & ethnicity
- Black 64% White 29% Two or more races 5%
- Common ancestry
- Serbian 1% English 1%
- Foreign-born
- 3%
- Languages at home
- 97% English-only · Spanish 1%
Political lean MEDSL · Marshall
- 2024 margin
- Lean R (+7.3) · D 46.0% · R 53.2%
- 2008→2024 swing
- -25.5pp toward R · 2008: 18.2pp · 2024: -7.3pp
- All cycles
- 2024: R+7.3 2020: D+3.1 2016: D+9.7 2012: D+19.4 2008: D+18.2
Not yet ingested
- Civics
- —
Market trends
- HPI YoY
- ▬ -0.01%
- Current HPI
- 245.68
- Rent YoY
- —
- Metro
- —
- State GDP YoY
- —
- F500 in state
- 0
Price history
-16.4% since first listed9 events — show timeline
- 2026-05-20 Listed $137,900 MLSU
- 2026-03-18 Relisted — MLSU
- 2026-03-18 Listing Removed — MLSU
- 2026-03-12 Relisted — MLSU
- 2026-02-26 Listing Removed — MLSU
- 2026-02-26 Listing Removed — MLSU
- 2026-01-20 Price Changed $145,000 MLSU
- 2025-08-28 Price Changed $170,000 MLSU
- 2025-08-26 Listed $165,000 MLSU
Property tax history
+2.9%/yrLatest (2025): $1,561 · +17.2% YoY. Source: county tax records.
Cash-flow waterfall
monthlySold comps — $/sqft
last 12 mo · ≤1 miLoading sold comps…