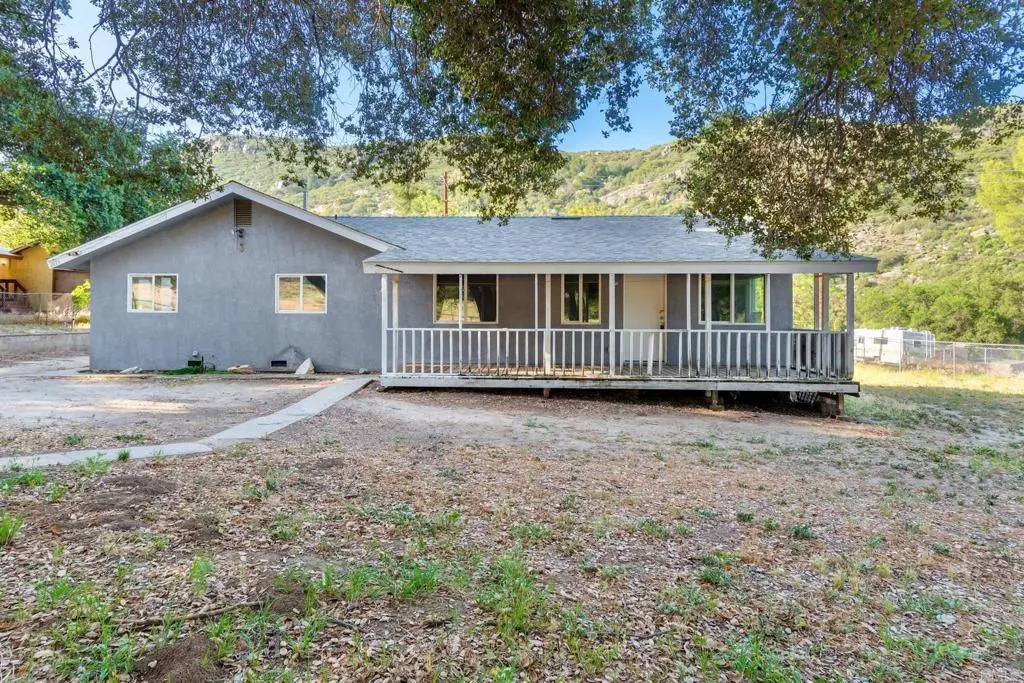
2016 Lake Morena Dr · Campo, CA
Flood risk 1/10 · Minimal
- FEMA flood zone
- D
- Chance of flooding over 30 yrs
- 0.0%
- Est. flood insurance / yr
- $544 – $1,084
Fire risk 10/10 · Severe
- Est. fire insurance / yr
- $659 – $1,223
Heat risk 5/10 · Moderate
- Hot days now (above 97°F)
- 8 days/yr
- Hot days in 30 yrs
- 24 days/yr
Wind risk 1/10 · Minimal
- Chance of severe wind over 30 yrs
- —
Air-quality risk 4/10 · Minor
- Unhealthy air days now
- 6 days/yr
- Unhealthy air days in 30 yrs
- 8 days/yr
Risk factors via First Street. Map © Google.
Why this score? — see what drove the D grade
The composite is a weighted blend of 9 inputs, each scored 0–100. Each bar is that input's sub-score; the figure is the points it added to the 100-point composite (weight × sub-score).
- ARV discount +13.0/15.0
- Cash flow +8.8/30.0
- Appreciation +4.9/10.0
- Rent growth +2.5/5.0
- Livability +2.5/5.0
- Condition / age +2.5/5.0
- DSCR +2.4/10.0
- 1% rule +2.0/10.0
- Schools +2.0/10.0
$422,400
🖨 Deal sheet 📄 Offer letter ✓ Due diligence
Listing remarks MLS
It doesn't get more private than this! Enjoy Your Campo Get away into the Country with this Opportunity! Home is Located on a Quiet Street. Enjoy The Beautiful Views of the Mountains and home is located Close to Lake Morena. This Home will be Sold AS IS. That Gives you the Perfect Chance to make it YOURS.
Key facts
- 1.14 acre lot
- 2 garage spots
- Built 1980
Property features AI
Finance
- Other: Lot described as over 40,000 sqft (source: Assessor); Access via about a one-mile dirt road with limited cell service; use Waze for directions and call before showing
Exterior
- Parking: 2 garage spaces; 2 total parking spaces
- Utilities: Propane; Well water
- Home design: Single-family residence (R-1 zoning); Single-story; Entry at front
- Construction: No shared/common walls; Year built source: Assessor
- Exterior features: Back yard; Yard; No pool; Property has a view; Rural setting
Interior
- Kitchen: Kitchen (appliances not specified)
- Bedrooms: Primary bedroom on main level
- Bathrooms: 2 full bathrooms
- Interior features: One-level home; Front entry; Walk-in closet; Primary bedroom; All bedrooms on ground floor; Family room; Primary bathroom
- Laundry & utility: Laundry in an individual room
Neighborhood map
What this means for you Summary
Snapshot
- This is a 3-bed/2.0-bath single-family listed at $422k.
Deal economics
- At list price, monthly cash flow is $-349 ($-4k/yr) — negative.
- To cash-flow at today's rent, offer at most $361k (14.6% below list).
- To meet the 1% rule (rent ≥ 1% of price), the offer needs to be $294k (30.5% below list).
- Recommended offer: $294k (30.5% below list) — sets the bar for 1% rule.
Location & tenants
- Location reads 49/100 on livability (#1,185 in CA) — a working-class tenant base; expect higher turnover. Strengths: housing A-; Watch: schools F, amenities F, commute D-.
- Mountain Empire Unified (rural): math 15% / reading 29% proficiency, ranked #438 of 517 in CA (top 85%) — low school quality limits family demand, transient renter base, plan for 1-2y turnover.
- Market conditions: 33 active listings in the ZIP; 11,759 units permitted in San Diego County in 2024 (7,244 in 5+ unit buildings).
Forward outlook
- In year one you build about $2k of equity ($3k loan paydown + $-834 appreciation (-0.2% local appreciation)).
- San Diego County population projected at +20% by 2050 — long-run rental-demand tailwind backs the buy-and-hold thesis.
- By year 9, paydown + projected appreciation supports a ~$31k cash-out refi (75% LTV) — recoverable capital for the next deal without selling this one.
Negotiation context
- It's been on market 51 days — a 3% lower offer ($410k) is reasonable based on typical stale-listing flexibility.
- 5 sale attempts since 30y ago; this cycle's ask has dropped $58k (12%) from the opening price — seller is motivated, your offer sets the floor, not the list.
- Current owner paid $220k; list at $422k implies a 92% gain — meaningful room to come down on a strong offer.
Risks & watch-outs
- Climate carrying-cost: severe wildfire risk; extreme-heat days projected 8→24/yr by 2055 (HVAC capex compounding) — expect insurance premiums to compound above CPI over the hold.
Questions for the listing agent
- What do current leases actually rent for vs. the listed asking? Can we see a recent rent roll and the last 12 months of T-12 income?
- It's been on market 51 days. Have you received any prior offers? Is the seller open to a 30% concession, seller financing, or rate buy-down credit?
- Is there a deadline driving the sale (1031 exchange, divorce, estate, relocation)? That informs how much negotiation room exists.
- Schools are F-rated, which usually means shorter tenancies and higher turnover. Who's the typical renter profile here, and what's been the actual vacancy rate?
- The area grade is low — what's the realistic commute time and amenity access for the typical tenant pool here? Any planned neighborhood developments (good or bad) we should know about?
- What's the average days-on-market for RENTAL listings here right now (not sales)? A rising rental-DOM trend means longer vacancies and softer asking-rent achievability than the comps imply.
- What's the recent tenant-quality profile in this submarket — average credit score on applications, eviction rate, late-payment / NSF rate, and stable-employment percentage? A property-management company in the area should have these aggregated.
- How much new for-sale + rental construction is in the pipeline within 1–3 miles? Heavy new supply typically softens prices + rents 12–24 months out; constrained supply supports both.
Investment metrics
- 1% rule
- 0.70% ✗
- Cap rate
- 5.30%
- Cash-on-cash
- -3.54%
- DSCR
- 0.84
- GRM
- 12.0
CMA / ARV
- ARV (median comp)
- $481,436
- List price
- $422,400
- Delta
- -12.26%
- Verdict
- UNDERPRICED
- Comps
- 18 within 2.0 mi
Projected returns pro-forma
-0.2% appreciation · 3.0% rent growth · sell at horizon
- IRR
- -7.1%
- Equity multiple
- 0.67×
- Total profit
- $-38,568
- Equity at exit
- $118,499
- IRR
- -0.9%
- Equity multiple
- 0.90×
- Total profit
- $-11,566
- Equity at exit
- $139,169
Cash invested: $118,272 (down + closing). Projections, not guarantees.
Landlord ↔ Tenant lean methodology
- Overall (STATE)
- 18 Strongly Tenant-Friendly
- State California
- 18 Strongly Tenant-Friendly · D+13
- County
- — inherits STATE
- City
- — inherits STATE
ZIP-level market 91906
- Home prices YoY
- -0.1%
- Active inventory
- 33
- Price-to-rent
- 12.0×
Monthly cashflow live
- Estimated rent
- $2,938 medium interval (Pro) →
- Mortgage (P&I)
- −$2,215
- Tax from tax record
- −$278 /mo · $3,338/yr
- Insurance
- −$176
- HOA
- −$0
- Vacancy / Maint / Mgmt
- −$617
- Net cashflow
- $-349
Break-even live
UW: 25.0% down · 7.5% · 30yr · 1.5% tax · 5.0% vac · 8.0% maint · 8.0% mgmt
Financing live
Cash to close
- Down payment
- $105,600
- Closing costs
- $12,672
- Reserves months
- —
- Total cash needed
- —
Loan-product check · same deal, 3 products live
Conventional
25% down · 7.5% · 30yr
- Down + closing
- —
- Monthly P&I
- —
- Monthly cashflow
- —
- DSCR
- —
- Eligible?
- —
Personal DTI + credit; lowest rate.
DSCR
20% down · 8.5% · 30yr
- Down + closing
- —
- Monthly P&I
- —
- Monthly cashflow
- —
- DSCR
- —
- Eligible?
- —
No personal income docs; deal must DSCR.
Hard money
10% down · 12.0% · 12mo
- Down + closing
- —
- Monthly P&I
- —
- Monthly cashflow
- —
- DSCR
- —
- Eligible?
- —
Short-term bridge; refi at stabilization.
Listing history 24 events
-
2026-06-18days on market $422,400 Active 51 DOM
-
2026-06-17days on market $422,400 Active 50 DOM
-
2026-06-16days on market $422,400 Active 49 DOM
-
2026-06-15days on market $422,400 Active 48 DOM
-
2026-06-13days on market $422,400 Active 46 DOM
-
2026-06-13pricedays on market $422,400 Active 45 DOM
-
2026-06-09days on market $480,000 Active 42 DOM
-
2026-06-08days on market $480,000 Active 41 DOM
-
2026-06-07days on market $480,000 Active 40 DOM
-
2026-06-04days on market $480,000 Active 37 DOM
-
2026-06-03days on market $480,000 Active 36 DOM
-
2026-06-02days on market $480,000 Active 35 DOM
-
2026-06-01days on market $480,000 Active 34 DOM
-
2026-05-31days on market $480,000 Active 33 DOM
-
2026-04-28$480,000 Active 649-char remark
-
2023-10-24historical
-
2023-09-21$300,000 Active
-
2019-01-31soldstatus $220,000 Sold
Show marketing remark (306 chars)
It doesn't get more private than this! Enjoy Your Campo Get away into the Country with this Opportunity! Home is Located on a Quiet Street. Enjoy The Beautiful Views of the Mountains and home is located Close to Lake Morena. This Home will be Sold AS IS. That Gives you the Perfect Chance to make it YOURS.
-
2018-10-02status Pending
Show marketing remark (306 chars)
It doesn't get more private than this! Enjoy Your Campo Get away into the Country with this Opportunity! Home is Located on a Quiet Street. Enjoy The Beautiful Views of the Mountains and home is located Close to Lake Morena. This Home will be Sold AS IS. That Gives you the Perfect Chance to make it YOURS.
-
2018-09-07$199,000 Active
Show marketing remark (306 chars)
It doesn't get more private than this! Enjoy Your Campo Get away into the Country with this Opportunity! Home is Located on a Quiet Street. Enjoy The Beautiful Views of the Mountains and home is located Close to Lake Morena. This Home will be Sold AS IS. That Gives you the Perfect Chance to make it YOURS.
-
1998-07-24historical
-
1998-07-24historical
-
1996-07-30$130,000
-
1996-07-30$130,000
ⓘ Source: listings_history table (triggers on properties + properties_extension) + one-shot
backfill from property_details.listing_events for pre-trigger history.
Tax reassessment forecast CA · Resets to sale price
- Current annual tax
- $3,338 · $278/mo
- Projected year-2 tax
- $3,338 · $278/mo
- Expected delta
- $0/yr ($0/mo · 0.0%)
ⓘ Screening estimate from a state-policy table — verify with the county assessor before closing.
Climate risk First Street
- Flood 1/10 Low FEMA zone D · 0% chance over 30 yrs
- Wildfire 10/10 Extreme
- Heat 5/10 Major 8 d/yr ≥97°F today · 24 d/yr by 30 yrs out
- Wind 1/10 Low
- Air quality 4/10 Moderate 6 unhealthy d/yr today · 8 by 30 yrs out
Nearby sold comps map
Loading sold comps map…
Walkable amenities ~0.75 mi
Loading nearby amenities…
Taxation est. · year 1
- Rental income
- $35,252
- − Mortgage interest
- −$23,661
- − Property taxes
- −$3,338
- − Insurance
- −$2,112
- − Repairs & maintenance
- −$2,820
- − Management
- −$2,820
- − Depreciation
- −$12,288
- Taxable loss
- −$11,787
- Est. tax savings @ 24.0%
- +$2,829
- After-tax cash flow
- $-1,353/yr
For passive investors: Depreciation is non-cash, so a rental often shows a tax loss while cash-flowing — sheltering income. Rental losses are passive: they offset passive income freely, and up to $25,000/yr can offset ordinary (W-2) income if you actively participate and your MAGI is under $100k (phasing out to $0 by $150k); unused losses carry forward. On sale, claimed depreciation is recaptured at up to 25%, and gains may owe capital-gains tax (a 1031 exchange can defer both). Figures are a year-1 estimate at your 24.0% rate — not tax advice; consult a CPA.
Schools (NCES district)
- District
- Mountain Empire Unified
- NCES district ID
- 0626100
- Math proficiency
- 15% ▼ -9.00%
- Reading proficiency
- 29% ▼ -9.00%
- Median HH income
- $54,413
- Composite
- 19.94/100
- National rank
- #8675
- State rank
- #438 of 517 in CA
Livability — Campo
- Score
- 49/100
- State rank
- #1185
- US rank
- #25983
Category grades
Schools grade is shown separately in the Schools card above.
Census & demographics
- City population
- 3,375
- Population (ZIP)
- 3,375
Population outlook (San Diego County) Hauer SSP2
- Today (2025)
- 3,678,185 people
- By 2030
- 3,856,546 · +4.8%
- By 2040
- 4,171,407 · +13.4%
- By 2050
- 4,421,607 · +20.2%
- By 2075
- 4,831,599 · +31.4%
- By 2100
- 4,832,502 · +31.4%
Race, ethnicity, and origin ACS 2023
- Neighborhood character
- Diverse neighborhood (Simpson 0.56)
- Race & ethnicity
- White 59% Hispanic / Latino 30% Two or more races 12% Native American 7% Black 3%
- Hispanic origin (detail)
- Mexican 30%
- Common ancestry
- Serbian 2% Portuguese 1% Scotch-Irish 1%
- Foreign-born
- 4% · Canada
- Languages at home
- 84% English-only · Spanish 14%
Political lean MEDSL · San Diego
- 2024 margin
- D (+16.8) · D 56.9% · R 40.1% · Other 2.9%
- 2008→2024 swing
- +6.6pp toward D · 2008: 10.2pp · 2024: 16.8pp
- All cycles
- 2024: D+16.8 2020: D+22.8 2016: D+17.8 2012: D+5.1 2008: D+10.2
Not yet ingested
- Civics
- —
Market trends
- HPI YoY
- ▼ -0.20%
- Current HPI
- 303.9813
- Rent YoY
- —
- Metro
- —
- State GDP YoY
- ▲ 3.21%
- F500 in state
- 116
Industry mix (Fortune 500 HQ in CA)
| Industry | F500 HQs | Revenue |
|---|---|---|
| Technology | 27 | $1,492B |
|
||
| Financial Services | 3 | $174B |
|
||
| Retail | 3 | $44B |
|
||
| Insurance | 3 | $26B |
|
||
| Media / Entertainment | 2 | $115B |
|
||
| Pharmaceuticals / Biotech | 2 | $62B |
|
||
Price history
+224.9% since first listed11 events — show timeline
- 2026-06-12 Price Changed $422,400 CRMLS
- 2026-04-28 Listed $480,000 CRMLS
- 2023-10-24 Listing Removed — CRMLS
- 2023-09-21 Listed $300,000 CRMLS
- 2019-01-31 Sold (MLS) $220,000 SDMLS
- 2018-10-02 Pending — SDMLS
- 2018-09-07 Listed $199,000 SDMLS
- 1998-07-24 Listing Removed — CRMLS
- 1998-07-24 Listing Removed — SDMLS
- 1996-07-30 Listed $130,000 CRMLS
- 1996-07-30 Listed $130,000 SDMLS
Property tax history
+11.1%/yrLatest (2025): $3,338 · +2.1% YoY. Source: county tax records.
Cash-flow waterfall
monthlySold comps — $/sqft
last 12 mo · ≤1 miLoading sold comps…