 11-Plex
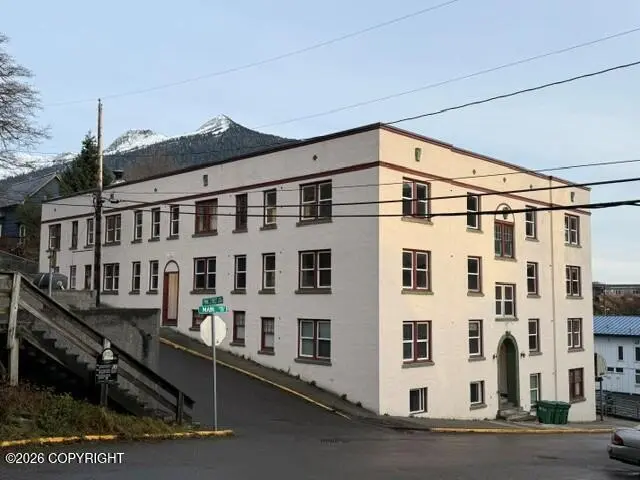
436 Main St · Ketchikan, AK
Flood risk 1/10 · Minimal
- FEMA flood zone
- —
- Chance of flooding over 30 yrs
- 0.0%
- Est. flood insurance / yr
- —
Fire risk No data
- Est. fire insurance / yr
- —
Heat risk No data
- Hot days now (above threshold)
- —
- Hot days in 30 yrs
- —
Wind risk No data
- Chance of severe wind over 30 yrs
- —
Air-quality risk 1/10 · Minimal
- Unhealthy air days now
- —
- Unhealthy air days in 30 yrs
- —
Risk factors via First Street. Map © Google.
Why this score? — see what drove the B grade
The composite is a weighted blend of 9 inputs, each scored 0–100. Each bar is that input's sub-score; the figure is the points it added to the 100-point composite (weight × sub-score).
- Cash flow +30.0/30.0
- DSCR +10.0/10.0
- 1% rule +9.8/10.0
- ARV discount +7.5/15.0
- Schools +5.0/10.0
- Livability +3.8/5.0
- Condition / age +3.8/5.0
- Rent growth +2.5/5.0
- Appreciation +0.0/10.0
$1,685,000
🖨 Deal sheet 📄 Offer letter ✓ Due diligence
Multi-family units
County records classify this as Multi-Family (2-4 Unit). Listing-text estimate: 11 units. estimate disagrees with records
Listing remarks
Need Housing or an Investment Opportunity? The Revilla Apartments is an iconic downtown Ketchikan property offering both historic character and long-term potential. Built in 1927, this landmark concrete building occupies the prominent corner of Main and Pine Streets and remains one of downtown's most recognizable residential properties. The handsome stucco structure retains many of its original architectural details, including mahogany stair railings, hardwood floors, classic doors, and original trim, blending timeless character with important modern improvements. Recent upgrades include a state-of-the-art hydronic heating system with new boilers, fiber optic connectivity, enhanced security
Key facts
- Historic character
- Prominent corner
- Hardwood floors
Tags
Property features AI
Finance
- Other: Living area approximately 21,400; Lot about 0.15 acres (6,440 sq ft)
Exterior
- Parking: No attached garage; No garage spaces; No carport spaces; No open parking spaces
- Utilities: Public sewer
- Home design: Multi-family property; Built in 1927
- Construction: Concrete construction; Poured concrete foundation
- Exterior features: Rolled/hot mop roof; Paved road access
Interior
- Bedrooms: 32 total bedrooms
- Flooring: Carpet
- Bathrooms: 32 full bathrooms
- Interior features: Carpet flooring
Neighborhood map
What this means for you Summary
Snapshot
- This is a 11 × 3-bed/?-bath units multifamily listed at $1.69M. Condition is rated good.
Deal economics
- At list price, monthly cash flow is $8k ($97k/yr) — positive. Per door: $731/mo.
- The deal already cash-flows at list — no discount required.
- Meets the 1% rule at list price ($25k rent vs $1.69M).
- Recommended offer: $1.66M (1.5% below list) — sets the bar for market timing.
- Cap rate 12.0% vs local median 3.7% in Ketchikan — top-decile yield for the area; either an underpriced asset or a hidden risk that comps aren't pricing in. Stress-test before assuming the spread holds.
Location & tenants
- Location reads 76/100 on livability (#12 in AK, #3,743 nationally) — a middle-class / working-renter tenant base. Strengths: commute A+, housing A+, health & safety A+; Watch: crime D+, amenities F.
- Market conditions: 97 active listings in the ZIP; 73 units permitted in Ketchikan Gateway Borough in 2024 (14 in 5+ unit buildings).
Forward outlook
- Local home prices are declining (-3.0%/yr); year-one equity from $12k of loan paydown is wiped out by about $51k of value loss. Plan a longer hold.
- Ketchikan Gateway County population projected at +4% by 2050 — modest demand growth; plan on rents tracking national, not racing it.
- At projected returns (-3.0% appreciation + 3.0% rent growth), your $472k cash investment doubles in ~6 years — after that, you're playing with house money.
Negotiation context
- It's been on market 15 days — a 2% lower offer ($1.66M) is reasonable based on typical stale-listing flexibility.
- 5 sale attempts since 14y ago with the ask held roughly flat each time — persistent listings suggest the price (not the market) is what's stuck; bring a comps-based counter.
Risks & watch-outs
- Watch-outs: built in 1927 — expect roof / HVAC / electrical / plumbing capex.
Questions for the listing agent
- Can we see the unit-by-unit rent roll, current vacancy, and any below-market leases? What's the average tenancy length?
- What capital expenditures (roof, boiler, parking lot, exteriors) have been made in the last 5 years, and what's planned in the next 2?
- Built in 1927 — when were the roof, HVAC, electrical panel, plumbing, and water heater last replaced?
- Is there a deadline driving the sale (1031 exchange, divorce, estate, relocation)? That informs how much negotiation room exists.
- Crime grade is D in this area — have there been break-ins, vandalism, or insurance claims at this property in the last 3 years? What carrier currently insures it and at what premium?
- What's the average days-on-market for RENTAL listings here right now (not sales)? A rising rental-DOM trend means longer vacancies and softer asking-rent achievability than the comps imply.
- What's the recent tenant-quality profile in this submarket — average credit score on applications, eviction rate, late-payment / NSF rate, and stable-employment percentage? A property-management company in the area should have these aggregated.
- How much new apartment / multifamily construction is in the pipeline within 1–3 miles? Heavy new supply (>2% of stock underway) typically softens rents 12–24 months out; light construction supports rent growth.
Investment metrics
- 1% rule
- 1.48% ✓
- Cap rate
- 12.02%
- Cash-on-cash
- 20.45%
- DSCR
- 1.91
- GRM
- 5.6
CMA / ARV
No comps found within radius.
Projected returns pro-forma
-3.0% appreciation · 3.0% rent growth · sell at horizon
- IRR
- 12.8%
- Equity multiple
- 1.51×
- Total profit
- $239,542
- Equity at exit
- $251,239
- IRR
- 21.7%
- Equity multiple
- 2.84×
- Total profit
- $869,667
- Equity at exit
- $145,688
Cash invested: $471,800 (down + closing). Projections, not guarantees.
Landlord ↔ Tenant lean methodology
- Overall (STATE)
- 80 Strongly Landlord-Friendly
- State Alaska
- 80 Strongly Landlord-Friendly · R+8
- County
- — inherits STATE
- City
- — inherits STATE
ZIP-level market 99901
- Home prices YoY
- -33.4%
- Active inventory
- 97
- Price-to-rent
- 62.0×
Monthly cashflow live
- Estimated rent
- $24,920 medium interval (Pro) →
- Mortgage (P&I)
- −$8,836
- Tax est. 1.5%
- −$2,106 /mo · $25,275/yr
- Insurance
- −$702
- HOA
- −$0
- Vacancy / Maint / Mgmt
- −$5,233
- Net cashflow
- $8,042
Break-even live
11-unit breakdown (identical units grouped — click to expand)
| Units | Beds | Baths | Est. rent |
|---|---|---|---|
| 11× units | 3 | — | $24,915 |
| #1 | 3 | — | $2,265 |
| #2 | 3 | — | $2,265 |
| #3 | 3 | — | $2,265 |
| #4 | 3 | — | $2,265 |
| #5 | 3 | — | $2,265 |
| #6 | 3 | — | $2,265 |
| #7 | 3 | — | $2,265 |
| #8 | 3 | — | $2,265 |
| #9 | 3 | — | $2,265 |
| #10 | 3 | — | $2,265 |
| #11 | 3 | — | $2,265 |
| Total (11 units) | $24,920 | ||
UW: 25.0% down · 7.5% · 30yr · 1.5% tax · 5.0% vac · 8.0% maint · 8.0% mgmt
Financing live
Cash to close
- Down payment
- $421,250
- Closing costs
- $50,550
- Reserves months
- —
- Total cash needed
- —
Loan-product check · same deal, 3 products live
Conventional
25% down · 7.5% · 30yr
- Down + closing
- —
- Monthly P&I
- —
- Monthly cashflow
- —
- DSCR
- —
- Eligible?
- —
Personal DTI + credit; lowest rate.
DSCR
20% down · 8.5% · 30yr
- Down + closing
- —
- Monthly P&I
- —
- Monthly cashflow
- —
- DSCR
- —
- Eligible?
- —
No personal income docs; deal must DSCR.
Hard money
10% down · 12.0% · 12mo
- Down + closing
- —
- Monthly P&I
- —
- Monthly cashflow
- —
- DSCR
- —
- Eligible?
- —
Short-term bridge; refi at stabilization.
Listing history 14 events
-
2026-06-12statusdays on market $1,685,000 Pending 15 DOM
-
2026-06-09days on market $1,685,000 Active 13 DOM
-
2026-06-08days on market $1,685,000 Active 12 DOM
-
2026-06-07days on market $1,685,000 Active 11 DOM
-
2026-06-04days on market $1,685,000 Active 7 DOM
-
2026-06-02days on market $1,685,000 Active 6 DOM
-
2026-06-01days on market $1,685,000 Active 5 DOM
-
2026-05-31days on market $1,685,000 Active 4 DOM
-
2026-05-31days on market $1,685,000 Active 3 DOM
-
2026-05-27$1,685,000 Active
-
2022-07-11$1,599,000
-
2017-05-14$895,000
-
2015-09-28$895,000
-
2012-07-10$895,000
ⓘ Source: listings_history table (triggers on properties + properties_extension) + one-shot
backfill from property_details.listing_events for pre-trigger history.
Climate risk First Street
- Flood 1/10 Low 0% chance over 30 yrs
- Air quality 1/10 Low
Nearby sold comps map
Loading sold comps map…
Walkable amenities ~0.75 mi
Loading nearby amenities…
Taxation est. · year 1
- Rental income
- $299,040
- − Mortgage interest
- −$94,386
- − Property taxes
- −$25,275
- − Insurance
- −$8,425
- − Repairs & maintenance
- −$23,923
- − Management
- −$23,923
- − Depreciation
- −$49,018
- Taxable income
- $74,089
- Est. tax owed @ 24.0%
- −$17,781
- After-tax cash flow
- $78,724/yr
For passive investors: Depreciation is non-cash, so a rental often shows a tax loss while cash-flowing — sheltering income. Rental losses are passive: they offset passive income freely, and up to $25,000/yr can offset ordinary (W-2) income if you actively participate and your MAGI is under $100k (phasing out to $0 by $150k); unused losses carry forward. On sale, claimed depreciation is recaptured at up to 25%, and gains may owe capital-gains tax (a 1031 exchange can defer both). Figures are a year-1 estimate at your 24.0% rate — not tax advice; consult a CPA.
Condition & rehab AI · 3 photos
The Revilla Apartments is a well-maintained multi-family property with good condition and recent upgrades, offering both historic character and long-term potential.
Value-add opportunities
- Both Painting exterior and interior walls — Enhances curb appeal and interior aesthetics.
- Both Landscaping improvements — Enhances curb appeal and adds value to the property.
- Rental HVAC system maintenance — Ensures the heating system operates efficiently and safely, attracting tenants.
- Resale Kitchen appliances replacement — Modern appliances improve the home's appeal to potential buyers.
- Resale Bathroom updates — Fresh bathrooms can significantly boost the home's resale value.
Renovation cost estimate screening
Value-add ROI direction
- Both Painting exterior and interior walls — Enhances curb appeal and interior aesthetics. ↑
- Both Landscaping improvements — Enhances curb appeal and adds value to the property. ↑
- Rental HVAC system maintenance — Ensures the heating system operates efficiently and safely, attracting tenants. ↑
- Resale Kitchen appliances replacement — Modern appliances improve the home's appeal to potential buyers. ↑
- Resale Bathroom updates — Fresh bathrooms can significantly boost the home's resale value. ↑
ⓘ Cost ranges are severity-bucket heuristics (US national rule-of-thumb). Get contractor quotes + a written scope before underwriting a rehab budget.
Schools (NCES district)
No district data.
Livability — Ketchikan
- Score
- 76/100
- State rank
- #12
- US rank
- #3743
Category grades
Schools grade is shown separately in the Schools card above.
Census & demographics
- Census place
- Ketchikan, AK
- Population (ZIP)
- 13,875
Population outlook (Ketchikan Gateway County) Hauer SSP2
- Today (2025)
- 14,287 people
- By 2030
- 14,487 · +1.4%
- By 2040
- 14,750 · +3.2%
- By 2050
- 14,908 · +4.3%
- By 2075
- 15,319 · +7.2%
- By 2100
- 15,204 · +6.4%
Race, ethnicity, and origin ACS 2023
- Neighborhood character
- Diverse neighborhood (Simpson 0.61)
- Race & ethnicity
- White 61% Native American 13% Two or more races 13% Asian 9% Hispanic / Latino 5%
- Hispanic origin (detail)
- Mexican 3%
- Common ancestry
- Portuguese 5% Slovak 4% Italian 2%
- Foreign-born
- 9% · Canada
- Languages at home
- 89% English-only · Tagalog/Filipino 7% Spanish 2% Other Indo-European 1%
Political lean MEDSL · Ketchikan Gateway
- 2016 margin
- R (+15.2) · D 37.7% · R 52.9% · Other 9.4%
- All cycles
- 2016: R+15.2
Not yet ingested
- Civics
- —
Market trends
- HPI YoY
- ▼ -95.31%
- Current HPI
- 190.039
- Rent YoY
- —
- Metro
- —
- State GDP YoY
- —
- F500 in state
- 0
Price history
+88.3% since first listed5 events — show timeline
- 2026-05-27 Listed $1,685,000 AKMLS
- 2022-07-11 Listed $1,599,000 AKMLS
- 2017-05-14 Listed $895,000 AKMLS
- 2015-09-28 Listed $895,000 AKMLS
- 2012-07-10 Listed $895,000 AKMLS
Cash-flow waterfall
monthlySold comps — $/sqft
last 12 mo · ≤1 miLoading sold comps…