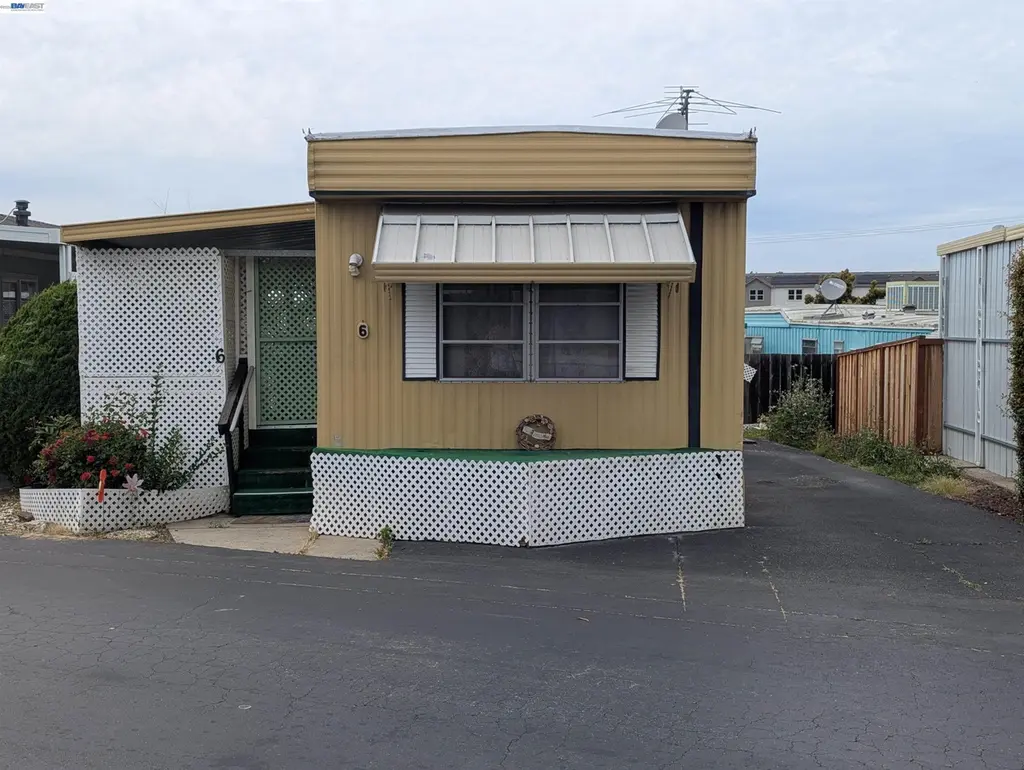
3913 Castro Valley Blvd #6 · Castro Valley, CA
Flood risk 1/10 · Minimal
- FEMA flood zone
- X (unshaded)
- Chance of flooding over 30 yrs
- 0.0%
- Est. flood insurance / yr
- $507 – $1,088
Fire risk 2/10 · Minimal
- Est. fire insurance / yr
- $659 – $1,223
Heat risk 4/10 · Minor
- Hot days now (above 88°F)
- 7 days/yr
- Hot days in 30 yrs
- 14 days/yr
Wind risk 1/10 · Minimal
- Chance of severe wind over 30 yrs
- —
Air-quality risk 7/10 · Major
- Unhealthy air days now
- 12 days/yr
- Unhealthy air days in 30 yrs
- 12 days/yr
Risk factors via First Street. Map © Google.
Why this score? — see what drove the B- grade
The composite is a weighted blend of 9 inputs, each scored 0–100. Each bar is that input's sub-score; the figure is the points it added to the 100-point composite (weight × sub-score).
- Cash flow +30.0/30.0
- 1% rule +10.0/10.0
- DSCR +10.0/10.0
- Schools +5.9/10.0
- Livability +3.7/5.0
- Rent growth +3.3/5.0
- Condition / age +2.5/5.0
- ARV discount +0.0/15.0
- Appreciation +0.0/10.0
$74,500
🖨 Deal sheet 📄 Offer letter ✓ Due diligence
Listing remarks MLS
THIS ONE BEDROOM SINGLE WIDE HOME HAS BEEN METICULOUSLY MAINTAINED HAS NEW EXTERIOR PAINT WITH TWO STORAGE SHEDS. AIR COOLED.
Key facts
- Listed 16 days
Neighborhood map
What this means for you Summary
Snapshot
- This is a 1-bed/1.0-bath manufactured listed at $74k.
Deal economics
- At list price, monthly cash flow is $1k ($14k/yr) — positive.
- The deal already cash-flows at list — no discount required.
- Meets the 1% rule at list price ($2k rent vs $74k).
- Recommended offer: $73k (1.5% below list) — sets the bar for market timing.
- Cap rate 25.3% vs local median 1.8% in Castro Valley — top-decile yield for the area; either an underpriced asset or a hidden risk that comps aren't pricing in. Stress-test before assuming the spread holds.
Location & tenants
- Location reads 74/100 on livability (#129 in CA, #4,461 nationally) — a middle-class / working-renter tenant base. Strengths: commute A+, employment A+, schools A; Watch: amenities F, cost of living F.
- Castro Valley Unified (suburban): math 60% / reading 69% proficiency, ranked #60 of 517 in CA (top 12%) — acceptable for families but not a draw, mixed tenant base, ~2y average lease; only 16% free/reduced lunch — higher-income household profile.
- Market conditions: Rents rising (+3.4%/yr); 108 active listings in the ZIP; 24 comparable units currently listed for rent nearby; rentals at typical pace (median 15d on market — plan ~3-4 weeks tenant-placement turnaround); high-income renter base; 1,742 units permitted in Alameda County in 2024 (856 in 5+ unit buildings).
Forward outlook
- Local home prices are declining (-3.0%/yr); year-one equity from $515 of loan paydown is wiped out by about $2k of value loss. Plan a longer hold.
- Alameda County population projected at +34% by 2050 — long-run rental-demand tailwind backs the buy-and-hold thesis.
- At projected returns (-3.0% appreciation + 3.4% rent growth), your $21k cash investment doubles in ~2 years — after that, you're playing with house money.
Negotiation context
- It's been on market 16 days — a 2% lower offer ($73k) is reasonable based on typical stale-listing flexibility.
- 2 sale attempts since 23y ago with the ask held roughly flat each time — persistent listings suggest the price (not the market) is what's stuck; bring a comps-based counter.
- Current owner paid $30k; list at $74k implies a 148% gain — meaningful room to come down on a strong offer.
Questions for the listing agent
- Is there a deadline driving the sale (1031 exchange, divorce, estate, relocation)? That informs how much negotiation room exists.
- Schools are A-rated — typically a magnet for longer-tenancy family renters. What's the average tenant stay here, and is there a school-zone premium baked into asking?
- What's the average days-on-market for RENTAL listings here right now (not sales)? A rising rental-DOM trend means longer vacancies and softer asking-rent achievability than the comps imply.
- What's the recent tenant-quality profile in this submarket — average credit score on applications, eviction rate, late-payment / NSF rate, and stable-employment percentage? A property-management company in the area should have these aggregated.
- How much new for-sale + rental construction is in the pipeline within 1–3 miles? Heavy new supply typically softens prices + rents 12–24 months out; constrained supply supports both.
Investment metrics
- 1% rule
- 2.88% ✓
- Cap rate
- 25.31%
- Cash-on-cash
- 67.93%
- DSCR
- 4.02
- GRM
- 2.9
CMA / ARV
- ARV (on-the-fly)
- $60,168
- Comps found
- 6
Show comp detail 6 sales within ~0.75 mi
| Address | Dist | Beds/Ba | Sqft | Sold | Price | $/sf | Match |
|---|---|---|---|---|---|---|---|
| 3913 Castro Valley Blvd #6 | 0.00mi | 1/1.0 | 552 (0%) | 1mo | $74,000 | $134 | 99 |
| 3913 Castro Valley Blvd #78 | 0.00mi | 2/1.0 (+1) | 552 (0%) | 15mo | $85,000 | $154 | 82 |
| 3913 Castro Valley Blvd #5 | 0.00mi | 1/1.0 | 540 (-2%) | 19mo | $59,000 | $109 | 80 |
| 3998 Castro Valley Blvd #19 | 0.17mi | 1/1.0 | 576 (+4%) | 10mo | $40,000 | $69 | 76 |
| 3998 Castro Valley Blvd Spc 6 | 0.17mi | 1/1.0 | 588 (+6%) | 15mo | $30,000 | $51 | 69 |
| 3998 Castro Valley Blvd #16 | 0.19mi | 1/1.0 | 600 (+9%) | 16mo | $18,754 | $31 | 64 |
Match score weights: distance 35% · size 25% · config 20% · recency 20%. Top-matched comps best support the ARV.
Projected returns pro-forma
-3.0% appreciation · 3.37% rent growth · sell at horizon
- IRR
- 67.7%
- Equity multiple
- 4.07×
- Total profit
- $63,976
- Equity at exit
- $11,108
- IRR
- 72.0%
- Equity multiple
- 8.48×
- Total profit
- $156,006
- Equity at exit
- $6,441
Cash invested: $20,860 (down + closing). Projections, not guarantees.
Landlord ↔ Tenant lean methodology
- Overall (STATE)
- 18 Strongly Tenant-Friendly
- State California
- 18 Strongly Tenant-Friendly · D+13
- County
- — inherits STATE
- City
- — inherits STATE
ZIP-level market 94546
- Rents YoY
- 3.4%
- Active inventory
- 108
- Price-to-rent
- 2.9×
Monthly cashflow live
- Estimated rent
- $2,147 high interval (Pro) →
- Mortgage (P&I)
- −$391
- Tax est. 1.5%
- −$93 /mo · $1,118/yr
- Insurance
- −$31
- HOA
- −$0
- Vacancy / Maint / Mgmt
- −$451
- Net cashflow
- $1,181
Break-even live
UW: 25.0% down · 7.5% · 30yr · 1.5% tax · 5.0% vac · 8.0% maint · 8.0% mgmt
Financing live
Cash to close
- Down payment
- $18,625
- Closing costs
- $2,235
- Reserves months
- —
- Total cash needed
- —
Loan-product check · same deal, 3 products live
Conventional
25% down · 7.5% · 30yr
- Down + closing
- —
- Monthly P&I
- —
- Monthly cashflow
- —
- DSCR
- —
- Eligible?
- —
Personal DTI + credit; lowest rate.
DSCR
20% down · 8.5% · 30yr
- Down + closing
- —
- Monthly P&I
- —
- Monthly cashflow
- —
- DSCR
- —
- Eligible?
- —
No personal income docs; deal must DSCR.
Hard money
10% down · 12.0% · 12mo
- Down + closing
- —
- Monthly P&I
- —
- Monthly cashflow
- —
- DSCR
- —
- Eligible?
- —
Short-term bridge; refi at stabilization.
Rent comps 24 comps
| Address | Beds | Baths | Sqft | Rent | $/sqft | DOM | Units | Dist |
|---|---|---|---|---|---|---|---|---|
| 3958 Castro Valley Blvd Castro Valley, CA | 2.0 | 1.0 | 750 | $2,150 | $2.87 | 43d | 1 | 0.10mi |
| 20673 Forest Ave Unit B Castro Valley, CA | 2.0 | 1.0 | 750 | $2,750 | $3.67 | 4d | 1 | 0.21mi |
| 20446 Forest Ave Apt 22 Castro Valley, CA | — | 1.0 | 400 | $1,625 | $4.06 | 24d | 1 | 0.28mi |
| 20446 Forest Ave Apt 2 Castro Valley, CA | — | 1.0 | 400 | $1,625 | $4.06 | 1d | 1 | 0.28mi |
| 20446 Forest Ave Apt 1 Castro Valley, CA | — | 1.0 | 400 | $1,625 | $4.06 | 18d | 1 | 0.28mi |
| 22160 Center St Castro Valley, CA | 1.0–2.0 | 1.0–2.0 | 863 | $2,307 | $2.67 | 4d | 6 | 0.39mi |
| 22302 Center St Castro Valley, CA | 1.0–2.0 | 1.0 | 809 | $2,213 | $2.74 | 1d | 3 | 0.49mi |
| 20928 Wilbeam Ave Unit 46 Castro Valley, CA | 1.0 | 1.0 | 675 | $1,895 | $2.81 | 43d | 1 | 0.50mi |
| 2481 Grove Way Castro Valley, CA | 1.0 | 1.0 | 707 | $2,095 | $2.96 | 3d | 1 | 0.64mi |
| 21006 Nunes Ave Unit A Castro Valley, CA | 2.0 | 1.0 | 750 | $2,600 | $3.47 | 15d | 1 | 0.81mi |
| 20511 Anita Ave Apt 32 Castro Valley, CA | 1.0 | 1.0 | 525 | $1,965 | $3.74 | 21d | 1 | 0.94mi |
| 22294 City Center Dr Hayward, CA | 2.0 | 1.0–2.0 | 1016 | $2,169 | $2.13 | 12d | 1 | 1.15mi |
| 1327 Russell Way Hayward, CA | 2.0 | 1.0 | 700 | $2,295 | $3.28 | 24d | 1 | 1.19mi |
| 20353 Park Way Castro Valley, CA | 1.0 | 1.0 | 561 | $2,145 | $3.82 | 5d | 3 | 1.22mi |
| 19139 Vaughn Ave Castro Valley, CA | 2.0 | 2.0 | 745 | $3,995 | $5.36 | 11d | 1 | 1.27mi |
| 22525 3rd St Hayward, CA | 1.0–2.0 | 1.0–2.0 | 779 | $2,110 | $2.71 | 1d | 8 | 1.27mi |
| 19972 Stanton Ave Castro Valley, CA | 1.0–2.0 | 1.0 | 710 | $1,895 | $2.67 | 5d | 2 | 1.35mi |
| 19770 Sprague Ct Castro Valley, CA | 1.0 | 1.0 | 700 | $2,700 | $3.86 | 43d | 1 | 1.37mi |
| 1201 B St Unit 18 Hayward, CA | 1.0 | 1.0 | 645 | $1,995 | $3.09 | 5d | 1 | 1.40mi |
| 1201 B St Apt 25 Hayward, CA | 1.0 | 1.0 | 645 | $1,998 | $3.10 | 43d | 1 | 1.40mi |
| 22335 Foothill Blvd Hayward, CA | 3.0 | 1.0–2.0 | 1160 | $3,132 | $2.70 | 1d | 42 | 1.40mi |
| 1321 Terrace Ave Hayward, CA | 1.0 | 1.0 | 750 | $2,050 | $2.73 | 43d | 1 | 1.40mi |
| 21701 Foothill Blvd Hayward, CA | 1.0–2.0 | 1.0–2.0 | 751 | $2,199 | $2.93 | 17d | 6 | 1.46mi |
| 1250 E St Hayward, CA | 1.0 | 1.0 | 400 | $1,795 | $4.49 | 43d | 1 | 1.47mi |
Listing history 4 events
-
2026-04-16status Pending
-
2026-03-31$74,500 Active
-
2003-06-23soldstatus $30,000 125-char remark
Show marketing remark (125 chars)
THIS ONE BEDROOM SINGLE WIDE HOME HAS BEEN METICULOUSLY MAINTAINED HAS NEW EXTERIOR PAINT WITH TWO STORAGE SHEDS. AIR COOLED.
-
2003-04-22$35,000 125-char remark
Show marketing remark (125 chars)
THIS ONE BEDROOM SINGLE WIDE HOME HAS BEEN METICULOUSLY MAINTAINED HAS NEW EXTERIOR PAINT WITH TWO STORAGE SHEDS. AIR COOLED.
ⓘ Source: listings_history table (triggers on properties + properties_extension) + one-shot
backfill from property_details.listing_events for pre-trigger history.
Climate risk First Street
- Flood 1/10 Low FEMA zone X (unshaded) · 0% chance over 30 yrs
- Wildfire 2/10 Low
- Heat 4/10 Moderate 7 d/yr ≥88°F today · 14 d/yr by 30 yrs out
- Wind 1/10 Low
- Air quality 7/10 Severe 12 unhealthy d/yr today · 12 by 30 yrs out
Nearby sold comps map
Loading sold comps map…
Walkable amenities ~0.75 mi
Loading nearby amenities…
Taxation est. · year 1
- Rental income
- $25,759
- − Mortgage interest
- −$4,173
- − Property taxes
- −$1,118
- − Insurance
- −$372
- − Repairs & maintenance
- −$2,061
- − Management
- −$2,061
- − Depreciation
- −$2,167
- Taxable income
- $13,807
- Est. tax owed @ 24.0%
- −$3,314
- After-tax cash flow
- $10,857/yr
For passive investors: Depreciation is non-cash, so a rental often shows a tax loss while cash-flowing — sheltering income. Rental losses are passive: they offset passive income freely, and up to $25,000/yr can offset ordinary (W-2) income if you actively participate and your MAGI is under $100k (phasing out to $0 by $150k); unused losses carry forward. On sale, claimed depreciation is recaptured at up to 25%, and gains may owe capital-gains tax (a 1031 exchange can defer both). Figures are a year-1 estimate at your 24.0% rate — not tax advice; consult a CPA.
Schools (NCES district)
- District
- Castro Valley Unified
- NCES district ID
- 0607800
- Math proficiency
- 60% ▼ -3.00%
- Reading proficiency
- 69% ▲ 1.00%
- Median HH income
- $94,532
- Composite
- 59.03/100
- National rank
- #959
- State rank
- #60 of 517 in CA
Livability — Castro Valley
- Score
- 74/100
- State rank
- #129
- US rank
- #4461
Category grades
Schools grade is shown separately in the Schools card above.
Census & demographics
- Census place
- Castro Valley, CA
- County
- Alameda County · 1,614,355 people
- City population
- 59,361
- Metro
- San Francisco-Oakland-Berkeley, CA
- Population (ZIP)
- 44,855
- Household income
- $128,385
- Rent vs Own
- Severe rent burden
- 1354.0
Population outlook (Alameda County) Hauer SSP2
- Today (2025)
- 1,928,884 people
- By 2030
- 2,069,146 · +7.3%
- By 2040
- 2,338,405 · +21.2%
- By 2050
- 2,586,608 · +34.1%
- By 2075
- 3,061,911 · +58.7%
- By 2100
- 3,234,133 · +67.7%
Race, ethnicity, and origin ACS 2023
- Neighborhood character
- Highly diverse neighborhood (Simpson 0.73)
- Race & ethnicity
- White 36% Asian 31% Hispanic / Latino 20% Two or more races 13% Black 8% Native American 1%
- Hispanic origin (detail)
- Mexican 13%
- Common ancestry
- Russian 3% Lithuanian 2% Slovak 2%
- Foreign-born
- 28% · China, Canada, Vietnam
- Languages at home
- 61% English-only · Chinese 14% Spanish 10% Other Indo-European 3%
Political lean MEDSL · Alameda
- 2024 margin
- Solid D (+53.6) · D 74.6% · R 21.0% · Other 4.4%
- 2008→2024 swing
- -5.9pp toward R · 2008: 59.5pp · 2024: 53.6pp
- All cycles
- 2024: D+53.6 2020: D+62.5 2016: D+64.4 2012: D+59.8 2008: D+59.5
Not yet ingested
- Civics
- —
Market trends
- HPI YoY
- ▼ -934.25%
- Current HPI
- 334.4167
- Rent YoY
- ▲ 3.37%
- Metro
- San Francisco-Oakland-Berkeley, CA
- State GDP YoY
- ▲ 3.21%
- F500 in state
- 116
Industry mix (Fortune 500 HQ in CA)
| Industry | F500 HQs | Revenue |
|---|---|---|
| Technology | 27 | $1,492B |
|
||
| Financial Services | 3 | $174B |
|
||
| Retail | 3 | $44B |
|
||
| Insurance | 3 | $26B |
|
||
| Media / Entertainment | 2 | $115B |
|
||
| Pharmaceuticals / Biotech | 2 | $62B |
|
||
Price history
+112.9% since first listed4 events — show timeline
- 2026-04-16 Pending — bridgeMLS, Bay East AOR, or Contra Costa AOR
- 2026-03-31 Listed $74,500 bridgeMLS, Bay East AOR, or Contra Costa AOR
- 2003-06-23 Sold (MLS) $30,000 bridgeMLS, Bay East AOR, or Contra Costa AOR
- 2003-04-22 Listed $35,000 bridgeMLS, Bay East AOR, or Contra Costa AOR
Cash-flow waterfall
monthlySold comps — $/sqft
last 12 mo · ≤1 miLoading sold comps…