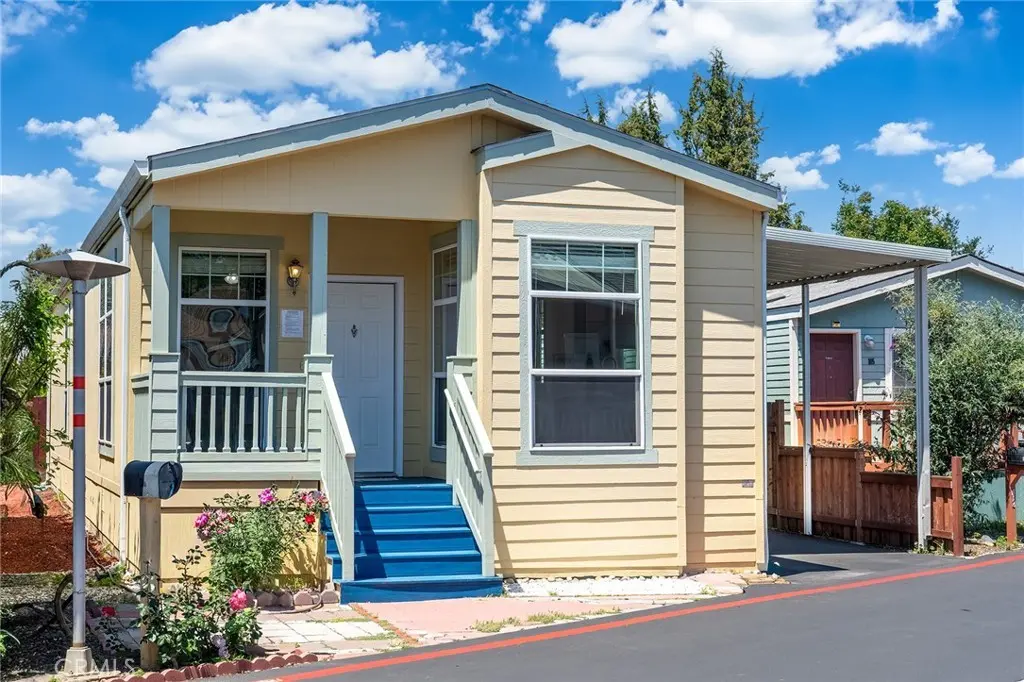
501 Moorpark Way #104 · Mountain View, CA
Flood risk 5/10 · Moderate
- FEMA flood zone
- X
- Chance of flooding over 30 yrs
- 0.66%
- Est. flood insurance / yr
- $507 – $1,088
Fire risk 1/10 · Minimal
- Est. fire insurance / yr
- $659 – $1,223
Heat risk 4/10 · Minor
- Hot days now (above 92°F)
- 7 days/yr
- Hot days in 30 yrs
- 14 days/yr
Wind risk 1/10 · Minimal
- Chance of severe wind over 30 yrs
- —
Air-quality risk 7/10 · Major
- Unhealthy air days now
- 13 days/yr
- Unhealthy air days in 30 yrs
- 13 days/yr
Risk factors via First Street. Map © Google.
Why this score? — see what drove the D+ grade
The composite is a weighted blend of 9 inputs, each scored 0–100. Each bar is that input's sub-score; the figure is the points it added to the 100-point composite (weight × sub-score).
- Cash flow +16.2/30.0
- Schools +8.0/10.0
- DSCR +5.0/10.0
- Appreciation +4.5/10.0
- 1% rule +4.4/10.0
- Livability +4.2/5.0
- Rent growth +3.4/5.0
- Condition / age +2.5/5.0
- ARV discount +0.0/15.0
$498,000
🖨 Deal sheet 📄 Offer letter ✓ Due diligence
Listing remarks
Welcome to 501 Moorpark Way #104, a beautifully maintained mobile home offering an exceptional opportunity to own in the heart of Silicon Valley at an incredible value. Premier Mountain View Los Altos (MVLA) Union High School District . Located in the highly desirable Mountain View community, this spacious home combines comfort, convenience, and modern living in one of the Bay Area’s most sought-after locations. Featuring approximately 1,200 square feet of living space with soaring ceilings and abundant natural light, the home offers an open and airy layout ideal for both daily living and entertaining. The main living areas are enhanced with quality hardwood flooring, creating a warm
Key facts
- Hardwood flooring
- Clubhouse
- Open-concept kitchen
Tags
Property features AI
Finance
- Other: Located in Moorpark Mobile Homes park; Double body type (multi-unit info)
- HOA & community: Part of an association; Association amenities include pool; Community street lighting; Rent includes association dues, trash, and water; Land lease of $845 monthly (seller-provided)
Exterior
- Parking: Driveway and parking space; 3 uncovered parking spaces
- Utilities: Public sewer; District/public water; Water available; Natural gas available; Sewer connected; Cable available; Electricity available
- Home design: Single-story; Entry at level 1; Mobile home remains
- Construction: Year built per public records
- Exterior features: Front porch; Rooftop porch; Back yard; Close to clubhouse; Association pool (fenced)
Interior
- Kitchen: Dishwasher
- Bedrooms: All bedrooms on ground level
- Flooring: Carpet; Laminate
- Bathrooms: 2 full bathrooms
- Heating & cooling: Natural gas heating; Central furnace
- Interior features: One-level home; Turnkey condition; Double pane windows; Association spa
- Laundry & utility: Laundry inside
Neighborhood map
What this means for you Summary
Snapshot
- This is a 3-bed/2.0-bath manufactured listed at $498k.
Deal economics
- At list price, monthly cash flow is $261 ($3k/yr) — positive.
- The deal already cash-flows at list — no discount required.
- To meet the 1% rule (rent ≥ 1% of price), the offer needs to be $469k (5.9% below list).
- Recommended offer: $469k (5.9% below list) — sets the bar for 1% rule.
- Cap rate 6.9% vs local median 1.4% in Mountain View — top-decile yield for the area; either an underpriced asset or a hidden risk that comps aren't pricing in. Stress-test before assuming the spread holds.
Location & tenants
- Location reads 84/100 on livability (#14 in CA, #671 nationally) — a professional / high-income tenant draw. Strengths: amenities A+, commute A+, employment A+; Watch: crime D+, cost of living F.
- Mountain View-Los Altos Union High (urban): math 77% / reading 86% proficiency, ranked #11 of 517 in CA (top 2%) — strong family-tenant draw, lease renewals of 3-5y typical.
- Zoned schools: Mountain View High (math 83% / reading 89%, grade A, #25 of 1,170 statewide, top 2%, 2,220 students, 13% FRL).
- Market conditions: Rents rising (+3.4%/yr); 22 active listings in the ZIP; 40 comparable units currently listed for rent nearby; rentals leasing fast (median 2d on market — plan ~1-2 weeks tenant-placement turnaround); high-income renter base; 3,838 units permitted in Santa Clara County in 2024 (1,886 in 5+ unit buildings).
- This rent runs 31% of the median local income ($179k/yr) — at the standard rent-burdened threshold; future hikes will face affordability resistance.
Forward outlook
- Local home prices are declining (-1.1%/yr); year-one equity from $3k of loan paydown is wiped out by about $5k of value loss. Plan a longer hold.
- Santa Clara County population projected at +24% by 2050 — long-run rental-demand tailwind backs the buy-and-hold thesis.
Negotiation context
- It's been on market 42 days — a 3% lower offer ($483k) is reasonable based on typical stale-listing flexibility.
Risks & watch-outs
- Climate carrying-cost: moderate flood risk — expect insurance premiums to compound above CPI over the hold.
Questions for the listing agent
- It's been on market 42 days. Have you received any prior offers? Is the seller open to a 6% concession, seller financing, or rate buy-down credit?
- Is there a deadline driving the sale (1031 exchange, divorce, estate, relocation)? That informs how much negotiation room exists.
- Schools are A-rated — typically a magnet for longer-tenancy family renters. What's the average tenant stay here, and is there a school-zone premium baked into asking?
- Crime grade is D in this area — have there been break-ins, vandalism, or insurance claims at this property in the last 3 years? What carrier currently insures it and at what premium?
- The area grade is low — what's the realistic commute time and amenity access for the typical tenant pool here? Any planned neighborhood developments (good or bad) we should know about?
- What's the average days-on-market for RENTAL listings here right now (not sales)? A rising rental-DOM trend means longer vacancies and softer asking-rent achievability than the comps imply.
- What's the recent tenant-quality profile in this submarket — average credit score on applications, eviction rate, late-payment / NSF rate, and stable-employment percentage? A property-management company in the area should have these aggregated.
- How much new for-sale + rental construction is in the pipeline within 1–3 miles? Heavy new supply typically softens prices + rents 12–24 months out; constrained supply supports both.
Investment metrics
- 1% rule
- 0.94% ✗
- Cap rate
- 6.92%
- Cash-on-cash
- 2.25%
- DSCR
- 1.10
- GRM
- 8.9
CMA / ARV
- ARV (on-the-fly)
- $345,600
- Comps found
- 12
Show comp detail 12 sales within ~0.75 mi
| Address | Dist | Beds/Ba | Sqft | Sold | Price | $/sf | Match |
|---|---|---|---|---|---|---|---|
| 501 Moorpark Way #83 | 0.16mi | 3/2.0 | 1,212 (+1%) | 15mo | $400,000 | $330 | 78 |
| 501 Moorpark Way #45 | 0.12mi | 2/2.0 (-1) | 1,040 (-13%) | 8mo | $399,000 | $384 | 60 |
| 191 E El Camino Real #213 | 0.24mi | 2/2.0 (-1) | 1,020 (-15%) | 1mo | $305,000 | $299 | 58 |
| 191 E El Camino Real #113 | 0.20mi | 2/2.0 (-1) | 1,100 (-8%) | 20mo | $240,000 | $218 | 56 |
| 433 Sylvan Ave #112 | 0.46mi | 2/2.0 (-1) | 1,100 (-8%) | 13mo | $311,500 | $283 | 49 |
| 433 Sylvan Ave #105 | 0.42mi | 2/2.0 (-1) | 1,120 (-7%) | 20mo | $307,900 | $275 | 48 |
| 325 Sylvan Ave #39 | 0.56mi | 2/2.0 (-1) | 1,100 (-8%) | 9mo | $304,000 | $276 | 47 |
| 325 Sylvan Ave #23 | 0.56mi | 2/2.0 (-1) | 1,035 (-14%) | 1mo | $305,000 | $295 | 45 |
| 325 Sylvan Ave #74 | 0.53mi | 3/2.0 | 1,050 (-12%) | 19mo | $310,000 | $295 | 38 |
| 325 Sylvan Ave #89 | 0.56mi | 2/2.0 (-1) | 1,040 (-13%) | 13mo | $285,000 | $274 | 36 |
| 433 Sylvan Ave #40 | 0.46mi | 2/2.0 (-1) | 1,352 (+13%) | 20mo | $310,000 | $229 | 36 |
| 325 Sylvan Dr #78 | 0.56mi | 2/2.0 (-1) | 1,040 (-13%) | 20mo | $300,000 | $288 | 30 |
Match score weights: distance 35% · size 25% · config 20% · recency 20%. Top-matched comps best support the ARV.
Projected returns pro-forma
-1.06% appreciation · 3.44% rent growth · sell at horizon
- IRR
- -3.3%
- Equity multiple
- 0.86×
- Total profit
- $-19,991
- Equity at exit
- $118,866
- IRR
- 3.9%
- Equity multiple
- 1.37×
- Total profit
- $52,167
- Equity at exit
- $123,675
Cash invested: $139,440 (down + closing). Projections, not guarantees.
Landlord ↔ Tenant lean methodology
- Overall (CITY)
- 0 Strongly Tenant-Friendly
- State California
- 18 Strongly Tenant-Friendly · D+13
- County
- — inherits STATE
- City Mountain View
- 0 Strongly Tenant-Friendly · D+34
ZIP-level market 94041
- Home prices YoY
- -0.3%
- Rents YoY
- 3.4%
- Active inventory
- 22
- Price-to-rent
- 8.9×
Monthly cashflow live
- Estimated rent
- $4,687 high interval (Pro) →
- Mortgage (P&I)
- −$2,612
- Tax est. 1.5%
- −$622 /mo · $7,470/yr
- Insurance
- −$208
- HOA
- −$0
- Vacancy / Maint / Mgmt
- −$984
- Net cashflow
- $261
Break-even live
UW: 25.0% down · 7.5% · 30yr · 1.5% tax · 5.0% vac · 8.0% maint · 8.0% mgmt
Financing live
Cash to close
- Down payment
- $124,500
- Closing costs
- $14,940
- Reserves months
- —
- Total cash needed
- —
Loan-product check · same deal, 3 products live
Conventional
25% down · 7.5% · 30yr
- Down + closing
- —
- Monthly P&I
- —
- Monthly cashflow
- —
- DSCR
- —
- Eligible?
- —
Personal DTI + credit; lowest rate.
DSCR
20% down · 8.5% · 30yr
- Down + closing
- —
- Monthly P&I
- —
- Monthly cashflow
- —
- DSCR
- —
- Eligible?
- —
No personal income docs; deal must DSCR.
Hard money
10% down · 12.0% · 12mo
- Down + closing
- —
- Monthly P&I
- —
- Monthly cashflow
- —
- DSCR
- —
- Eligible?
- —
Short-term bridge; refi at stabilization.
Rent comps 40 comps
| Address | Beds | Baths | Sqft | Rent | $/sqft | DOM | Units | Dist |
|---|---|---|---|---|---|---|---|---|
| 600 Rainbow Dr Mountain View, CA | 1.0–2.0 | 1.0–2.0 | 880 | $4,848 | $5.51 | 1d | 4 | 0.14mi |
| 817 E Dana St Unit 819 Mountain View, CA | 2.0 | 2.0 | 1200 | $4,395 | $3.66 | 1d | 1 | 0.37mi |
| 870 E El Camino Real Mountain View, CA | 1.0–2.0 | 1.0–2.0 | 784 | $3,325 | $4.24 | 1d | 4 | 0.41mi |
| 435 Acalanes Dr Unit 435-22 Sunnyvale, CA | 2.0 | 1.0 | 875 | $2,595 | $2.97 | 3d | 1 | 0.46mi |
| 707 Continental Cir Mountain View, CA | 1.0–2.0 | 1.0–2.0 | 810 | $4,771 | $5.89 | 1d | 25 | 0.48mi |
| 1200 Dale Ave Mountain View, CA | 2.0 | 2.0 | 940 | $4,795 | $5.10 | 1d | 1 | 0.49mi |
| 110 Paul Ave Mountain View, CA | 2.0 | 1.0 | 838 | $4,100 | $4.89 | 3d | 1 | 0.51mi |
| 881 E El Camino Real Mountain View, CA | 2.0 | 2.0 | 1079 | $6,042 | $5.60 | 1d | 1 | 0.52mi |
| 1025 Williams Way Unit 4 Mountain View, CA | 2.0 | 1.0 | 920 | $2,900 | $3.15 | 1d | 1 | 0.54mi |
| 225 Pamela Dr Mountain View, CA | 2.0 | 1.0–2.0 | 733 | $4,800 | $6.55 | 1d | 1 | 0.54mi |
| 1050 Crestview Dr Mountain View, CA | 1.0–2.0 | 1.0–2.0 | 1004 | $4,850 | $4.83 | 1d | 6 | 0.57mi |
| 251 Arriba Dr #450 Sunnyvale, CA | 3.0 | 2.0 | 1300 | $4,970 | $3.82 | 1d | 1 | 0.58mi |
| 1260 Cortez Dr Unit 4 Sunnyvale, CA | 2.0 | 1.5 | 850 | $2,650 | $3.12 | 21d | 1 | 0.60mi |
| 235 S Bernardo Ave Sunnyvale, CA | 1.0–2.0 | 1.0–2.0 | 782 | $4,417 | $5.64 | 1d | 8 | 0.60mi |
| 1033 Crestview Dr #303 Mountain View, CA | 2.0 | 2.0 | 1140 | $3,550 | $3.11 | 23d | 1 | 0.63mi |
| 1223 W McKinley Ave Unit 3 Sunnyvale, CA | 2.0 | 1.0 | 1100 | $3,099 | $2.82 | 1d | 1 | 0.63mi |
| 465 Calderon Ave #1640 Mountain View, CA | 2.0 | 1.0 | 850 | $4,580 | $5.39 | 19d | 1 | 0.63mi |
| 415 S Bernardo Ave Sunnyvale, CA | 2.0 | 2.0 | 1000 | $3,195 | $3.19 | 1d | 1 | 0.64mi |
| 151 Calderon Ave Mountain View, CA | 2.0 | 1.0 | 589 | $4,355 | $7.39 | 1d | 1 | 0.67mi |
| 695 S Knickerbocker Dr #15 Sunnyvale, CA | 2.0 | 2.5 | 1257 | $4,200 | $3.34 | 10d | 1 | 0.68mi |
| 451 Carneros Ave Apt B Sunnyvale, CA | 2.0 | 1.0 | 800 | $3,395 | $4.24 | 1d | 1 | 0.76mi |
| 877 Heatherstone Way Mountain View, CA | 1.0–2.0 | 1.0–2.0 | 825 | $4,369 | $5.30 | 1d | 6 | 0.80mi |
| 555 E Evelyn Ave Mountain View, CA | 3.0 | 1.0–2.0 | 903 | $6,962 | $7.71 | 1d | 18 | 0.80mi |
| 150 Paseo Ct Mountain View, CA | 3.0 | 2.0 | 1288 | $4,550 | $3.53 | 10d | 1 | 0.84mi |
| 179 Georgetown Ct Mountain View, CA | 3.0 | 3.0 | 1288 | $5,000 | $3.88 | 2d | 1 | 0.90mi |
| 100 N Whisman Rd Mountain View, CA | 1.0–2.0 | 1.0–1.5 | 909 | $4,248 | $4.67 | 1d | 6 | 0.93mi |
| 1235 Heatherstone Way Sunnyvale, CA | 2.0 | 1.0 | 1000 | $4,400 | $4.40 | 1d | 1 | 0.94mi |
| 455 W Evelyn Ave Mountain View, CA | 1.0–2.0 | 1.0–2.0 | 992 | $6,615 | $6.66 | 1d | 6 | 0.98mi |
| 375 Hope St Mountain View, CA | 2.0 | 2.0 | 1029 | $4,770 | $4.64 | 2d | 1 | 1.01mi |
| 217 Ada Ave #37 Mountain View, CA | 3.0 | 2.5 | 1484 | $5,400 | $3.64 | 1d | 1 | 1.02mi |
| 15 Cassandra Way #1607 Mountain View, CA | 2.0 | 2.0 | 992 | $6,770 | $6.82 | 1d | 1 | 1.08mi |
| 801 Church St #127 Mountain View, CA | 1.0–2.0 | 1.0–2.0 | 825 | $6,150 | $7.45 | 10d | 2 | 1.11mi |
| 851 Church St Mountain View, CA | 1.0–2.0 | 1.0–2.0 | 832 | $5,962 | $7.16 | 1d | 21 | 1.15mi |
| 651 Franklin St #387 Mountain View, CA | 2.0 | 2.0 | 930 | $5,840 | $6.28 | 10d | 1 | 1.15mi |
| 243 Buena Vista Ave Sunnyvale, CA | 1.0–2.0 | 1.0–2.0 | 785 | $4,368 | $5.56 | 1d | 6 | 1.20mi |
| 1000 Escalon Ave Sunnyvale, CA | 1.0–2.0 | 1.0–2.0 | 815 | $4,350 | $5.34 | 1d | 1 | 1.24mi |
| 505 Cypress Point Dr #70 Mountain View, CA | 2.0 | 1.0 | 843 | $3,500 | $4.15 | 14d | 1 | 1.25mi |
| 100 Moffett Blvd Mountain View, CA | 1.0–2.0 | 1.0–2.0 | 970 | $6,300 | $6.49 | 1d | 4 | 1.27mi |
| 108 Bryant St #1653 Mountain View, CA | 3.0 | 2.5 | 1381 | $5,990 | $4.34 | 1d | 1 | 1.27mi |
| 50 E Middlefield Rd Mountain View, CA | 2.0 | 2.0 | 1100 | $3,500 | $3.18 | 19d | 1 | 1.30mi |
Listing history 15 events
-
2026-06-18days on market $498,000 Active 42 DOM
-
2026-06-17days on market $498,000 Active 41 DOM
-
2026-06-16days on market $498,000 Active 40 DOM
-
2026-06-15days on market $498,000 Active 39 DOM
-
2026-06-13days on market $498,000 Active 37 DOM
-
2026-06-13days on market $498,000 Active 36 DOM
-
2026-06-09days on market $498,000 Active 33 DOM
-
2026-06-08days on market $498,000 Active 32 DOM
-
2026-06-07days on market $498,000 Active 31 DOM
-
2026-06-05days on market $498,000 Active 28 DOM
-
2026-06-03days on market $498,000 Active 27 DOM
-
2026-06-02days on market $498,000 Active 26 DOM
-
2026-06-01days on market $498,000 Active 25 DOM
-
2026-05-31days on market $498,000 Active 24 DOM
-
2026-05-07$498,000 Active
ⓘ Source: listings_history table (triggers on properties + properties_extension) + one-shot
backfill from property_details.listing_events for pre-trigger history.
Climate risk First Street
- Flood 5/10 Major FEMA zone X · 66% chance over 30 yrs
- Wildfire 1/10 Low
- Heat 4/10 Moderate 7 d/yr ≥92°F today · 14 d/yr by 30 yrs out
- Wind 1/10 Low
- Air quality 7/10 Severe 13 unhealthy d/yr today · 13 by 30 yrs out
Nearby sold comps map
Loading sold comps map…
Walkable amenities ~0.75 mi
Loading nearby amenities…
Taxation est. · year 1
- Rental income
- $56,240
- − Mortgage interest
- −$27,896
- − Property taxes
- −$7,470
- − Insurance
- −$2,490
- − Repairs & maintenance
- −$4,499
- − Management
- −$4,499
- − Depreciation
- −$14,487
- Taxable loss
- −$5,102
- Est. tax savings @ 24.0%
- +$1,224
- After-tax cash flow
- $4,355/yr
For passive investors: Depreciation is non-cash, so a rental often shows a tax loss while cash-flowing — sheltering income. Rental losses are passive: they offset passive income freely, and up to $25,000/yr can offset ordinary (W-2) income if you actively participate and your MAGI is under $100k (phasing out to $0 by $150k); unused losses carry forward. On sale, claimed depreciation is recaptured at up to 25%, and gains may owe capital-gains tax (a 1031 exchange can defer both). Figures are a year-1 estimate at your 24.0% rate — not tax advice; consult a CPA.
Schools (NCES district)
- District
- Mountain View-Los Altos Union High
- NCES district ID
- 0626310
- Math proficiency
- 77% ▲ 9.00%
- Reading proficiency
- 86% ▲ 4.00%
- Median HH income
- $161,233
- Composite
- 79.5/100
- National rank
- #59
- State rank
- #11 of 517 in CA
Livability — Mountain View
- Score
- 84/100
- State rank
- #14
- US rank
- #671
Category grades
Schools grade is shown separately in the Schools card above.
Census & demographics
- Census place
- Mountain View, CA
- County
- Santa Clara County · 1,806,974 people
- City population
- 84,858
- Metro
- San Jose-Sunnyvale-Santa Clara, CA
- Population (ZIP)
- 16,050
- Household income
- $178,558
- Rent vs Own
- Severe rent burden
- 981.0
Population outlook (Santa Clara County) Hauer SSP2
- Today (2025)
- 2,179,074 people
- By 2030
- 2,301,297 · +5.6%
- By 2040
- 2,528,195 · +16.0%
- By 2050
- 2,712,135 · +24.5%
- By 2075
- 2,998,701 · +37.6%
- By 2100
- 2,931,429 · +34.5%
Race, ethnicity, and origin ACS 2023
- Neighborhood character
- Highly diverse neighborhood (Simpson 0.71)
- Race & ethnicity
- White 37% Hispanic / Latino 28% Asian 27% Two or more races 13% Black 2% Native American 1%
- Hispanic origin (detail)
- Mexican 17%
- Common ancestry
- Italian 3% Romanian 2% Lithuanian 2%
- Foreign-born
- 39% · Canada, China, Jamaica
- Languages at home
- 50% English-only · Spanish 20% Chinese 11% Other Indo-European 7%
Political lean MEDSL · Santa Clara
- 2024 margin
- Solid D (+40.0) · D 68.1% · R 28.1% · Other 3.8%
- 2008→2024 swing
- -0.9pp no change · 2008: 40.9pp · 2024: 40.0pp
- All cycles
- 2024: D+40.0 2020: D+47.4 2016: D+52.5 2012: D+42.1 2008: D+40.9
Not yet ingested
- Civics
- —
Market trends
- HPI YoY
- ▼ -1.06%
- Current HPI
- 399.4625
- Rent YoY
- ▲ 3.44%
- Metro
- San Jose-Sunnyvale-Santa Clara, CA
- State GDP YoY
- ▲ 3.21%
- F500 in state
- 116
Industry mix (Fortune 500 HQ in CA)
| Industry | F500 HQs | Revenue |
|---|---|---|
| Technology | 27 | $1,492B |
|
||
| Financial Services | 3 | $174B |
|
||
| Retail | 3 | $44B |
|
||
| Insurance | 3 | $26B |
|
||
| Media / Entertainment | 2 | $115B |
|
||
| Pharmaceuticals / Biotech | 2 | $62B |
|
||
Price history
1 event — show timeline
- 2026-05-07 Listed $498,000 CRMLS
Property tax history
-18.4%/yrLatest (2011): $42 · -23.8% YoY. Source: county tax records.
Cash-flow waterfall
monthlySold comps — $/sqft
last 12 mo · ≤1 miLoading sold comps…