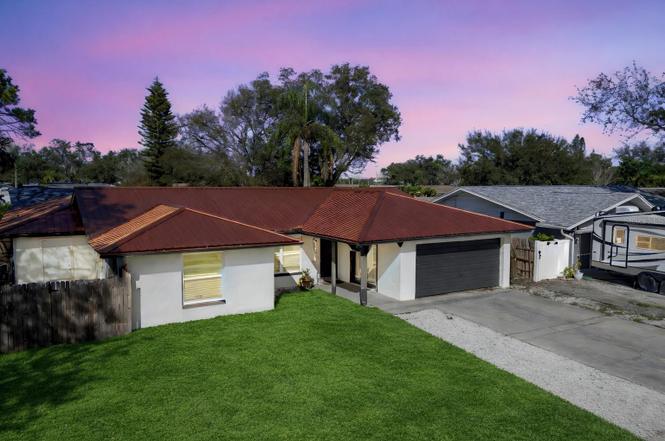
12931 82nd Ave N · Seminole, FL
Flood risk 1/10 · Minimal
- FEMA flood zone
- X (unshaded)
- Chance of flooding over 30 yrs
- 0.0%
- Est. flood insurance / yr
- $507 – $1,088
Fire risk 1/10 · Minimal
- Est. fire insurance / yr
- $947 – $1,759
Heat risk 10/10 · Severe
- Hot days now (above 107°F)
- 7 days/yr
- Hot days in 30 yrs
- 28 days/yr
Wind risk 10/10 · Severe
- Chance of severe wind over 30 yrs
- 99.0%
Air-quality risk 3/10 · Minor
- Unhealthy air days now
- 2 days/yr
- Unhealthy air days in 30 yrs
- 2 days/yr
Risk factors via First Street. Map © Google.
Why this score? — see what drove the B grade
The composite is a weighted blend of 9 inputs, each scored 0–100. Each bar is that input's sub-score; the figure is the points it added to the 100-point composite (weight × sub-score).
- Cash flow +30.0/30.0
- 1% rule +10.0/10.0
- DSCR +10.0/10.0
- ARV discount +6.8/15.0
- Livability +4.4/5.0
- Schools +4.3/10.0
- Rent growth +2.5/5.0
- Condition / age +2.5/5.0
- Appreciation +0.0/10.0
$688,000
🖨 Deal sheet 📄 Offer letter ✓ Due diligence
Listing remarks MLS
This charming home is located in the desirable Seminole neighborhood of Boca Ciega and is a great opportunity for a buyer with a vision of what could be. With 4 bedrooms and 3 bathrooms, this well loved home provides ample space and has so much potential. All of the "big stuff" is done; the metal roof (2015), new electrical panel (2023), AC (2 units, one in 2019, one in 2022) and pool resurfaced (2017). Situated on a corner lot, this home also features a huge in-law suite! Take the time to see this home and start dreaming about what you can do to make it your own. Don't miss out!
Key facts
- Metal roof
- Fenced yard
- Updated home
Tags
Property features AI
Finance
- Other: Homestead exempt; Zoned R-3
- HOA & community: No association indicated
Exterior
- Utilities: Public water; Public sewer; Electricity connected; Cable connected; Water connected; Sewer connected
- Home design: Single family residence; Residential property; One story; Faces south
- Construction: Block and stucco construction; Metal roof; Slab foundation; Built on a 0.19-acre lot (approx. 85 x 100)
- Exterior features: Sidewalk; Sliding doors; In-ground private pool
Interior
- Kitchen: Dishwasher
- Bedrooms: 5 bedrooms
- Flooring: Ceramic tile
- Bathrooms: 3 full bathrooms
- Heating & cooling: Central heating; Central air conditioning
- Interior features: Ceiling fans; Open floor plan; Stone counters
- Laundry & utility: Inside laundry
Neighborhood map
What this means for you Summary
Snapshot
- This is a 5-bed/3.0-bath single-family listed at $688k.
Deal economics
- At list price, monthly cash flow is $4k ($50k/yr) — positive.
- The deal already cash-flows at list — no discount required.
- Meets the 1% rule at list price ($11k rent vs $688k).
- Recommended offer: $605k (12.0% below list) — sets the bar for market timing.
- Cap rate 13.6% vs local median 3.8% in Seminole — top-decile yield for the area; either an underpriced asset or a hidden risk that comps aren't pricing in. Stress-test before assuming the spread holds.
Location & tenants
- Location reads 88/100 on livability (#5 in FL, #174 nationally) — a professional / high-income tenant draw. Strengths: commute A+, housing A+, health & safety A+.
- Pinellas (suburban): math 51% / reading 51% proficiency, ranked #31 of 73 in FL (top 42%) — acceptable for families but not a draw, mixed tenant base, ~2y average lease.
- Zoned schools: Bauder Elementary School (math 80% / reading 73%, grade A, #185 of 2,144 statewide, top 9%, 644 students, 28% FRL); Seminole High School (math 26% / reading 47%, grade F, #351 of 667 statewide, top 54%, 1,546 students, 39% FRL).
- Market conditions: 146 active listings in the ZIP; 4 comparable units currently listed for rent nearby; rentals at typical pace (median 24d on market — plan ~3-4 weeks tenant-placement turnaround); 2,676 units permitted in Pinellas County in 2024 (1,422 in 5+ unit buildings).
Forward outlook
- Local home prices are declining (-3.0%/yr); year-one equity from $5k of loan paydown is wiped out by about $21k of value loss. Plan a longer hold.
- Pinellas County population projected at +14% by 2050 — modest demand growth; plan on rents tracking national, not racing it.
- At projected returns (-3.0% appreciation + 3.0% rent growth), your $193k cash investment doubles in ~5 years — after that, you're playing with house money.
Negotiation context
- It's been on market 132 days — a 12% lower offer ($605k) is reasonable based on typical stale-listing flexibility.
- 2 sale attempts since 3y ago; this cycle's ask has dropped $37k (5%) from the opening price — seller is motivated, your offer sets the floor, not the list.
- Current owner paid $499k; 38% above their basis — modest negotiation headroom, anchor on the comps not their cost.
Risks & watch-outs
- Climate carrying-cost: severe wind risk, 99% chance of damaging wind over 30y; extreme-heat days projected 7→28/yr by 2055 (HVAC capex compounding) — expect insurance premiums to compound above CPI over the hold.
Questions for the listing agent
- It's been on market 132 days. Have you received any prior offers? Is the seller open to a 12% concession, seller financing, or rate buy-down credit?
- Built in 1976 — when were the roof, HVAC, electrical panel, plumbing, and water heater last replaced?
- Why hasn't it sold? Are there any deal-killer items the seller is aware of (foundation, flood, title, zoning, code violations)?
- Is there a deadline driving the sale (1031 exchange, divorce, estate, relocation)? That informs how much negotiation room exists.
- Schools are B-rated — typically a magnet for longer-tenancy family renters. What's the average tenant stay here, and is there a school-zone premium baked into asking?
- What's the average days-on-market for RENTAL listings here right now (not sales)? A rising rental-DOM trend means longer vacancies and softer asking-rent achievability than the comps imply.
- What's the recent tenant-quality profile in this submarket — average credit score on applications, eviction rate, late-payment / NSF rate, and stable-employment percentage? A property-management company in the area should have these aggregated.
- How much new for-sale + rental construction is in the pipeline within 1–3 miles? Heavy new supply typically softens prices + rents 12–24 months out; constrained supply supports both.
Investment metrics
- 1% rule
- 1.60% ✓
- Cap rate
- 13.57%
- Cash-on-cash
- 25.99%
- DSCR
- 2.16
- GRM
- 5.2
CMA / ARV
- ARV (on-the-fly)
- $677,964
- Comps found
- 12
Show comp detail 12 sales within ~0.75 mi
| Address | Dist | Beds/Ba | Sqft | Sold | Price | $/sf | Match |
|---|---|---|---|---|---|---|---|
| 8230 128th St | 0.11mi | 5/2.0 | 2,130 (-8%) | 1mo | $585,000 | $275 | 78 |
| 7753 132nd Way | 0.44mi | 5/3.0 | 2,313 (+0%) | 10mo | $600,000 | $259 | 71 |
| 13189 87th Ave | 0.39mi | 4/3.0 (-1) | 2,418 (+5%) | 1mo | $710,000 | $294 | 67 |
| 8645 Pinetree Dr W | 0.50mi | 4/3.0 (-1) | 2,389 (+4%) | 0mo | $640,000 | $268 | 65 |
| 12432 Monarch Cir | 0.44mi | 4/2.0 (-1) | 2,128 (-8%) | 5mo | $599,900 | $282 | 53 |
| 13564 Oak Run Ct | 0.58mi | 4/2.0 (-1) | 2,214 (-4%) | 6mo | $825,000 | $373 | 52 |
| 7796 132nd Way | 0.44mi | 5/3.0 | 2,622 (+14%) | 7mo | $812,000 | $310 | 51 |
| 12835 74th Ave | 0.50mi | 4/3.0 (-1) | 2,505 (+9%) | 9mo | $735,000 | $293 | 50 |
| 7711 132nd Way | 0.45mi | 4/2.0 (-1) | 2,100 (-9%) | 7mo | $695,000 | $331 | 49 |
| 7490 Pine Valley Ln | 0.65mi | 4/3.0 (-1) | 2,468 (+7%) | 8mo | $858,000 | $348 | 47 |
| 8738 Matthew St | 0.68mi | 4/2.0 (-1) | 2,197 (-5%) | 8mo | $525,000 | $239 | 45 |
| 12312 89th Ter | 0.67mi | 4/2.0 (-1) | 2,092 (-9%) | 2mo | $670,000 | $320 | 43 |
Match score weights: distance 35% · size 25% · config 20% · recency 20%. Top-matched comps best support the ARV.
Projected returns pro-forma
-3.0% appreciation · 3.0% rent growth · sell at horizon
- IRR
- 19.7%
- Equity multiple
- 1.80×
- Total profit
- $154,313
- Equity at exit
- $102,583
- IRR
- 28.0%
- Equity multiple
- 3.47×
- Total profit
- $476,701
- Equity at exit
- $59,486
Cash invested: $192,640 (down + closing). Projections, not guarantees.
Landlord ↔ Tenant lean methodology
- Overall (STATE)
- 87 Strongly Landlord-Friendly
- State Florida
- 87 Strongly Landlord-Friendly · R+3
- County
- — inherits STATE
- City
- — inherits STATE
ZIP-level market 33776
- Active inventory
- 146
- Price-to-rent
- 5.2×
Monthly cashflow live
- Estimated rent
- $11,010 medium interval (Pro) →
- Mortgage (P&I)
- −$3,608
- Tax from tax record
- −$630 /mo · $7,565/yr
- Insurance
- −$287
- HOA
- −$0
- Vacancy / Maint / Mgmt
- −$2,312
- Net cashflow
- $4,173
Break-even live
UW: 25.0% down · 7.5% · 30yr · 1.5% tax · 5.0% vac · 8.0% maint · 8.0% mgmt
Financing live
Cash to close
- Down payment
- $172,000
- Closing costs
- $20,640
- Reserves months
- —
- Total cash needed
- —
Loan-product check · same deal, 3 products live
Conventional
25% down · 7.5% · 30yr
- Down + closing
- —
- Monthly P&I
- —
- Monthly cashflow
- —
- DSCR
- —
- Eligible?
- —
Personal DTI + credit; lowest rate.
DSCR
20% down · 8.5% · 30yr
- Down + closing
- —
- Monthly P&I
- —
- Monthly cashflow
- —
- DSCR
- —
- Eligible?
- —
No personal income docs; deal must DSCR.
Hard money
10% down · 12.0% · 12mo
- Down + closing
- —
- Monthly P&I
- —
- Monthly cashflow
- —
- DSCR
- —
- Eligible?
- —
Short-term bridge; refi at stabilization.
Rent comps 4 comps
| Address | Beds | Baths | Sqft | Rent | $/sqft | DOM | Units | Dist |
|---|---|---|---|---|---|---|---|---|
| 12731 82nd Ave Seminole, FL | 4.0 | 2.0 | 1594 | $3,395 | $2.13 | 24d | 1 | 0.12mi |
| 7672 140th St Unit NA Seminole, FL | 4.0 | 3.5 | 2840 | $4,700 | $1.65 | 4d | 1 | 1.01mi |
| 10075 West Bay St Seminole, FL | 5.0 | 2.5 | 2043 | $8,900 | $4.36 | 24d | 1 | 1.20mi |
| 14323 83rd Pl N Unit 1471180P Seminole, FL | 4.0 | 3.0 | 2895 | $13,452 | $4.65 | 21d | 1 | 1.25mi |
Listing history 19 events
-
2026-06-18days on market $688,000 Active 132 DOM
-
2026-06-17days on market $688,000 Active 131 DOM
-
2026-06-16days on market $688,000 Active 130 DOM
-
2026-06-15days on market $688,000 Active 129 DOM
-
2026-06-13days on market $688,000 Active 127 DOM
-
2026-06-09days on market $688,000 Active 123 DOM
-
2026-06-08days on market $688,000 Active 122 DOM
-
2026-06-07days on market $688,000 Active 121 DOM
-
2026-06-04days on market $688,000 Active 118 DOM
-
2026-06-03days on market $688,000 Active 117 DOM
-
2026-06-01days on market $688,000 Active 115 DOM
-
2026-05-31days on market $688,000 Active 114 DOM
-
2026-04-25price $689,000
-
2026-03-17price $699,000
-
2026-02-06$725,000 Active
-
2023-07-07soldstatus $499,000
-
2023-07-05soldstatus $499,000 Closed 596-char remark
Show marketing remark (596 chars)
This charming home is located in the desirable Seminole neighborhood of Boca Ciega and is a great opportunity for a buyer with a vision of what could be. With 4 bedrooms and 3 bathrooms, this well loved home provides ample space and has so much potential. All of the "big stuff" is done; the metal roof (2015), new electrical panel (2023), AC (2 units, one in 2019, one in 2022) and pool resurfaced (2017). Situated on a corner lot, this home also features a huge in-law suite! Take the time to see this home and start dreaming about what you can do to make it your own. Don't miss out!
-
2023-04-27status Pending 596-char remark
Show marketing remark (596 chars)
This charming home is located in the desirable Seminole neighborhood of Boca Ciega and is a great opportunity for a buyer with a vision of what could be. With 4 bedrooms and 3 bathrooms, this well loved home provides ample space and has so much potential. All of the "big stuff" is done; the metal roof (2015), new electrical panel (2023), AC (2 units, one in 2019, one in 2022) and pool resurfaced (2017). Situated on a corner lot, this home also features a huge in-law suite! Take the time to see this home and start dreaming about what you can do to make it your own. Don't miss out!
-
2023-04-19$499,000 Active 596-char remark
Show marketing remark (596 chars)
This charming home is located in the desirable Seminole neighborhood of Boca Ciega and is a great opportunity for a buyer with a vision of what could be. With 4 bedrooms and 3 bathrooms, this well loved home provides ample space and has so much potential. All of the "big stuff" is done; the metal roof (2015), new electrical panel (2023), AC (2 units, one in 2019, one in 2022) and pool resurfaced (2017). Situated on a corner lot, this home also features a huge in-law suite! Take the time to see this home and start dreaming about what you can do to make it your own. Don't miss out!
ⓘ Source: listings_history table (triggers on properties + properties_extension) + one-shot
backfill from property_details.listing_events for pre-trigger history.
Tax reassessment forecast FL · Resets to sale price
- Current annual tax
- $7,565 · $630/mo
- Projected year-2 tax
- $7,565 · $630/mo
- Expected delta
- $0/yr ($0/mo · 0.0%)
ⓘ Screening estimate from a state-policy table — verify with the county assessor before closing.
Climate risk First Street
- Flood 1/10 Low FEMA zone X (unshaded) · 0% chance over 30 yrs
- Wildfire 1/10 Low
- Heat 10/10 Extreme 7 d/yr ≥107°F today · 28 d/yr by 30 yrs out
- Wind 10/10 Extreme 99% chance of damaging wind over 30 yrs
- Air quality 3/10 Moderate 2 unhealthy d/yr today · 2 by 30 yrs out
Nearby sold comps map
Loading sold comps map…
Walkable amenities ~0.75 mi
Loading nearby amenities…
Taxation est. · year 1
- Rental income
- $132,120
- − Mortgage interest
- −$38,539
- − Property taxes
- −$7,565
- − Insurance
- −$3,440
- − Repairs & maintenance
- −$10,570
- − Management
- −$10,570
- − Depreciation
- −$20,015
- Taxable income
- $41,423
- Est. tax owed @ 24.0%
- −$9,941
- After-tax cash flow
- $40,133/yr
For passive investors: Depreciation is non-cash, so a rental often shows a tax loss while cash-flowing — sheltering income. Rental losses are passive: they offset passive income freely, and up to $25,000/yr can offset ordinary (W-2) income if you actively participate and your MAGI is under $100k (phasing out to $0 by $150k); unused losses carry forward. On sale, claimed depreciation is recaptured at up to 25%, and gains may owe capital-gains tax (a 1031 exchange can defer both). Figures are a year-1 estimate at your 24.0% rate — not tax advice; consult a CPA.
Schools (NCES district)
- District
- Pinellas
- NCES district ID
- 1201560
- Math proficiency
- 51% ▼ -5.00%
- Reading proficiency
- 51% ▼ -3.00%
- Median HH income
- $46,270
- Composite
- 43.27/100
- National rank
- #3046
- State rank
- #31 of 73 in FL
Livability — Seminole
- Score
- 88/100
- State rank
- #5
- US rank
- #174
Category grades
Schools grade is shown separately in the Schools card above.
Census & demographics
- City population
- 42,315
- Population (ZIP)
- 12,711
Population outlook (Pinellas County) Hauer SSP2
- Today (2025)
- 1,027,532 people
- By 2030
- 1,063,586 · +3.5%
- By 2040
- 1,125,020 · +9.5%
- By 2050
- 1,168,637 · +13.7%
- By 2075
- 1,265,188 · +23.1%
- By 2100
- 1,260,357 · +22.7%
Race, ethnicity, and origin ACS 2023
- Neighborhood character
- Predominantly White (84%)
- Race & ethnicity
- White 84% Hispanic / Latino 7% Two or more races 7% Asian 2% Black 2%
- Hispanic origin (detail)
- Mexican 3%
- Common ancestry
- Romanian 7% Lithuanian 3% Slovak 1%
- Foreign-born
- 9% · Canada, Jamaica
- Languages at home
- 89% English-only · Other Indo-European 4% Russian/Polish/Slavic 3% Spanish 2%
Political lean MEDSL · Pinellas
- 2024 margin
- Lean R (+5.2) · D 46.9% · R 52.1%
- 2008→2024 swing
- -13.5pp toward R · 2008: 8.3pp · 2024: -5.2pp
- All cycles
- 2024: R+5.2 2020: D+0.2 2016: R+1.1 2012: D+5.6 2008: D+8.3
Not yet ingested
- Civics
- —
Market trends
- HPI YoY
- ▼ -455.42%
- Current HPI
- 337.3149
- Rent YoY
- —
- Metro
- —
- State GDP YoY
- ▲ 3.28%
- F500 in state
- 36
Industry mix (Fortune 500 HQ in FL)
| Industry | F500 HQs | Revenue |
|---|---|---|
| Industrial Technology | 2 | $29B |
|
||
| Insurance | 2 | $17B |
|
||
| Retail | 1 | $60B |
|
||
| Technology Distribution | 1 | $58B |
|
||
| Homebuilding | 1 | $35B |
|
||
| Technology Manufacturing | 1 | $35B |
|
||
Price history
+38.1% since first listed7 events — show timeline
- 2026-04-25 Price Changed $689,000 Stellar MLS as Distributed by MLS Grid
- 2026-03-17 Price Changed $699,000 Stellar MLS as Distributed by MLS Grid
- 2026-02-06 Listed $725,000 Stellar MLS as Distributed by MLS Grid
- 2023-07-07 Sold (Public Records) $499,000 Public Records
- 2023-07-05 Sold (MLS) $499,000 Stellar MLS as Distributed by MLS Grid
- 2023-04-27 Pending — Stellar MLS as Distributed by MLS Grid
- 2023-04-19 Listed $499,000 Stellar MLS as Distributed by MLS Grid
Property tax history
+8.5%/yrLatest (2025): $7,565 · -1.4% YoY. Source: county tax records.
Cash-flow waterfall
monthlySold comps — $/sqft
last 12 mo · ≤1 miLoading sold comps…