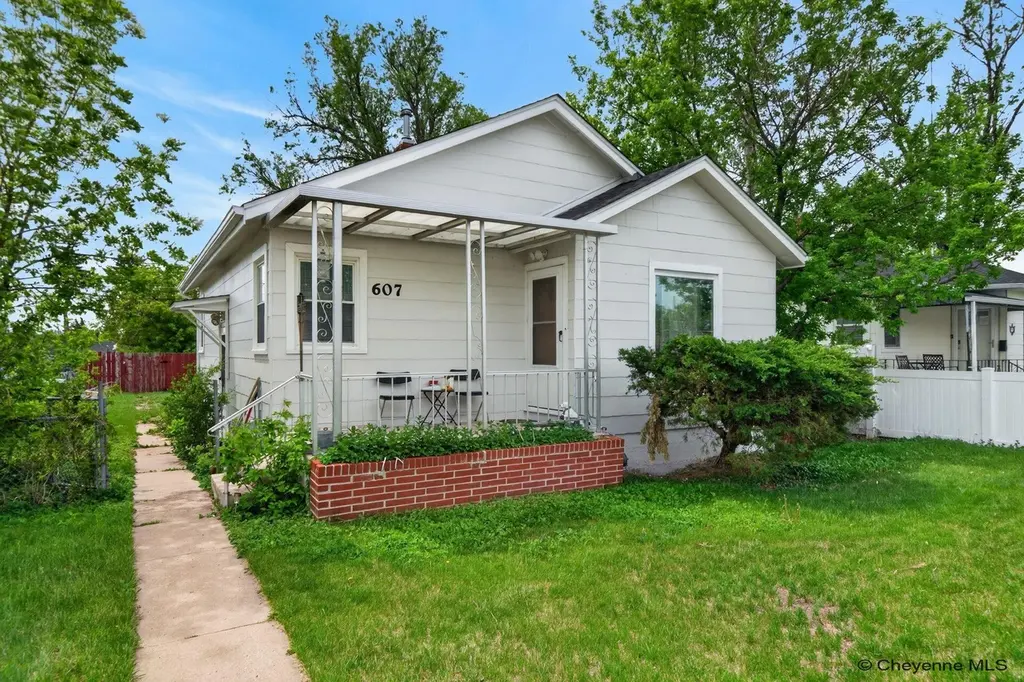
607 E 4th St · Cheyenne, WY
Flood risk 1/10 · Minimal
- FEMA flood zone
- X (unshaded)
- Chance of flooding over 30 yrs
- 0.0%
- Est. flood insurance / yr
- $473 – $860
Fire risk 6/10 · Moderate
- Est. fire insurance / yr
- $564 – $1,046
Heat risk 2/10 · Minimal
- Hot days now (above 89°F)
- 7 days/yr
- Hot days in 30 yrs
- 16 days/yr
Wind risk 2/10 · Minimal
- Chance of severe wind over 30 yrs
- —
Air-quality risk 3/10 · Minor
- Unhealthy air days now
- 2 days/yr
- Unhealthy air days in 30 yrs
- 2 days/yr
Risk factors via First Street. Map © Google.
Why this score? — see what drove the D grade
The composite is a weighted blend of 9 inputs, each scored 0–100. Each bar is that input's sub-score; the figure is the points it added to the 100-point composite (weight × sub-score).
- Cash flow +12.2/30.0
- ARV discount +10.8/15.0
- Livability +4.2/5.0
- Schools +3.9/10.0
- Rent growth +3.8/5.0
- DSCR +3.6/10.0
- 1% rule +2.5/10.0
- Condition / age +2.5/5.0
- Appreciation +0.0/10.0
$225,000
🖨 Deal sheet (PDF) 📄 Offer letter ✓ Due diligence
Key facts
- Covered front porch
- Brand new roof
- Covered patio
Tags
Property features AI
Finance
- Financial info: Annual property tax approximately $1,541.05
Exterior
- Home design: Single-family residence (city residential)
- Exterior features: Lot approximately 0.13 acres
Interior
- Bathrooms: 1 full bathroom
- Interior features: Subdivision: SOUTH CHEYENNE
Neighborhood map
What this means for you Summary
Snapshot
- This is a 3-bed/1.0-bath single-family listed at $225k.
Deal economics
- At list price, monthly cash flow is $-46 ($-547/yr) — negative.
- To cash-flow at today's rent, offer at most $217k (3.6% below list).
- To meet the 1% rule (rent ≥ 1% of price), the offer needs to be $168k (25.4% below list).
- Recommended offer: $168k (25.4% below list) — sets the bar for 1% rule.
- Cap rate 6.0% vs local median 3.1% in Cheyenne — top-decile yield for the area; either an underpriced asset or a hidden risk that comps aren't pricing in. Stress-test before assuming the spread holds.
Location & tenants
- Location reads 83/100 on livability (#2 in WY, #947 nationally) — a professional / high-income tenant draw. Strengths: commute A+, cost of living A+, housing A+; Watch: crime D.
- Laramie County School District #1 (urban): math 41% / reading 48% proficiency, ranked #33 of 41 in WY (top 80%) — families likely to look elsewhere, expect single-tenant / working-renter base with shorter leases.
- Zoned schools: Poder Academy (math 87% / reading 82%, grade A+, #1 of 151 statewide, top 1%, 194 students, 42% FRL, charter); Johnson Junior High School (math 29% / reading 42%, grade F, #53 of 55 statewide, top 96%, 647 students, 66% FRL); South High School (math 23% / reading 29%, grade F, #62 of 75 statewide, top 82%, 1,187 students, 56% FRL) — zoned schools average 54% FRL vs 32% district-wide (23 pts higher); higher-poverty schools than district average — tighter screening recommended.
- Market conditions: Rents rising fast (+5.1%/yr); 171 active listings in the ZIP; 1 comparable units currently listed for rent nearby; 485 units permitted in Laramie County in 2024 (104 in 5+ unit buildings).
- This rent runs 34% of the median local income ($59k/yr) — at the standard rent-burdened threshold; future hikes will face affordability resistance.
Forward outlook
- Local home prices are declining (-3.0%/yr); year-one equity from $2k of loan paydown is wiped out by about $7k of value loss. Plan a longer hold.
- Laramie County population projected at +26% by 2050 — long-run rental-demand tailwind backs the buy-and-hold thesis.
Negotiation context
- Only 5 days on market — expect competitive offers; lowballing is unlikely to land.
- Current owner paid $170k; 32% above their basis — modest negotiation headroom, anchor on the comps not their cost.
Risks & watch-outs
- Watch-outs: built in 1947 — expect roof / HVAC / electrical / plumbing capex.
- Climate carrying-cost: major wildfire risk — expect insurance premiums to compound above CPI over the hold.
Questions for the listing agent
- What do current leases actually rent for vs. the listed asking? Can we see a recent rent roll and the last 12 months of T-12 income?
- Built in 1947 — when were the roof, HVAC, electrical panel, plumbing, and water heater last replaced?
- Is there a deadline driving the sale (1031 exchange, divorce, estate, relocation)? That informs how much negotiation room exists.
- Schools are B-rated — typically a magnet for longer-tenancy family renters. What's the average tenant stay here, and is there a school-zone premium baked into asking?
- Crime grade is D in this area — have there been break-ins, vandalism, or insurance claims at this property in the last 3 years? What carrier currently insures it and at what premium?
- The area grade is low — what's the realistic commute time and amenity access for the typical tenant pool here? Any planned neighborhood developments (good or bad) we should know about?
- What's the average days-on-market for RENTAL listings here right now (not sales)? A rising rental-DOM trend means longer vacancies and softer asking-rent achievability than the comps imply.
- What's the recent tenant-quality profile in this submarket — average credit score on applications, eviction rate, late-payment / NSF rate, and stable-employment percentage? A property-management company in the area should have these aggregated.
- How much new for-sale + rental construction is in the pipeline within 1–3 miles? Heavy new supply typically softens prices + rents 12–24 months out; constrained supply supports both.
Investment metrics
- 1% rule
- 0.75% ✗
- Cap rate
- 6.05%
- Cash-on-cash
- -0.87%
- DSCR
- 0.96
- GRM
- 11.2
CMA / ARV
- ARV (on-the-fly)
- $242,616
- Comps found
- 12
Show comp detail 12 sales within ~0.75 mi
| Address | Dist | Beds/Ba | Sqft | Sold | Price | $/sf | Match |
|---|---|---|---|---|---|---|---|
| 304 E 4th St | 0.20mi | 2/2.0 (-1) | 966 (+5%) | 1mo | $239,999 | $248 | 72 |
| 1012 E 8th St | 0.42mi | 2/1.0 (-1) | 922 (+0%) | 6mo | $249,999 | $271 | 70 |
| 1111 E 7th St | 0.39mi | 3/1.0 | 966 (+5%) | 15mo | $225,000 | $233 | 61 |
| 607 Stanfield Ave | 0.67mi | 3/1.0 | 936 (+2%) | 9mo | $219,000 | $234 | 58 |
| 905 E 6th St | 0.24mi | 2/2.0 (-1) | 987 (+7%) | 12mo | $237,000 | $240 | 58 |
| 415 E 10th St | 0.42mi | 2/1.0 (-1) | 905 (-2%) | 23mo | $225,000 | $249 | 54 |
| 716 Russell Ave | 0.31mi | 2/1.0 (-1) | 835 (-9%) | 17mo | $129,000 | $154 | 51 |
| 317 E 10th St | 0.44mi | 2/1.0 (-1) | 850 (-8%) | 14mo | $250,000 | $294 | 50 |
| 223 W 7th St | 0.51mi | 3/2.0 | 960 (+4%) | 19mo | $255,000 | $266 | 49 |
| 215 E 10th St | 0.47mi | 2/1.0 (-1) | 840 (-9%) | 20mo | $275,000 | $327 | 42 |
| 703 E 10th St | 0.42mi | 2/1.0 (-1) | 1,056 (+15%) | 14mo | $279,000 | $264 | 39 |
| 1208 E 6th St | 0.43mi | 2/1.0 (-1) | 799 (-13%) | 18mo | $229,000 | $287 | 38 |
Match score weights: distance 35% · size 25% · config 20% · recency 20%. Top-matched comps best support the ARV.
Projected returns pro-forma
-3.0% appreciation · 5.08% rent growth · sell at horizon
- IRR
- -15.7%
- Equity multiple
- 0.43×
- Total profit
- $-35,864
- Equity at exit
- $33,548
- IRR
- -4.5%
- Equity multiple
- 0.68×
- Total profit
- $-19,966
- Equity at exit
- $19,454
Cash invested: $63,000 (down + closing). Projections, not guarantees.
Landlord ↔ Tenant lean methodology
- Overall (STATE)
- 90 Strongly Landlord-Friendly
- State Wyoming
- 90 Strongly Landlord-Friendly · R+25
- County
- — inherits STATE
- City
- — inherits STATE
ZIP-level market 82007
- Home prices YoY
- -25.9%
- Rents YoY
- 5.1%
- Active inventory
- 171
- Price-to-rent
- 11.2×
Monthly cashflow live
- Estimated rent
- $1,679 medium interval (Pro) →
- Mortgage (P&I)
- −$1,180
- Tax from tax record
- −$98 /mo · $1,179/yr
- Insurance
- −$94
- HOA
- −$0
- Vacancy / Maint / Mgmt
- −$353
- Net cashflow
- $-46
Break-even live
Sensitivity live
| Price | -10% $82 | -5% $18 | +0% $-46 | +5% $-109 | +10% $-173 |
|---|---|---|---|---|---|
| Rent | -10% $-178 | -5% $-112 | +0% $-46 | +5% $21 | +10% $87 |
| Rate | -1.0pp $68 | -0.5pp $12 | base $-46 | +0.5pp $-104 | +1.0pp $-163 |
UW: 25.0% down · 7.5% · 30yr · 1.5% tax · 5.0% vac · 8.0% maint · 8.0% mgmt
Financing live
Cash to close
- Down payment
- $56,250
- Closing costs
- $6,750
- Reserves months
- —
- Total cash needed
- —
Loan-product check · same deal, 3 products live
Conventional
25% down · 7.5% · 30yr
- Down + closing
- —
- Monthly P&I
- —
- Monthly cashflow
- —
- DSCR
- —
- Eligible?
- —
Personal DTI + credit; lowest rate.
DSCR
20% down · 8.5% · 30yr
- Down + closing
- —
- Monthly P&I
- —
- Monthly cashflow
- —
- DSCR
- —
- Eligible?
- —
No personal income docs; deal must DSCR.
Hard money
10% down · 12.0% · 12mo
- Down + closing
- —
- Monthly P&I
- —
- Monthly cashflow
- —
- DSCR
- —
- Eligible?
- —
Short-term bridge; refi at stabilization.
Rent comps 1 comps
| Address | Beds | Baths | Sqft | Rent | $/sqft | DOM | Units | Dist |
|---|---|---|---|---|---|---|---|---|
| 215 Walterscheid Blvd Cheyenne, WY | 1.0–2.0 | 1.0–2.0 | 818 | $1,625 | $1.99 | 15d | 4 | 0.83mi |
Listing history 9 events
-
2026-06-03status $225,000 Pending 5 DOM
-
2026-06-02days on market $225,000 Active 5 DOM
-
2026-06-01days on market $225,000 Active 4 DOM
-
2026-05-31days on market $225,000 Active 3 DOM
-
2026-05-30days on market $225,000 Active 2 DOM
-
2026-05-28$225,000 Active
-
2026-05-06soldstatus $170,000
-
2007-03-01soldstatus
-
2002-06-04soldstatus
ⓘ Source: listings_history table (triggers on properties + properties_extension) + one-shot
backfill from property_details.listing_events for pre-trigger history.
Tax reassessment forecast WY · Resets to sale price
- Current annual tax
- $1,179 · $98/mo
- Projected year-2 tax
- $1,372 · $114/mo
- Expected delta
- +$194/yr (+$16/mo · 16.4%)
ⓘ Screening estimate from a state-policy table — verify with the county assessor before closing.
Climate risk First Street
- Flood 1/10 Low FEMA zone X (unshaded) · 0% chance over 30 yrs
- Wildfire 6/10 Major
- Heat 2/10 Low 7 d/yr ≥89°F today · 16 d/yr by 30 yrs out
- Wind 2/10 Low
- Air quality 3/10 Moderate 2 unhealthy d/yr today · 2 by 30 yrs out
Nearby sold comps map
Loading sold comps map…
Walkable amenities ~0.75 mi
Loading nearby amenities…
Taxation est. · year 1
- Rental income
- $20,147
- − Mortgage interest
- −$12,603
- − Property taxes
- −$1,179
- − Insurance
- −$1,125
- − Repairs & maintenance
- −$1,612
- − Management
- −$1,612
- − Depreciation
- −$6,545
- Taxable loss
- −$4,530
- Est. tax savings @ 24.0%
- +$1,087
- After-tax cash flow
- $540/yr
For passive investors: Depreciation is non-cash, so a rental often shows a tax loss while cash-flowing — sheltering income. Rental losses are passive: they offset passive income freely, and up to $25,000/yr can offset ordinary (W-2) income if you actively participate and your MAGI is under $100k (phasing out to $0 by $150k); unused losses carry forward. On sale, claimed depreciation is recaptured at up to 25%, and gains may owe capital-gains tax (a 1031 exchange can defer both). Figures are a year-1 estimate at your 24.0% rate — not tax advice; consult a CPA.
Schools (NCES district)
- District
- Laramie County School District #1
- NCES district ID
- 5601980
- Math proficiency
- 41% ▼ -2.00%
- Reading proficiency
- 48% ▼ -2.00%
- Median HH income
- $56,842
- Composite
- 38.86/100
- National rank
- #4103
- State rank
- #33 of 41 in WY
Livability — Cheyenne
- Score
- 83/100
- State rank
- #2
- US rank
- #947
Category grades
Schools grade is shown separately in the Schools card above.
Census & demographics
- Census place
- Cheyenne, WY
- County
- Laramie County · 94,953 people
- City population
- 94,953
- Metro
- Cheyenne, WY
- Population (ZIP)
- 21,704
- Household income
- $58,745
- Rent vs Own
- Severe rent burden
- 854.0
Population outlook (Laramie County) Hauer SSP2
- Today (2025)
- 109,698 people
- By 2030
- 115,710 · +5.5%
- By 2040
- 127,191 · +15.9%
- By 2050
- 138,476 · +26.2%
- By 2075
- 168,653 · +53.7%
- By 2100
- 188,739 · +72.1%
Race, ethnicity, and origin ACS 2023
- Neighborhood character
- Predominantly White (66%)
- Race & ethnicity
- White 66% Hispanic / Latino 27% Two or more races 12% Native American 4% Black 2%
- Hispanic origin (detail)
- Mexican 21%
- Common ancestry
- Lithuanian 2% Slovak 2% Portuguese 2%
- Foreign-born
- 5% · Canada, South Korea
- Languages at home
- 88% English-only · Spanish 10%
Political lean MEDSL · Laramie
- 2024 margin
- Solid R (+32.4) · D 33.0% · R 65.4% · Other 1.6%
- 2008→2024 swing
- -12.1pp toward R · 2008: -20.4pp · 2024: -32.4pp
- All cycles
- 2024: R+32.4 2020: R+28.2 2016: R+33.2 2012: R+24.8 2008: R+20.4
Not yet ingested
- Civics
- —
Market trends
- HPI YoY
- ▼ -90.05%
- Current HPI
- 257.0616
- Rent YoY
- ▲ 5.08%
- Metro
- Cheyenne, WY
- State GDP YoY
- —
- F500 in state
- 0
Price history
+32.4% since first listed4 events — show timeline
- 2026-05-28 Listed $225,000 CBR
- 2026-05-06 Sold (Public Records) $170,000 Public Records
- 2007-03-01 Sold (Public Records) — Public Records
- 2002-06-04 Sold (Public Records) — Public Records
Property tax history
+10.4%/yrLatest (2025): $1,179 · -23.5% YoY. Source: county tax records.
Cash-flow waterfall
monthlySold comps — $/sqft
last 12 mo · ≤1 miLoading sold comps…