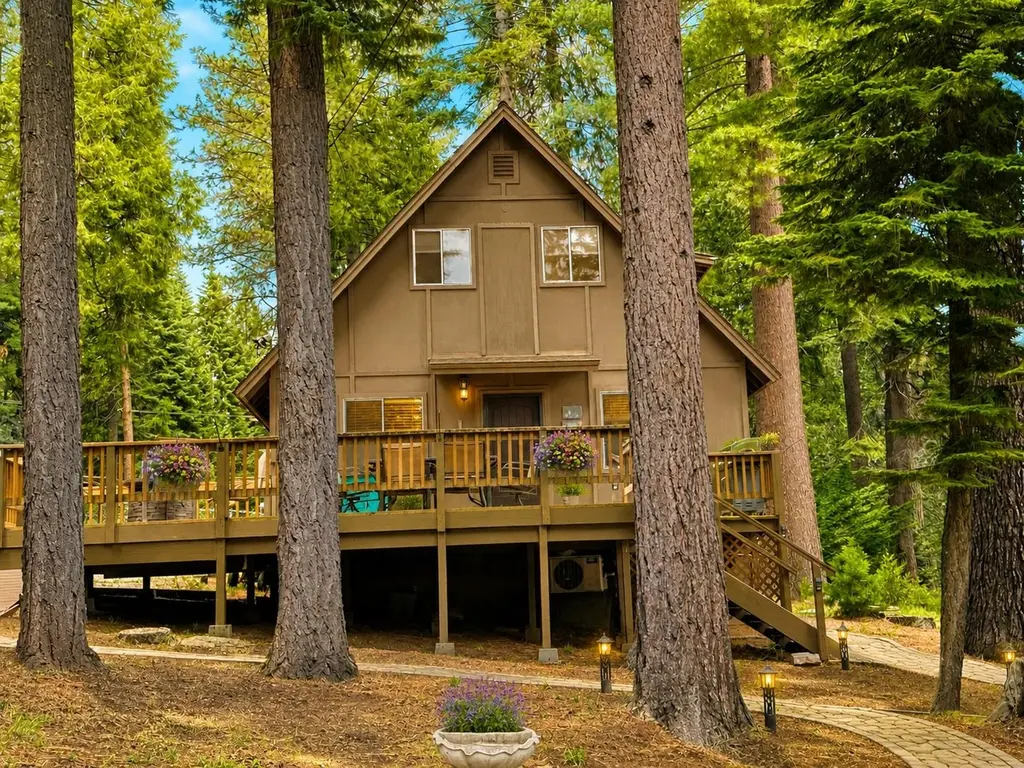
527 Spruce Circle Cir · Lake Almanor Peninsula, CA
Flood risk 1/10 · Minimal
- FEMA flood zone
- X (unshaded)
- Chance of flooding over 30 yrs
- 0.0%
- Est. flood insurance / yr
- $473 – $860
Fire risk 5/10 · Moderate
- Est. fire insurance / yr
- $659 – $1,223
Heat risk 3/10 · Minor
- Hot days now (above 89°F)
- 7 days/yr
- Hot days in 30 yrs
- 17 days/yr
Wind risk 1/10 · Minimal
- Chance of severe wind over 30 yrs
- —
Air-quality risk 10/10 · Severe
- Unhealthy air days now
- 21 days/yr
- Unhealthy air days in 30 yrs
- 25 days/yr
Risk factors via First Street. Map © Google.
Why this score? — see what drove the F grade
The composite is a weighted blend of 9 inputs, each scored 0–100. Each bar is that input's sub-score; the figure is the points it added to the 100-point composite (weight × sub-score).
- Appreciation +5.7/10.0
- ARV discount +4.8/15.0
- Cash flow +4.5/30.0
- Schools +2.8/10.0
- Livability +2.8/5.0
- Rent growth +2.5/5.0
- Condition / age +2.5/5.0
- 1% rule +0.0/10.0
- DSCR +0.0/10.0
$449,000
🖨 Deal sheet 📄 Offer letter ✓ Due diligence
Listing remarks
Nestled among towering pines in the highly sought-after Lake Almanor Pines community, this charming mountain retreat offers the perfect blend of comfort, style, and location. Just a short stroll to local restaurants and minutes from lake access, you’ll enjoy the best of outdoor living right at your doorstep. This beautifully updated 3-bedroom, 2-bath home features a spacious, thoughtfully designed floor plan highlighted by a large, added-on family room—ideal for gathering with friends and family year-round. Warm, natural wood finishes throughout create an inviting cabin feel while still offering modern updates and conveniences. Meticulously maintained, the home reflects true pri
Key facts
- 0.29 acre lot
- Garage
- Built 1980
Property features AI
Exterior
- Parking: 1-car garage; Off-street parking; On-street parking; RV/Boat parking/access
- Utilities: Sewer available
- Home design: Single family residence; Two levels (2 stories)
- Construction: Wood siding; Unknown other construction materials; Composition roof; Concrete perimeter foundation; Built on two levels
- Exterior features: Gas grill; Deck; Partial fencing; Shed(s); Satellite dish; Has view; Sloping topography; Cul-de-sac setting; Wooded lot; Sloped lot
Interior
- Kitchen: Dishwasher; Electric oven; Electric range; Microwave; Refrigerator; Pantry
- Flooring: Carpet; Hardwood; Tile
- Bathrooms: 2 full bathrooms
- Heating & cooling: Ductless heating; Ductless cooling; Ceiling fans
- Interior features: Vaulted ceilings; Walk-in closets; Pantry; Beamed ceilings; Skylights; Window treatments
- Laundry & utility: Washer hookup; Electric dryer hookup; Washer; Dryer
Neighborhood map
What this means for you Summary
Snapshot
- This is a 3-bed/2.0-bath single-family listed at $449k.
Deal economics
- At list price, monthly cash flow is $-1k ($-14k/yr) — negative.
- To cash-flow at today's rent, offer at most $245k (45.4% below list).
- To meet the 1% rule (rent ≥ 1% of price), the offer needs to be $208k (53.7% below list).
- Recommended offer: $208k (53.7% below list) — sets the bar for 1% rule.
- Cap rate 3.2% vs local median 1.2% in Lake Almanor Peninsula — top-decile yield for the area; either an underpriced asset or a hidden risk that comps aren't pricing in. Stress-test before assuming the spread holds.
Location & tenants
- Location reads 56/100 on livability (#781 in CA) — a working-class tenant base; expect higher turnover. Strengths: employment A+, housing A+; Watch: crime C-, schools F, amenities F.
- Plumas Unified (rural): math 21% / reading 44% proficiency, ranked #306 of 517 in CA (top 59%) — families likely to look elsewhere, expect single-tenant / working-renter base with shorter leases.
- Market conditions: 240 active listings in the ZIP; 39 units permitted in Plumas County in 2024 (0 in 5+ unit buildings).
Forward outlook
- In year one you build about $9k of equity ($3k loan paydown + $6k appreciation (1.4% local appreciation)).
- Plumas County population projected at -42% by 2050 — secular population decline; favor cash flow + early exit over multi-decade hold.
- By year 4, paydown + projected appreciation supports a ~$33k cash-out refi (75% LTV) — recoverable capital for the next deal without selling this one.
Negotiation context
- It's been on market 45 days — a 3% lower offer ($436k) is reasonable based on typical stale-listing flexibility.
- Current owner paid $165k; list at $449k implies a 172% gain — meaningful room to come down on a strong offer.
Risks & watch-outs
- Climate carrying-cost: moderate wildfire risk — expect insurance premiums to compound above CPI over the hold.
Questions for the listing agent
- What do current leases actually rent for vs. the listed asking? Can we see a recent rent roll and the last 12 months of T-12 income?
- It's been on market 45 days. Have you received any prior offers? Is the seller open to a 54% concession, seller financing, or rate buy-down credit?
- Is there a deadline driving the sale (1031 exchange, divorce, estate, relocation)? That informs how much negotiation room exists.
- Schools are F-rated, which usually means shorter tenancies and higher turnover. Who's the typical renter profile here, and what's been the actual vacancy rate?
- The area grade is low — what's the realistic commute time and amenity access for the typical tenant pool here? Any planned neighborhood developments (good or bad) we should know about?
- What's the average days-on-market for RENTAL listings here right now (not sales)? A rising rental-DOM trend means longer vacancies and softer asking-rent achievability than the comps imply.
- What's the recent tenant-quality profile in this submarket — average credit score on applications, eviction rate, late-payment / NSF rate, and stable-employment percentage? A property-management company in the area should have these aggregated.
- How much new for-sale + rental construction is in the pipeline within 1–3 miles? Heavy new supply typically softens prices + rents 12–24 months out; constrained supply supports both.
Investment metrics
- 1% rule
- 0.46% ✗
- Cap rate
- 3.21%
- Cash-on-cash
- -11.02%
- DSCR
- 0.51
- GRM
- 18.0
CMA / ARV
- ARV (median comp)
- $423,324
- List price
- $449,000
- Delta
- 6.07%
- Verdict
- FAIR
- Comps
- 20 within 1.0 mi
Show comp detail 2 sales within ~0.75 mi
| Address | Dist | Beds/Ba | Sqft | Sold | Price | $/sf | Match |
|---|---|---|---|---|---|---|---|
| 325 Peninsula Dr | 0.49mi | 2/1.0 (-1) | 1,064 (-5%) | 20mo | $420,000 | $395 | 43 |
| 516 Firland Way Way | 0.21mi | 2/2.0 (-1) | 960 (-14%) | 22mo | $293,500 | $306 | 43 |
Match score weights: distance 35% · size 25% · config 20% · recency 20%. Top-matched comps best support the ARV.
Projected returns pro-forma
1.38% appreciation · 3.0% rent growth · sell at horizon
- IRR
- -8.8%
- Equity multiple
- 0.55×
- Total profit
- $-56,926
- Equity at exit
- $162,157
- IRR
- -3.1%
- Equity multiple
- 0.60×
- Total profit
- $-50,105
- Equity at exit
- $222,531
Cash invested: $125,720 (down + closing). Projections, not guarantees.
Landlord ↔ Tenant lean methodology
- Overall (STATE)
- 18 Strongly Tenant-Friendly
- State California
- 18 Strongly Tenant-Friendly · D+13
- County
- — inherits STATE
- City
- — inherits STATE
ZIP-level market 96137
- Home prices YoY
- 0.9%
- Active inventory
- 240
- Price-to-rent
- 18.0×
Monthly cashflow live
- Estimated rent
- $2,081 medium interval (Pro) →
- Mortgage (P&I)
- −$2,355
- Tax from tax record
- −$256 /mo · $3,075/yr
- Insurance
- −$187
- HOA
- −$0
- Vacancy / Maint / Mgmt
- −$437
- Net cashflow
- $-1,154
Break-even live
UW: 25.0% down · 7.5% · 30yr · 1.5% tax · 5.0% vac · 8.0% maint · 8.0% mgmt
Financing live
Cash to close
- Down payment
- $112,250
- Closing costs
- $13,470
- Reserves months
- —
- Total cash needed
- —
Loan-product check · same deal, 3 products live
Conventional
25% down · 7.5% · 30yr
- Down + closing
- —
- Monthly P&I
- —
- Monthly cashflow
- —
- DSCR
- —
- Eligible?
- —
Personal DTI + credit; lowest rate.
DSCR
20% down · 8.5% · 30yr
- Down + closing
- —
- Monthly P&I
- —
- Monthly cashflow
- —
- DSCR
- —
- Eligible?
- —
No personal income docs; deal must DSCR.
Hard money
10% down · 12.0% · 12mo
- Down + closing
- —
- Monthly P&I
- —
- Monthly cashflow
- —
- DSCR
- —
- Eligible?
- —
Short-term bridge; refi at stabilization.
Listing history 19 events
-
2026-06-19days on market $449,000 Active 45 DOM
-
2026-06-18days on market $449,000 Active 44 DOM
-
2026-06-17days on market $449,000 Active 43 DOM
-
2026-06-16days on market $449,000 Active 42 DOM
-
2026-06-15days on market $449,000 Active 41 DOM
-
2026-06-14days on market $449,000 Active 39 DOM
-
2026-06-13days on market $449,000 Active 38 DOM
-
2026-06-10days on market $449,000 Active 36 DOM
-
2026-06-09days on market $449,000 Active 35 DOM
-
2026-06-08days on market $449,000 Active 34 DOM
-
2026-06-07days on market $449,000 Active 33 DOM
-
2026-06-05days on market $449,000 Active 30 DOM
-
2026-06-03days on market $449,000 Active 29 DOM
-
2026-06-02days on market $449,000 Active 28 DOM
-
2026-06-01days on market $449,000 Active 27 DOM
-
2026-05-31days on market $449,000 Active 26 DOM
-
2026-05-30days on market $449,000 Active 25 DOM
-
2026-05-05$449,000 Active 1259-char remark
-
2003-08-06soldstatus $165,000
ⓘ Source: listings_history table (triggers on properties + properties_extension) + one-shot
backfill from property_details.listing_events for pre-trigger history.
Tax reassessment forecast CA · Resets to sale price
- Current annual tax
- $3,075 · $256/mo
- Projected year-2 tax
- $3,412 · $284/mo
- Expected delta
- +$337/yr (+$28/mo · 11.0%)
ⓘ Screening estimate from a state-policy table — verify with the county assessor before closing.
Climate risk First Street
- Flood 1/10 Low FEMA zone X (unshaded) · 0% chance over 30 yrs
- Wildfire 5/10 Major
- Heat 3/10 Moderate 7 d/yr ≥89°F today · 17 d/yr by 30 yrs out
- Wind 1/10 Low
- Air quality 10/10 Extreme 21 unhealthy d/yr today · 25 by 30 yrs out
Nearby sold comps map
Loading sold comps map…
Walkable amenities ~0.75 mi
Loading nearby amenities…
Taxation est. · year 1
- Rental income
- $24,969
- − Mortgage interest
- −$25,151
- − Property taxes
- −$3,075
- − Insurance
- −$2,245
- − Repairs & maintenance
- −$1,997
- − Management
- −$1,997
- − Depreciation
- −$13,062
- Taxable loss
- −$22,559
- Est. tax savings @ 24.0%
- +$5,414
- After-tax cash flow
- $-8,436/yr
For passive investors: Depreciation is non-cash, so a rental often shows a tax loss while cash-flowing — sheltering income. Rental losses are passive: they offset passive income freely, and up to $25,000/yr can offset ordinary (W-2) income if you actively participate and your MAGI is under $100k (phasing out to $0 by $150k); unused losses carry forward. On sale, claimed depreciation is recaptured at up to 25%, and gains may owe capital-gains tax (a 1031 exchange can defer both). Figures are a year-1 estimate at your 24.0% rate — not tax advice; consult a CPA.
Schools (NCES district)
- District
- Plumas Unified
- NCES district ID
- 0631170
- Math proficiency
- 21% ▼ -11.00%
- Reading proficiency
- 44% ▬ 0.00%
- Median HH income
- $46,935
- Composite
- 27.89/100
- National rank
- #6870
- State rank
- #306 of 517 in CA
Livability — Lake Almanor Peninsula
- Score
- 56/100
- State rank
- #781
- US rank
- #22469
Category grades
Schools grade is shown separately in the Schools card above.
Census & demographics
- Census place
- Lake Almanor Peninsula, CA
- Population (ZIP)
- 2,717
Population outlook (Plumas County) Hauer SSP2
- Today (2025)
- 15,564 people
- By 2030
- 14,014 · -10.0%
- By 2040
- 11,197 · -28.1%
- By 2050
- 9,069 · -41.7%
- By 2075
- 5,573 · -64.2%
- By 2100
- 3,392 · -78.2%
Race, ethnicity, and origin ACS 2023
- Neighborhood character
- Predominantly White (81%)
- Race & ethnicity
- White 81% Hispanic / Latino 10% Two or more races 8% Native American 4%
- Hispanic origin (detail)
- Mexican 5%
- Common ancestry
- Slovak 4% Lithuanian 3% Italian 2%
- Foreign-born
- 4% · Canada
- Languages at home
- 93% English-only · Spanish 5% Other Indo-European 1%
Political lean MEDSL · Plumas
- 2024 margin
- R (+16.9) · D 39.9% · R 56.9% · Other 3.2%
- 2008→2024 swing
- -5.0pp toward R · 2008: -12.0pp · 2024: -16.9pp
- All cycles
- 2024: R+16.9 2020: R+16.7 2016: R+21.0 2012: R+17.2 2008: R+12.0
Not yet ingested
- Civics
- —
Market trends
- HPI YoY
- ▲ 1.38%
- Current HPI
- 153.1005
- Rent YoY
- —
- Metro
- —
- State GDP YoY
- ▲ 3.21%
- F500 in state
- 116
Industry mix (Fortune 500 HQ in CA)
| Industry | F500 HQs | Revenue |
|---|---|---|
| Technology | 27 | $1,492B |
|
||
| Financial Services | 3 | $174B |
|
||
| Retail | 3 | $44B |
|
||
| Insurance | 3 | $26B |
|
||
| Media / Entertainment | 2 | $115B |
|
||
| Pharmaceuticals / Biotech | 2 | $62B |
|
||
Price history
+172.1% since first listed2 events — show timeline
- 2026-05-05 Listed $449,000 PAR
- 2003-08-06 Sold (Public Records) $165,000 Public Records
Property tax history
+4.5%/yrLatest (2025): $3,075 · -0.5% YoY. Source: county tax records.
Cash-flow waterfall
monthlySold comps — $/sqft
last 12 mo · ≤1 miLoading sold comps…