 Triplex
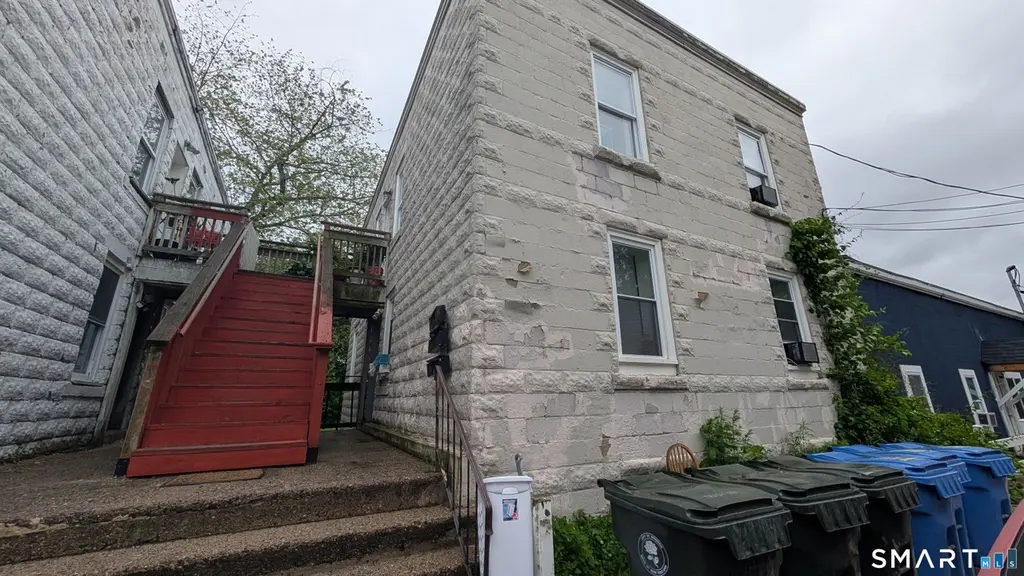
35 Lake St · Norwich, CT
Flood risk 9/10 · Severe
- FEMA flood zone
- X (unshaded)
- Chance of flooding over 30 yrs
- 0.99%
- Est. flood insurance / yr
- $473 – $860
Fire risk 1/10 · Minimal
- Est. fire insurance / yr
- $829 – $1,539
Heat risk 5/10 · Moderate
- Hot days now (above 97°F)
- 7 days/yr
- Hot days in 30 yrs
- 17 days/yr
Wind risk 6/10 · Moderate
- Chance of severe wind over 30 yrs
- 64.0%
Air-quality risk 3/10 · Minor
- Unhealthy air days now
- 2 days/yr
- Unhealthy air days in 30 yrs
- 3 days/yr
Risk factors via First Street. Map © Google.
Why this score? — see what drove the B grade
The composite is a weighted blend of 9 inputs, each scored 0–100. Each bar is that input's sub-score; the figure is the points it added to the 100-point composite (weight × sub-score).
- Cash flow +30.0/30.0
- 1% rule +10.0/10.0
- DSCR +10.0/10.0
- ARV discount +7.2/15.0
- Rent growth +4.2/5.0
- Livability +4.0/5.0
- Condition / age +2.5/5.0
- Schools +2.1/10.0
- Appreciation +0.0/10.0
$299,000
🖨 Deal sheet 📄 Offer letter ✓ Due diligence
Multi-family units
County records classify this as Multi-Family (2-4 Unit). Listing-text estimate: 3 units. confirmed
Listing remarks MLS
$3,050 gross monthly rent! Fully rented triplex with opportunity for upside! Each apartment offers 2 bedrooms and 1 full bathroom. Electric heat/hot water, no cooling. Tenants pay electricity, owner pays building-metered public water/sewer. Natural gas hookups available from street and property is in an Opportunity Zone with accompanying incentives. Yard backs up to Franklin Park with field, playground, and basketball court. Connected exterior staircase bridge should be repaired at some point, a few electric baseboard heaters should be repaired/replaced, electric water heaters nearing end of useful life, building is in otherwise good standing to continue renting over foreseeable future. All tenants are current on rent at the time of posting 4/30/22. Agent owner prefers cash and quick close but will consider all offers. Highest and best offers due by 11:59PM on Sunday May 8th. Make an offer!
Key facts
- 1,742 sq ft lot
- 3 parking spots
- Built 1910
Property features AI
Finance
- Other: Nearby amenities include medical facilities, park, playground/tot lot, public transportation, and shopping/mall
- Financial info: Property offered as a multi-family for sale
Exterior
- Parking: On-street parking; 3 total parking spaces
- Utilities: Public water connected; Public sewer connected; Electric domestic hot water
- Home design: Multi-family property (3-family)
- Construction: Concrete foundation; Concrete construction
- Exterior features: Cement block exterior siding; Flat roof
Interior
- Bedrooms: 9 bedrooms
- Bathrooms: 3 full bathrooms
- Heating & cooling: Baseboard heating (electric); Window air conditioning units
- Interior features: Total of 15 rooms; No basement
- Laundry & utility: No in-unit laundry room listed
Neighborhood map
What this means for you Summary
Snapshot
- This is a 3 × 2-bed/1-bath units multifamily listed at $299k.
Deal economics
- At list price, monthly cash flow is $2k ($22k/yr) — positive. Per door: $599/mo.
- The deal already cash-flows at list — no discount required.
- Meets the 1% rule at list price ($5k rent vs $299k).
- Recommended offer: $295k (1.5% below list) — sets the bar for market timing.
- Cap rate 13.7% vs local median 4.0% in Norwich — top-decile yield for the area; either an underpriced asset or a hidden risk that comps aren't pricing in. Stress-test before assuming the spread holds.
Location & tenants
- Location reads 81/100 on livability (#18 in CT, #1,391 nationally) — a professional / high-income tenant draw. Strengths: housing A+, health & safety A+, commute A-; Watch: schools D+.
- Norwich School District (urban): math 19% / reading 29% proficiency, ranked #139 of 153 in CT (top 91%) — low school quality limits family demand, transient renter base, plan for 1-2y turnover; 62% free/reduced lunch — lower-income household profile, screen leases tightly.
- Market conditions: Rents rising fast (+6.6%/yr); 241 active listings in the ZIP; 1 comparable units currently listed for rent nearby; 487 units permitted in Southeastern Connecticut Planning Region in 2024 (244 in 5+ unit buildings).
- At $4,771/mo this rent would consume 87% of the median local household income ($66k/yr) (locally 1643% of renters already pay >50% of income on rent) — very limited rent-growth headroom before tenants either downsize or default.
Forward outlook
- Local home prices are declining (-3.0%/yr); year-one equity from $2k of loan paydown is wiped out by about $9k of value loss. Plan a longer hold.
- At projected returns (-3.0% appreciation + 6.6% rent growth), your $84k cash investment doubles in ~5 years — after that, you're playing with house money.
Negotiation context
- It's been on market 15 days — a 2% lower offer ($295k) is reasonable based on typical stale-listing flexibility.
- 7 sale attempts since 28y ago; this cycle's ask is 30% above the opening price — seller raised mid-cycle; expect resistance to lowballs.
- Current owner paid $240k; 25% above their basis — modest negotiation headroom, anchor on the comps not their cost.
Risks & watch-outs
- Watch-outs: flood insurance adds $56/mo; built in 1910 — expect roof / HVAC / electrical / plumbing capex.
- Climate carrying-cost: severe flood risk; major wind risk, 64% chance of damaging wind over 30y; extreme-heat days projected 7→17/yr by 2055 (HVAC capex compounding) — expect insurance premiums to compound above CPI over the hold.
Questions for the listing agent
- Can we see the unit-by-unit rent roll, current vacancy, and any below-market leases? What's the average tenancy length?
- What capital expenditures (roof, boiler, parking lot, exteriors) have been made in the last 5 years, and what's planned in the next 2?
- Built in 1910 — when were the roof, HVAC, electrical panel, plumbing, and water heater last replaced?
- What's the actual annual flood-insurance premium (NFIP or private), and is the property in a SFHA with mandatory coverage?
- Is there a deadline driving the sale (1031 exchange, divorce, estate, relocation)? That informs how much negotiation room exists.
- Schools are D-rated, which usually means shorter tenancies and higher turnover. Who's the typical renter profile here, and what's been the actual vacancy rate?
- What's the average days-on-market for RENTAL listings here right now (not sales)? A rising rental-DOM trend means longer vacancies and softer asking-rent achievability than the comps imply.
- What's the recent tenant-quality profile in this submarket — average credit score on applications, eviction rate, late-payment / NSF rate, and stable-employment percentage? A property-management company in the area should have these aggregated.
- How much new apartment / multifamily construction is in the pipeline within 1–3 miles? Heavy new supply (>2% of stock underway) typically softens rents 12–24 months out; light construction supports rent growth.
Investment metrics
- 1% rule
- 1.60% ✓
- Cap rate
- 13.73%
- Cash-on-cash
- 26.56%
- DSCR
- 2.18
- GRM
- 5.2
CMA / ARV
- ARV (on-the-fly)
- $297,024
- Comps found
- 4
Show comp detail 4 sales within ~0.75 mi
| Address | Dist | Beds/Ba | Sqft | Sold | Price | $/sf | Match |
|---|---|---|---|---|---|---|---|
| 57 Boswell Ave | 0.08mi | 5/2.0 (-1) | 1,841 (+13%) | 8mo | $335,000 | $182 | 60 |
| 32 Central Ave | 0.55mi | 5/2.0 (-1) | 1,650 (+1%) | 20mo | $285,000 | $173 | 47 |
| 29 Talman St | 0.61mi | 6/3.0 | 1,820 (+12%) | 7mo | $290,000 | $159 | 46 |
| 33 Pratte Ave | 0.53mi | 5/2.0 (-1) | 1,815 (+11%) | 23mo | $330,000 | $182 | 28 |
Match score weights: distance 35% · size 25% · config 20% · recency 20%. Top-matched comps best support the ARV.
Projected returns pro-forma
-3.0% appreciation · 6.62% rent growth · sell at horizon
- IRR
- 23.4%
- Equity multiple
- 2.00×
- Total profit
- $84,038
- Equity at exit
- $44,582
- IRR
- 33.5%
- Equity multiple
- 4.59×
- Total profit
- $300,248
- Equity at exit
- $25,852
Cash invested: $83,720 (down + closing). Projections, not guarantees.
Landlord ↔ Tenant lean methodology
- Overall (STATE)
- 27 Tenant-Leaning
- State Connecticut
- 27 Tenant-Leaning · D+7
- County
- — inherits STATE
- City
- — inherits STATE
ZIP-level market 06360
- Home prices YoY
- -19.9%
- Rents YoY
- 6.6%
- Active inventory
- 241
- Price-to-rent
- 15.7×
Monthly cashflow live
- Estimated rent
- $4,771 high interval (Pro) →
- Mortgage (P&I)
- −$1,568
- Tax from tax record
- −$224 /mo · $2,685/yr
- Insurance
- −$125
- Flood insurance flood zone
- −$56 /mo · $666/yr
- HOA
- −$0
- Vacancy / Maint / Mgmt
- −$1,002
- Net cashflow
- $1,797
Break-even live
3-unit breakdown (identical units grouped — click to expand)
| Units | Beds | Baths | Est. rent |
|---|---|---|---|
| 3× units | 2 | 1 | $4,770 |
| #1 | 2 | 1 | $1,590 |
| #2 | 2 | 1 | $1,590 |
| #3 | 2 | 1 | $1,590 |
| Total (3 units) | $4,771 | ||
UW: 25.0% down · 7.5% · 30yr · 1.5% tax · 5.0% vac · 8.0% maint · 8.0% mgmt
Financing live
Cash to close
- Down payment
- $74,750
- Closing costs
- $8,970
- Reserves months
- —
- Total cash needed
- —
Loan-product check · same deal, 3 products live
Conventional
25% down · 7.5% · 30yr
- Down + closing
- —
- Monthly P&I
- —
- Monthly cashflow
- —
- DSCR
- —
- Eligible?
- —
Personal DTI + credit; lowest rate.
DSCR
20% down · 8.5% · 30yr
- Down + closing
- —
- Monthly P&I
- —
- Monthly cashflow
- —
- DSCR
- —
- Eligible?
- —
No personal income docs; deal must DSCR.
Hard money
10% down · 12.0% · 12mo
- Down + closing
- —
- Monthly P&I
- —
- Monthly cashflow
- —
- DSCR
- —
- Eligible?
- —
Short-term bridge; refi at stabilization.
Rent comps 1 comps
| Address | Beds | Baths | Sqft | Rent | $/sqft | DOM | Units | Dist |
|---|---|---|---|---|---|---|---|---|
| 41 Elizabeth St Norwich, CT | 5.0 | 2.0 | 1133 | $1,700 | $1.50 | 21d | 1 | 1.08mi |
Listing history 13 events
-
2026-06-19days on market $299,000 Active 15 DOM
-
2026-06-18days on market $299,000 Active 14 DOM
-
2026-06-17days on market $299,000 Active 13 DOM
-
2026-06-16days on market $299,000 Active 12 DOM
-
2026-06-15days on market $299,000 Active 11 DOM
-
2026-06-14days on market $299,000 Active 9 DOM
-
2026-06-13days on market $299,000 Active 8 DOM
-
2026-06-10days on market $299,000 Active 6 DOM
-
2026-06-09days on market $299,000 Active 5 DOM
-
2026-06-08days on market $299,000 Active 4 DOM
-
2026-06-07statusdays on market $299,000 Active 3 DOM
-
2026-06-01remarks 675-char remark
-
2026-06-01$299,000 Coming Soon 1 DOM
ⓘ Source: listings_history table (triggers on properties + properties_extension) + one-shot
backfill from property_details.listing_events for pre-trigger history.
Tax reassessment forecast CT · Partial reset (capped growth)
- Current annual tax
- $2,685 · $224/mo
- Projected year-2 tax
- $4,542 · $378/mo
- Expected delta
- +$1,857/yr (+$155/mo · 69.2%)
ⓘ Screening estimate from a state-policy table — verify with the county assessor before closing.
Climate risk First Street
- Flood 9/10 Extreme FEMA zone X (unshaded) · 99% chance over 30 yrs
- Wildfire 1/10 Low
- Heat 5/10 Major 7 d/yr ≥97°F today · 17 d/yr by 30 yrs out
- Wind 6/10 Major 64% chance of damaging wind over 30 yrs
- Air quality 3/10 Moderate 2 unhealthy d/yr today · 3 by 30 yrs out
Nearby sold comps map
Loading sold comps map…
Walkable amenities ~0.75 mi
Loading nearby amenities…
Taxation est. · year 1
- Rental income
- $57,252
- − Mortgage interest
- −$16,749
- − Property taxes
- −$2,685
- − Insurance
- −$2,162
- − Repairs & maintenance
- −$4,580
- − Management
- −$4,580
- − Depreciation
- −$8,698
- Taxable income
- $17,798
- Est. tax owed @ 24.0%
- −$4,272
- After-tax cash flow
- $17,295/yr
For passive investors: Depreciation is non-cash, so a rental often shows a tax loss while cash-flowing — sheltering income. Rental losses are passive: they offset passive income freely, and up to $25,000/yr can offset ordinary (W-2) income if you actively participate and your MAGI is under $100k (phasing out to $0 by $150k); unused losses carry forward. On sale, claimed depreciation is recaptured at up to 25%, and gains may owe capital-gains tax (a 1031 exchange can defer both). Figures are a year-1 estimate at your 24.0% rate — not tax advice; consult a CPA.
Schools (NCES district)
- District
- Norwich School District
- NCES district ID
- 0903120
- Math proficiency
- 19% ▼ -8.00%
- Reading proficiency
- 29% ▼ -7.00%
- Median HH income
- $50,813
- Composite
- 21.27/100
- National rank
- #8395
- State rank
- #139 of 153 in CT
Livability — Norwich
- Score
- 81/100
- State rank
- #18
- US rank
- #1391
Category grades
Schools grade is shown separately in the Schools card above.
Census & demographics
- Census place
- Norwich, CT
- County
- New London County · 147,197 people
- City population
- 37,216
- Metro
- Norwich-New London, CT
- Population (ZIP)
- 37,216
- Household income
- $65,539
- Rent vs Own
- Severe rent burden
- 1643.0
Population outlook (Southeastern Connecticut County) Hauer SSP2
- By 2040
- 293,442
Race, ethnicity, and origin ACS 2023
- Neighborhood character
- Diverse neighborhood (Simpson 0.63)
- Race & ethnicity
- White 56% Hispanic / Latino 21% Two or more races 12% Black 10% Asian 7%
- Hispanic origin (detail)
- Mexican 3% Puerto Rican 9% Cuban 1% Dominican 3%
- Common ancestry
- Lithuanian 8% Romanian 5% Hispanic 4%
- Foreign-born
- 15% · Canada, China
- Languages at home
- 77% English-only · Spanish 11% French/Haitian/Cajun 4% Chinese 3%
Political lean MEDSL · Southeastern Connecticut
- 2024 margin
- D (+13.0) · D 55.6% · R 42.6% · Other 1.8%
- All cycles
- 2024: D+13.0
Not yet ingested
- Civics
- —
Market trends
- HPI YoY
- ▼ -65.27%
- Current HPI
- 261.8575
- Rent YoY
- ▲ 6.62%
- Metro
- Norwich-New London, CT
- State GDP YoY
- ▲ 1.06%
- F500 in state
- 38
Industry mix (Fortune 500 HQ in CT)
| Industry | F500 HQs | Revenue |
|---|---|---|
| Industrial Machinery | 4 | $38B |
|
||
| Insurance | 3 | $71B |
|
||
| Financial Services | 2 | $25B |
|
||
| Transportation / Logistics | 2 | $18B |
|
||
| Healthcare | 1 | $247B |
|
||
| Telecommunications | 1 | $55B |
|
||
Price history
+149.2% since first listed23 events — show timeline
- 2026-06-01 Coming Soon $299,000 Smart MLS
- 2022-06-22 Sold (Public Records) $250,000 Public Records
- 2022-06-22 Sold (MLS) $240,000 Smart MLS
- 2022-05-09 Contingent — Smart MLS
- 2022-05-08 Price Changed $228,899 Smart MLS
- 2022-05-07 Price Changed $228,999 Smart MLS
- 2022-05-04 Price Changed $229,000 Smart MLS
- 2022-04-30 Listed $230,000 Smart MLS
- 2021-12-28 Sold (MLS) $124,000 Smart MLS
- 2021-11-28 Contingent — Smart MLS
- 2021-11-28 Listed $155,900 Smart MLS
- 2021-11-26 Listing Removed — Smart MLS
- 2021-11-17 Contingent — Smart MLS
- 2021-08-27 Listed $155,900 Smart MLS
- 2014-07-09 Listing Removed — Smart MLS
- 2013-08-05 Listed $97,000 Smart MLS
- 2009-03-20 Sold (MLS) $45,000 Smart MLS
- 2008-11-17 Listed $45,000 Smart MLS
- 2006-08-16 Sold (Public Records) $260,000 Public Records
- 2001-04-27 Sold (MLS) $15,000 Smart MLS
- 2000-11-13 Listed $17,000 Smart MLS
- 1999-12-31 Listing Removed — Smart MLS
- 1998-08-11 Listed $120,000 Smart MLS
Property tax history
-1.2%/yrLatest (2023): $2,685 · +0.3% YoY. Source: county tax records.
Cash-flow waterfall
monthlySold comps — $/sqft
last 12 mo · ≤1 miLoading sold comps…