208 E Merced · Avenal, CA
Flood risk 1/10 · Minimal
- FEMA flood zone
- X (shaded)
- Chance of flooding over 30 yrs
- 0.0%
- Est. flood insurance / yr
- $507 – $1,088
Fire risk 6/10 · Moderate
- Est. fire insurance / yr
- $659 – $1,223
Heat risk 7/10 · Major
- Hot days now (above 102°F)
- 5 days/yr
- Hot days in 30 yrs
- 11 days/yr
Wind risk 1/10 · Minimal
- Chance of severe wind over 30 yrs
- —
Air-quality risk 10/10 · Severe
- Unhealthy air days now
- 23 days/yr
- Unhealthy air days in 30 yrs
- 23 days/yr
Risk factors via First Street. Map © Google.
Why this score? — see what drove the C+ grade
The composite is a weighted blend of 9 inputs, each scored 0–100. Each bar is that input's sub-score; the figure is the points it added to the 100-point composite (weight × sub-score).
- Cash flow +24.6/30.0
- Appreciation +10.0/10.0
- DSCR +7.9/10.0
- ARV discount +7.5/15.0
- 1% rule +5.5/10.0
- Livability +3.0/5.0
- Rent growth +2.5/5.0
- Condition / age +2.5/5.0
- Schools +0.9/10.0
$95,000
🖨 Deal sheet (PDF) 📄 Offer letter ✓ Due diligence
Listing remarks
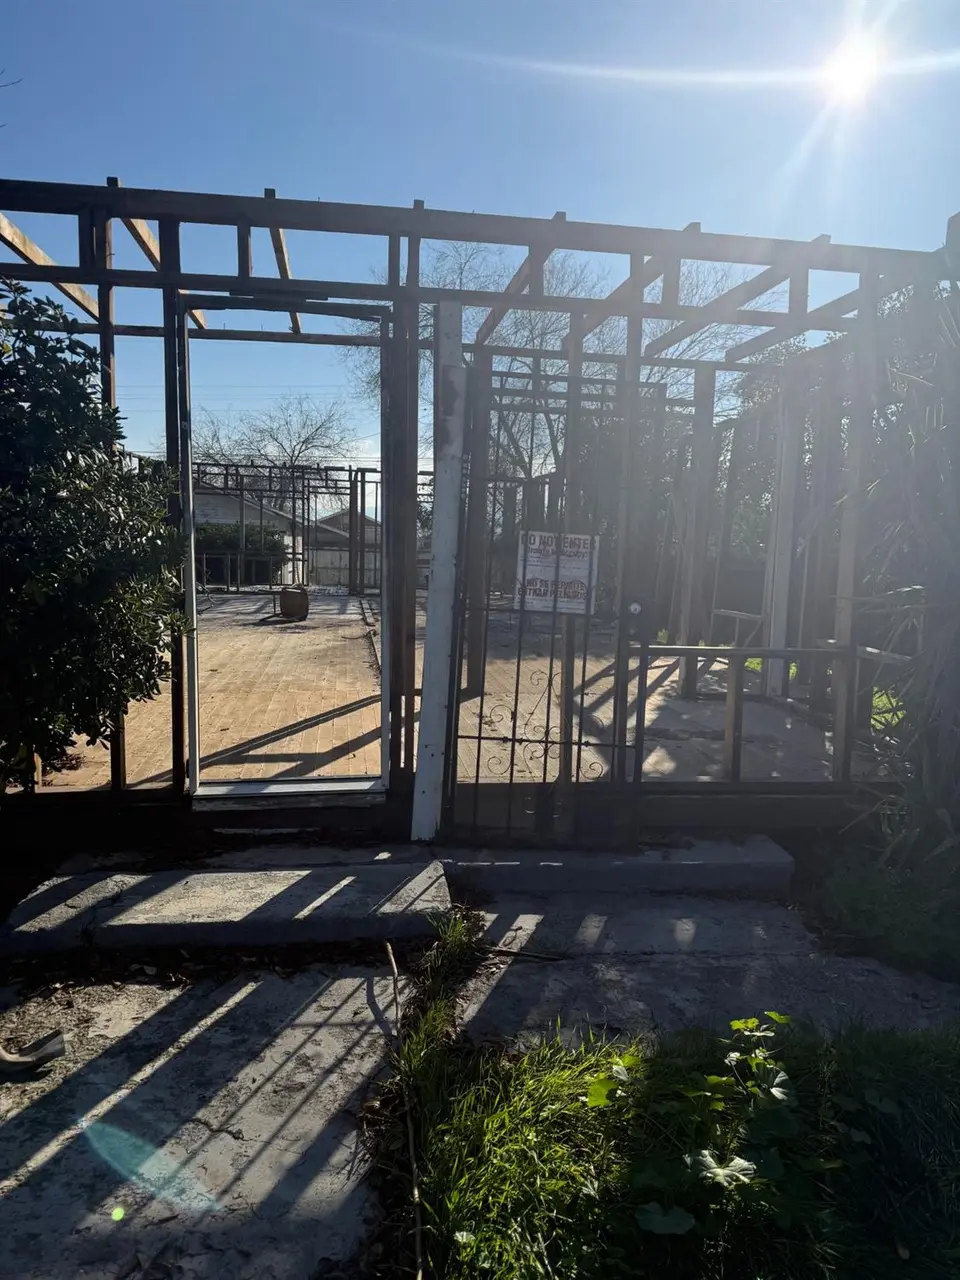
this is a clean property ready to build it was already demolished and clean ready for a new project. originally 3 bedrooms one bath
Key facts
- Clean property
- Ready to build
- 6,250 sq ft lot
Tags
Property features AI
Exterior
- Parking: Detached 2-car garage
- Utilities: Public utilities; Electric service: Off
- Home design: Single family residence; Entry level not specified
- Construction: Wood subfloor foundation; Other construction materials; Other roof
- Exterior features: One level; Urban lot setting; No residential solar
Interior
- Bedrooms: Data not provided
- Bathrooms: 1 bathroom
- Heating & cooling: No cooling
- Interior features: No central cooling
- Laundry & utility: No laundry hookups listed
Neighborhood map
What this means for you Summary
Snapshot
- This is a 3-bed/1.0-bath single-family listed at $95k.
Deal economics
- At list price, monthly cash flow is $196 ($2k/yr) — positive.
- The deal already cash-flows at list — no discount required.
- Meets the 1% rule at list price ($1k rent vs $95k).
- Recommended offer: $94k (1.5% below list) — sets the bar for market timing.
- Cap rate 8.8% vs local median 1.6% in Avenal — top-decile yield for the area; either an underpriced asset or a hidden risk that comps aren't pricing in. Stress-test before assuming the spread holds.
Location & tenants
- Location reads 60/100 on livability (#565 in CA) — a middle-class / working-renter tenant base. Strengths: housing A+; Watch: amenities F, employment D-, health & safety F.
- Reef-Sunset Unified (town): math 6% / reading 17% proficiency, ranked #502 of 517 in CA (top 97%) — low school quality limits family demand, transient renter base, plan for 1-2y turnover; 90% free/reduced lunch — lower-income household profile, screen leases tightly.
- Zoned schools: Avenal Elementary (math 6% / reading 12%, grade F, #1,544 of 1,571 statewide, top 98%, 667 students, 89% FRL); Reef Sunset Middle (math 4% / reading 14%, grade F, #494 of 498 statewide, top 99%, 562 students, 92% FRL); Avenal High (math 22% / reading 47%, grade F, #618 of 1,170 statewide, top 56%, 786 students, 90% FRL) — zoned schools at 90% FRL track the district average.
- Market conditions: 35 active listings in the ZIP; 1 comparable units currently listed for rent nearby; 741 units permitted in Kings County in 2024 (307 in 5+ unit buildings).
Forward outlook
- In year one you build about $10k of equity ($657 loan paydown + $10k appreciation (10.0% local appreciation)).
- At projected returns (10.0% appreciation + 3.0% rent growth), your $27k cash investment doubles in ~3 years — after that, you're playing with house money.
- By year 4, paydown + projected appreciation supports a ~$36k cash-out refi (75% LTV) — recoverable capital for the next deal without selling this one.
Negotiation context
- It's been on market 26 days — a 2% lower offer ($94k) is reasonable based on typical stale-listing flexibility.
- Current owner paid $60k; list at $95k implies a 58% gain — meaningful room to come down on a strong offer.
Risks & watch-outs
- Watch-outs: built in 1935 — expect roof / HVAC / electrical / plumbing capex.
- Climate carrying-cost: major wildfire risk; extreme-heat days projected 5→11/yr by 2055 (HVAC capex compounding) — expect insurance premiums to compound above CPI over the hold.
Questions for the listing agent
- Built in 1935 — when were the roof, HVAC, electrical panel, plumbing, and water heater last replaced?
- Is there a deadline driving the sale (1031 exchange, divorce, estate, relocation)? That informs how much negotiation room exists.
- Schools are F-rated, which usually means shorter tenancies and higher turnover. Who's the typical renter profile here, and what's been the actual vacancy rate?
- What's the average days-on-market for RENTAL listings here right now (not sales)? A rising rental-DOM trend means longer vacancies and softer asking-rent achievability than the comps imply.
- What's the recent tenant-quality profile in this submarket — average credit score on applications, eviction rate, late-payment / NSF rate, and stable-employment percentage? A property-management company in the area should have these aggregated.
- How much new for-sale + rental construction is in the pipeline within 1–3 miles? Heavy new supply typically softens prices + rents 12–24 months out; constrained supply supports both.
Investment metrics
- 1% rule
- 1.05% ✓
- Cap rate
- 8.77%
- Cash-on-cash
- 8.86%
- DSCR
- 1.39
- GRM
- 7.9
CMA / ARV
- ARV (on-the-fly)
- $293,888
- Comps found
- 12
Show comp detail 12 sales within ~0.75 mi
| Address | Dist | Beds/Ba | Sqft | Sold | Price | $/sf | Match |
|---|---|---|---|---|---|---|---|
| 301 E Madera St | 0.08mi | 3/1.0 | 1,296 (-1%) | 14mo | $225,000 | $174 | 82 |
| 301 E Madera St | 0.08mi | 3/1.0 | 1,296 (-1%) | 14mo | $225,000 | $174 | 82 |
| 104 E San Joaquin St | 0.16mi | 3/2.0 | 1,252 (-5%) | 5mo | $289,000 | $231 | 77 |
| 104 W Mariposa St | 0.27mi | 3/2.0 | 1,248 (-5%) | 5mo | $340,000 | $272 | 71 |
| 324 E San Mateo St | 0.34mi | 3/2.0 | 1,292 (-2%) | 11mo | $270,000 | $209 | 69 |
| 420 E Merced St | 0.21mi | 2/1.0 (-1) | 1,232 (-6%) | 13mo | $240,000 | $195 | 64 |
| 124 W Merced St | 0.19mi | 3/2.0 | 1,152 (-12%) | 8mo | $230,000 | $200 | 60 |
| 605 Sonoma Ln | 0.49mi | 3/2.0 | 1,216 (-7%) | 4mo | $300,000 | $247 | 57 |
| 740 E Monterey St | 0.53mi | 3/2.0 | 1,156 (-12%) | 2mo | $121,000 | $105 | 50 |
| 516 E Monterey | 0.34mi | 2/1.0 (-1) | 1,128 (-14%) | 7mo | $265,000 | $235 | 50 |
| 429 San Benito St | 0.57mi | 4/2.0 (+1) | 1,225 (-7%) | 14mo | $275,000 | $224 | 42 |
| 429 San Benito St | 0.57mi | 4/2.0 (+1) | 1,225 (-7%) | 14mo | $275,000 | $224 | 42 |
Match score weights: distance 35% · size 25% · config 20% · recency 20%. Top-matched comps best support the ARV.
Projected returns pro-forma
10.0% appreciation · 3.0% rent growth · sell at horizon
- IRR
- 30.7%
- Equity multiple
- 3.41×
- Total profit
- $64,221
- Equity at exit
- $85,584
- IRR
- 26.6%
- Equity multiple
- 7.74×
- Total profit
- $179,239
- Equity at exit
- $184,564
Cash invested: $26,600 (down + closing). Projections, not guarantees.
Landlord ↔ Tenant lean methodology
- Overall (STATE)
- 18 Strongly Tenant-Friendly
- State California
- 18 Strongly Tenant-Friendly · D+13
- County
- — inherits STATE
- City
- — inherits STATE
ZIP-level market 93204
- Home prices YoY
- 4.6%
- Active inventory
- 35
- Price-to-rent
- 7.9×
Monthly cashflow live
- Estimated rent
- $1,000 medium interval (Pro) →
- Mortgage (P&I)
- −$498
- Tax from tax record
- −$56 /mo · $671/yr
- Insurance
- −$40
- HOA
- −$0
- Vacancy / Maint / Mgmt
- −$210
- Net cashflow
- $196
Break-even live
Sensitivity live
| Price | -10% $250 | -5% $223 | +0% $196 | +5% $169 | +10% $143 |
|---|---|---|---|---|---|
| Rent | -10% $117 | -5% $157 | +0% $196 | +5% $236 | +10% $275 |
| Rate | -1.0pp $244 | -0.5pp $220 | base $196 | +0.5pp $172 | +1.0pp $147 |
UW: 25.0% down · 7.5% · 30yr · 1.5% tax · 5.0% vac · 8.0% maint · 8.0% mgmt
Financing live
Cash to close
- Down payment
- $23,750
- Closing costs
- $2,850
- Reserves months
- —
- Total cash needed
- —
Loan-product check · same deal, 3 products live
Conventional
25% down · 7.5% · 30yr
- Down + closing
- —
- Monthly P&I
- —
- Monthly cashflow
- —
- DSCR
- —
- Eligible?
- —
Personal DTI + credit; lowest rate.
DSCR
20% down · 8.5% · 30yr
- Down + closing
- —
- Monthly P&I
- —
- Monthly cashflow
- —
- DSCR
- —
- Eligible?
- —
No personal income docs; deal must DSCR.
Hard money
10% down · 12.0% · 12mo
- Down + closing
- —
- Monthly P&I
- —
- Monthly cashflow
- —
- DSCR
- —
- Eligible?
- —
Short-term bridge; refi at stabilization.
Rent comps 1 comps
| Address | Beds | Baths | Sqft | Rent | $/sqft | DOM | Units | Dist |
|---|---|---|---|---|---|---|---|---|
| 909 Grangeville Ave Avenal, CA | 3.0 | 2.0 | 1686 | $1,000 | $0.59 | 15d | 1 | 1.20mi |
Listing history 20 events
-
2026-06-21days on market $95,000 Active 26 DOM
-
2026-06-19days on market $95,000 Active 24 DOM
-
2026-06-18days on market $95,000 Active 23 DOM
-
2026-06-17days on market $95,000 Active 22 DOM
-
2026-06-16days on market $95,000 Active 21 DOM
-
2026-06-15days on market $95,000 Active 20 DOM
-
2026-06-14days on market $95,000 Active 18 DOM
-
2026-06-13days on market $95,000 Active 17 DOM
-
2026-06-10days on market $95,000 Active 15 DOM
-
2026-06-09days on market $95,000 Active 14 DOM
-
2026-06-08days on market $95,000 Active 13 DOM
-
2026-06-07days on market $95,000 Active 12 DOM
-
2026-06-05days on market $95,000 Active 9 DOM
-
2026-06-03days on market $95,000 Active 8 DOM
-
2026-06-02days on market $95,000 Active 7 DOM
-
2026-06-01days on market $95,000 Active 6 DOM
-
2026-05-31days on market $95,000 Active 5 DOM
-
2026-05-30days on market $95,000 Active 4 DOM
-
2026-05-26$95,000 Active
-
2024-09-30soldstatus $60,000
ⓘ Source: listings_history table (triggers on properties + properties_extension) + one-shot
backfill from property_details.listing_events for pre-trigger history.
Tax reassessment forecast CA · Resets to sale price
- Current annual tax
- $671 · $56/mo
- Projected year-2 tax
- $722 · $60/mo
- Expected delta
- +$51/yr (+$4/mo · 7.7%)
ⓘ Screening estimate from a state-policy table — verify with the county assessor before closing.
Climate risk First Street
- Flood 1/10 Low FEMA zone X (shaded) · 0% chance over 30 yrs
- Wildfire 6/10 Major
- Heat 7/10 Severe 5 d/yr ≥102°F today · 11 d/yr by 30 yrs out
- Wind 1/10 Low
- Air quality 10/10 Extreme 23 unhealthy d/yr today · 23 by 30 yrs out
Nearby sold comps map
Loading sold comps map…
Walkable amenities ~0.75 mi
Loading nearby amenities…
Taxation est. · year 1
- Rental income
- $12,000
- − Mortgage interest
- −$5,321
- − Property taxes
- −$671
- − Insurance
- −$475
- − Repairs & maintenance
- −$960
- − Management
- −$960
- − Depreciation
- −$2,764
- Taxable income
- $849
- Est. tax owed @ 24.0%
- −$204
- After-tax cash flow
- $2,152/yr
For passive investors: Depreciation is non-cash, so a rental often shows a tax loss while cash-flowing — sheltering income. Rental losses are passive: they offset passive income freely, and up to $25,000/yr can offset ordinary (W-2) income if you actively participate and your MAGI is under $100k (phasing out to $0 by $150k); unused losses carry forward. On sale, claimed depreciation is recaptured at up to 25%, and gains may owe capital-gains tax (a 1031 exchange can defer both). Figures are a year-1 estimate at your 24.0% rate — not tax advice; consult a CPA.
Schools (NCES district)
- District
- Reef-Sunset Unified
- NCES district ID
- 0632270
- Math proficiency
- 6% ▼ -10.00%
- Reading proficiency
- 17% ▼ -9.00%
- Median HH income
- $34,148
- Composite
- 9.31/100
- National rank
- #9857
- State rank
- #502 of 517 in CA
Livability — Avenal
- Score
- 60/100
- State rank
- #565
- US rank
- #18579
Category grades
Schools grade is shown separately in the Schools card above.
Census & demographics
- Census place
- Avenal, CA
- Population (ZIP)
- 13,441
Population outlook (Kings County) Hauer SSP2
- Today (2025)
- 147,136 people
- By 2030
- 145,623 · -1.0%
- By 2040
- 146,017 · -0.8%
- By 2050
- 145,239 · -1.3%
- By 2075
- 131,479 · -10.6%
- By 2100
- 103,967 · -29.3%
Race, ethnicity, and origin ACS 2023
- Neighborhood character
- Predominantly Hispanic (86%)
- Race & ethnicity
- Hispanic / Latino 86% Two or more races 24% White 8% Black 3% Native American 2% Asian 1%
- Hispanic origin (detail)
- Mexican 80%
- Foreign-born
- 36% · Canada, China
- Languages at home
- 23% English-only · Spanish 76%
Political lean MEDSL · Kings
- 2024 margin
- Strong R (+23.0) · D 37.4% · R 60.4% · Other 2.2%
- 2008→2024 swing
- -8.9pp toward R · 2008: -14.1pp · 2024: -23.0pp
- All cycles
- 2024: R+23.0 2020: R+12.2 2016: R+14.1 2012: R+16.3 2008: R+14.1
Not yet ingested
- Civics
- —
Market trends
- HPI YoY
- ▲ 14.16%
- Current HPI
- 319.6641
- Rent YoY
- —
- Metro
- —
- State GDP YoY
- ▲ 3.21%
- F500 in state
- 116
Industry mix (Fortune 500 HQ in CA)
| Industry | F500 HQs | Revenue |
|---|---|---|
| Technology | 27 | $1,492B |
|
||
| Financial Services | 3 | $174B |
|
||
| Retail | 3 | $44B |
|
||
| Insurance | 3 | $26B |
|
||
| Media / Entertainment | 2 | $115B |
|
||
| Pharmaceuticals / Biotech | 2 | $62B |
|
||
Price history
+58.3% since first listed2 events — show timeline
- 2026-05-26 Listed $95,000 FRESNOMLS
- 2024-09-30 Sold (Public Records) $60,000 Public Records
Property tax history
+23.3%/yrLatest (2025): $671 · +632.0% YoY. Source: county tax records.
Cash-flow waterfall
monthlySold comps — $/sqft
last 12 mo · ≤1 miLoading sold comps…