292 JJ Craver Rd · Pine Harbor, TX
Flood risk No data
- FEMA flood zone
- —
- Chance of flooding over 30 yrs
- —
- Est. flood insurance / yr
- —
Fire risk No data
- Est. fire insurance / yr
- —
Heat risk No data
- Hot days now (above threshold)
- —
- Hot days in 30 yrs
- —
Wind risk No data
- Chance of severe wind over 30 yrs
- —
Air-quality risk No data
- Unhealthy air days now
- —
- Unhealthy air days in 30 yrs
- —
Risk factors via First Street. Map © Google.
Why this score? — see what drove the C+ grade
The composite is a weighted blend of 9 inputs, each scored 0–100. Each bar is that input's sub-score; the figure is the points it added to the 100-point composite (weight × sub-score).
- Cash flow +25.1/30.0
- DSCR +8.2/10.0
- ARV discount +7.5/15.0
- 1% rule +6.6/10.0
- Appreciation +5.4/10.0
- Schools +4.8/10.0
- Rent growth +2.5/5.0
- Livability +2.5/5.0
- Condition / age +2.2/5.0
$99,900
🖨 Deal sheet (PDF) 📄 Offer letter ✓ Due diligence
Listing remarks MLS
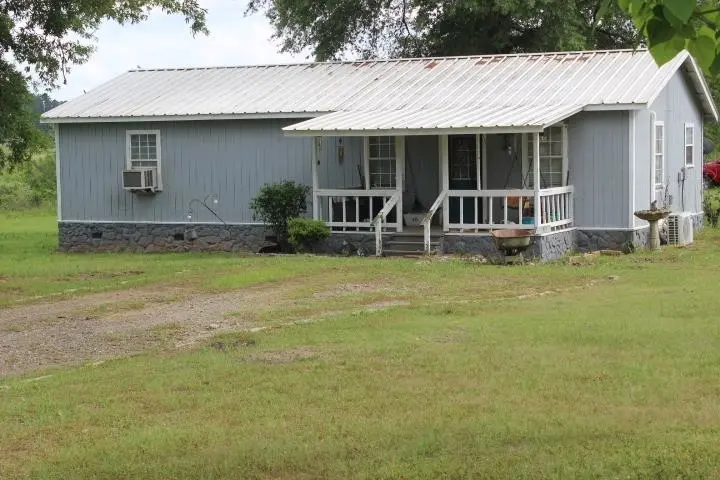
Escape to the country with this move-in ready 2 bedroom, 1 bath home nestled on 2 unrestricted acres at the end of a peaceful dead-end road. Privacy, space, and simplicity come together in this charming property, ideal for those looking to slow down and enjoy the outdoors. Located in the highly-rated Harleton School District with no restrictions, you’re free to build, garden, raise animals, or simply relax under the wide open Texas skies. Affordable, peaceful, and full of potential—this one’s a rare find!
Key facts
- Move in ready
- Unrestricted acres
- 2 acre lot
Tags
Neighborhood map
What this means for you Summary
Snapshot
- This is a 2-bed/1.0-bath single-family listed at $100k. Condition is rated fair.
Deal economics
- At list price, monthly cash flow is $221 ($3k/yr) — positive.
- The deal already cash-flows at list — no discount required.
- Meets the 1% rule at list price ($1k rent vs $100k).
- Recommended offer: $88k (12.0% below list) — sets the bar for market timing.
Location & tenants
- Location reads 50/100 on livability (#1,494 in TX) — a working-class tenant base; expect higher turnover. Strengths: cost of living A+; Watch: crime F, amenities F, commute F.
- Harleton ISD (rural): math 55% / reading 58% proficiency, ranked #104 of 826 in TX (top 13%) — acceptable for families but not a draw, mixed tenant base, ~2y average lease.
- Zoned schools: Harleton El (math 47% / reading 57%, grade C-, #742 of 4,322 statewide, top 19%, 332 students, 53% FRL); Harleton J H (math 62% / reading 57%, grade B, #166 of 1,662 statewide, top 11%, 161 students, 48% FRL); Harleton H S (math 54% / reading 62%, grade C, #319 of 1,632 statewide, top 20%, 212 students, 41% FRL).
- Market conditions: 46 active listings in the ZIP; 85 units permitted in Harrison County in 2024 (15 in 5+ unit buildings).
Forward outlook
- In year one you build about $2k of equity ($691 loan paydown + $842 appreciation (0.8% local appreciation)).
- At projected returns (0.8% appreciation + 3.0% rent growth), your $28k cash investment doubles in ~6 years — after that, you're playing with house money.
Negotiation context
- It's been on market 189 days — a 12% lower offer ($88k) is reasonable based on typical stale-listing flexibility.
- 3 sale attempts since 2y ago with the ask held roughly flat each time — persistent listings suggest the price (not the market) is what's stuck; bring a comps-based counter.
Questions for the listing agent
- It's been on market 189 days. Have you received any prior offers? Is the seller open to a 12% concession, seller financing, or rate buy-down credit?
- Have any recent inspections been done? Can we get a copy of the seller's disclosures and any deferred-maintenance estimates?
- Why hasn't it sold? Are there any deal-killer items the seller is aware of (foundation, flood, title, zoning, code violations)?
- Is there a deadline driving the sale (1031 exchange, divorce, estate, relocation)? That informs how much negotiation room exists.
- Schools are F-rated, which usually means shorter tenancies and higher turnover. Who's the typical renter profile here, and what's been the actual vacancy rate?
- Crime grade is F in this area — have there been break-ins, vandalism, or insurance claims at this property in the last 3 years? What carrier currently insures it and at what premium?
- What's the average days-on-market for RENTAL listings here right now (not sales)? A rising rental-DOM trend means longer vacancies and softer asking-rent achievability than the comps imply.
- What's the recent tenant-quality profile in this submarket — average credit score on applications, eviction rate, late-payment / NSF rate, and stable-employment percentage? A property-management company in the area should have these aggregated.
- How much new for-sale + rental construction is in the pipeline within 1–3 miles? Heavy new supply typically softens prices + rents 12–24 months out; constrained supply supports both.
Investment metrics
- 1% rule
- 1.16% ✓
- Cap rate
- 8.95%
- Cash-on-cash
- 9.50%
- DSCR
- 1.42
- GRM
- 7.2
CMA / ARV
No comps found within radius.
Projected returns pro-forma
0.84% appreciation · 3.0% rent growth · sell at horizon
- IRR
- 10.8%
- Equity multiple
- 1.54×
- Total profit
- $15,227
- Equity at exit
- $33,290
- IRR
- 14.8%
- Equity multiple
- 2.76×
- Total profit
- $49,318
- Equity at exit
- $43,616
Cash invested: $27,972 (down + closing). Projections, not guarantees.
Landlord ↔ Tenant lean methodology
- Overall (STATE)
- 87 Strongly Landlord-Friendly
- State Texas
- 87 Strongly Landlord-Friendly · R+5
- County
- — inherits STATE
- City
- — inherits STATE
ZIP-level market 75651
- Home prices YoY
- 0.8%
- Active inventory
- 46
- Price-to-rent
- 7.2×
Monthly cashflow live
- Estimated rent
- $1,154 medium interval (Pro) →
- Mortgage (P&I)
- −$524
- Tax est. 1.5%
- −$125 /mo · $1,498/yr
- Insurance
- −$42
- HOA
- −$0
- Lot rent
- −$0
- Vacancy / Maint / Mgmt
- −$242
- Net cashflow
- $221
Break-even live
Sensitivity live
| Price | -10% $291 | -5% $256 | +0% $221 | +5% $187 | +10% $152 |
|---|---|---|---|---|---|
| Rent | -10% $130 | -5% $176 | +0% $221 | +5% $267 | +10% $313 |
| Rate | -1.0pp $272 | -0.5pp $247 | base $221 | +0.5pp $196 | +1.0pp $169 |
UW: 25.0% down · 7.5% · 30yr · 1.5% tax · 5.0% vac · 8.0% maint · 8.0% mgmt
Financing live
Cash to close
- Down payment
- $24,975
- Closing costs
- $2,997
- Reserves months
- —
- Total cash needed
- —
Loan-product check · same deal, 3 products live
Conventional
25% down · 7.5% · 30yr
- Down + closing
- —
- Monthly P&I
- —
- Monthly cashflow
- —
- DSCR
- —
- Eligible?
- —
Personal DTI + credit; lowest rate.
DSCR
20% down · 8.5% · 30yr
- Down + closing
- —
- Monthly P&I
- —
- Monthly cashflow
- —
- DSCR
- —
- Eligible?
- —
No personal income docs; deal must DSCR.
Hard money
10% down · 12.0% · 12mo
- Down + closing
- —
- Monthly P&I
- —
- Monthly cashflow
- —
- DSCR
- —
- Eligible?
- —
Short-term bridge; refi at stabilization.
Listing history 24 events
-
2026-06-23days on market $99,900 Active 189 DOM
-
2026-06-22days on market $99,900 Active 188 DOM
-
2026-06-19days on market $99,900 Active 186 DOM
-
2026-06-18days on market $99,900 Active 185 DOM
-
2026-06-17days on market $99,900 Active 184 DOM
-
2026-06-16days on market $99,900 Active 183 DOM
-
2026-06-15days on market $99,900 Active 182 DOM
-
2026-06-14days on market $99,900 Active 180 DOM
-
2026-06-13days on market $99,900 Active 179 DOM
-
2026-06-10days on market $99,900 Active 177 DOM
-
2026-06-09days on market $99,900 Active 176 DOM
-
2026-06-08days on market $99,900 Active 175 DOM
-
2026-06-07days on market $99,900 Active 174 DOM
-
2026-06-05days on market $99,900 Active 171 DOM
-
2026-06-03days on market $99,900 Active 170 DOM
-
2026-06-02days on market $99,900 Active 169 DOM
-
2026-06-01days on market $99,900 Active 168 DOM
-
2026-05-31days on market $99,900 Active 167 DOM
-
2026-05-30days on market $99,900 Active 166 DOM
-
2025-12-15$105,000 Active 528-char remark
Show marketing remark (528 chars)
Escape to the country with this move-in ready 2 bedroom, 1 bath home nestled on 2 unrestricted acres at the end of a peaceful dead-end road. Privacy, space, and simplicity come together in this charming property, ideal for those looking to slow down and enjoy the outdoors. Located in the highly-rated Harleton School District with no restrictions, you’re free to build, garden, raise animals, or simply relax under the wide open Texas skies. Affordable, peaceful, and full of potential—this one’s a rare find!
-
2025-06-17price $104,000
-
2025-04-26$109,000 Active
-
2024-06-27price $99,888
-
2024-06-04$104,888 Active
ⓘ Source: listings_history table (triggers on properties + properties_extension) + one-shot
backfill from property_details.listing_events for pre-trigger history.
Nearby sold comps map
Loading sold comps map…
Walkable amenities ~0.75 mi
Loading nearby amenities…
Taxation est. · year 1
- Rental income
- $13,851
- − Mortgage interest
- −$5,596
- − Property taxes
- −$1,498
- − Insurance
- −$500
- − Repairs & maintenance
- −$1,108
- − Management
- −$1,108
- − Depreciation
- −$2,906
- Taxable income
- $1,135
- Est. tax owed @ 24.0%
- −$272
- After-tax cash flow
- $2,385/yr
For passive investors: Depreciation is non-cash, so a rental often shows a tax loss while cash-flowing — sheltering income. Rental losses are passive: they offset passive income freely, and up to $25,000/yr can offset ordinary (W-2) income if you actively participate and your MAGI is under $100k (phasing out to $0 by $150k); unused losses carry forward. On sale, claimed depreciation is recaptured at up to 25%, and gains may owe capital-gains tax (a 1031 exchange can defer both). Figures are a year-1 estimate at your 24.0% rate — not tax advice; consult a CPA.
Condition & rehab AI · 6 photos
This single-family home requires moderate renovations to improve its exterior and interior condition, enhancing its resale and rental value.
Repairs flagged
- Major roof — Significant rust and deterioration
- Major exterior siding — Worn and peeling
- Major flooring — Worn and in need of replacement
Value-add opportunities
- Both Paint exterior — Enhances curb appeal and value
- Both Replace flooring — Improves comfort and aesthetics
- Both Replace roof — Essential for structural integrity and longevity
Renovation cost estimate screening
| Repair item | Severity | Est. cost |
|---|---|---|
| roof · Significant rust and deterioration | Major | $15,000–50,000 |
| exterior siding · Worn and peeling | Major | $15,000–50,000 |
| flooring · Worn and in need of replacement | Major | $15,000–50,000 |
| Total estimated repair cost · 3 items | $45,000–150,000 |
Value-add ROI direction
- Both Paint exterior — Enhances curb appeal and value ↑
- Both Replace flooring — Improves comfort and aesthetics ↑
- Both Replace roof — Essential for structural integrity and longevity ↑
ⓘ Cost ranges are severity-bucket heuristics (US national rule-of-thumb). Get contractor quotes + a written scope before underwriting a rehab budget.
Schools (NCES district)
- District
- Harleton ISD
- NCES district ID
- 4822500
- Math proficiency
- 55% ▼ -11.00%
- Reading proficiency
- 58% ▬ 0.00%
- Median HH income
- $43,941
- Composite
- 47.59/100
- National rank
- #2261
- State rank
- #104 of 826 in TX
Livability — Pine Harbor
- Score
- 50/100
- State rank
- #1494
- US rank
- #25521
Category grades
Schools grade is shown separately in the Schools card above.
Census & demographics
- Population (ZIP)
- 2,231
Population outlook (Harrison County) Hauer SSP2
- Today (2025)
- 68,691 people
- By 2030
- 69,317 · +0.9%
- By 2040
- 69,973 · +1.9%
- By 2050
- 70,090 · +2.0%
- By 2075
- 70,607 · +2.8%
- By 2100
- 67,546 · -1.7%
Race, ethnicity, and origin ACS 2023
- Neighborhood character
- Predominantly White (84%)
- Race & ethnicity
- White 84% Black 10% Hispanic / Latino 5% Native American 4%
- Hispanic origin (detail)
- Mexican 5%
- Common ancestry
- Italian 1% Hungarian 1% Slovak 1%
- Foreign-born
- 1%
- Languages at home
- 99% English-only · Spanish 1%
Political lean MEDSL · Harrison
- 2024 margin
- Solid R (+50.6) · D 24.4% · R 75.0%
- 2008→2024 swing
- -19.2pp toward R · 2008: -31.4pp · 2024: -50.6pp
- All cycles
- 2024: R+50.6 2020: R+45.6 2016: R+43.9 2012: R+34.6 2008: R+31.4
Not yet ingested
- Civics
- —
Market trends
- HPI YoY
- ▲ 0.84%
- Current HPI
- 103.4043
- Rent YoY
- —
- Metro
- —
- State GDP YoY
- ▲ 3.95%
- F500 in state
- 110
Industry mix (Fortune 500 HQ in TX)
| Industry | F500 HQs | Revenue |
|---|---|---|
| Energy | 16 | $1,198B |
|
||
| Technology | 5 | $198B |
|
||
| Engineering / Construction | 4 | $72B |
|
||
| Energy Services | 3 | $60B |
|
||
| Utilities | 3 | $41B |
|
||
| Healthcare | 2 | $330B |
|
||
Price history
+0.1% since first listed5 events — show timeline
- 2025-12-15 Listed $105,000 LAAR
- 2025-06-17 Price Changed $104,000 LAAR
- 2025-04-26 Listed $109,000 LAAR
- 2024-06-27 Price Changed $99,888 LAAR
- 2024-06-04 Listed $104,888 LAAR
Cash-flow waterfall
monthlySold comps — $/sqft
last 12 mo · ≤1 miLoading sold comps…