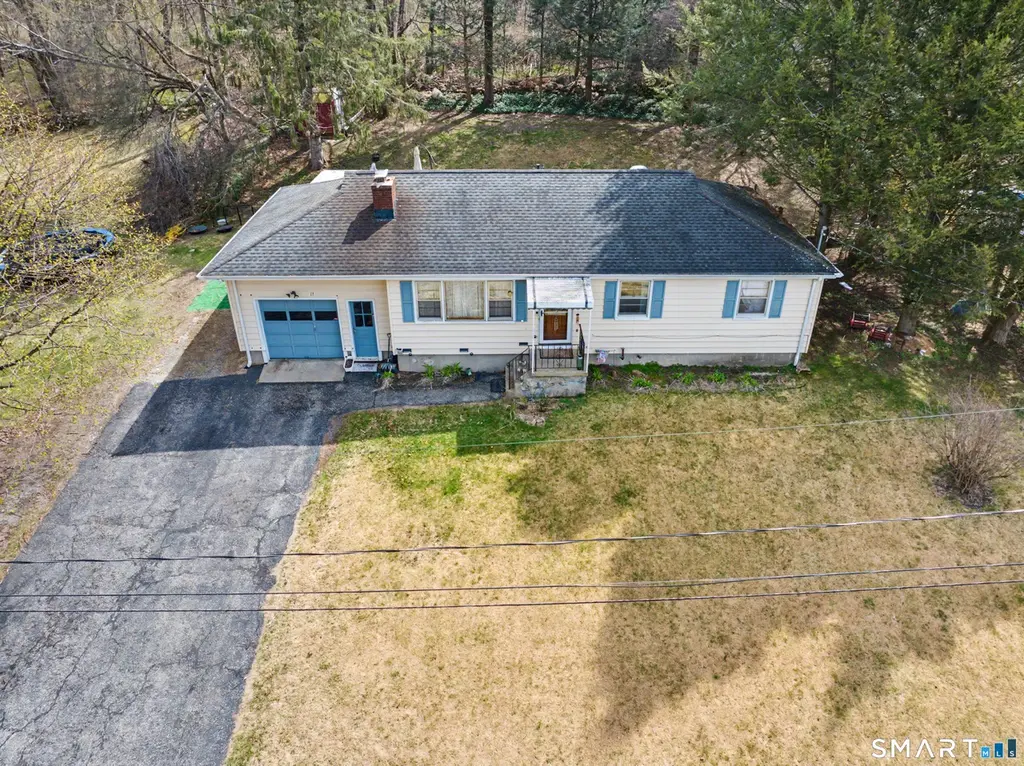
11 Clearview Dr · New Milford, CT
Flood risk 1/10 · Minimal
- FEMA flood zone
- X
- Chance of flooding over 30 yrs
- 0.0%
- Est. flood insurance / yr
- $473 – $860
Fire risk 3/10 · Minor
- Est. fire insurance / yr
- $829 – $1,539
Heat risk 4/10 · Minor
- Hot days now (above 96°F)
- 7 days/yr
- Hot days in 30 yrs
- 15 days/yr
Wind risk 4/10 · Minor
- Chance of severe wind over 30 yrs
- 18.0%
Air-quality risk 3/10 · Minor
- Unhealthy air days now
- 2 days/yr
- Unhealthy air days in 30 yrs
- 3 days/yr
Risk factors via First Street. Map © Google.
Why this score? — see what drove the D grade
The composite is a weighted blend of 9 inputs, each scored 0–100. Each bar is that input's sub-score; the figure is the points it added to the 100-point composite (weight × sub-score).
- ARV discount +15.0/15.0
- Cash flow +8.6/30.0
- Livability +4.3/5.0
- Schools +3.6/10.0
- Rent growth +2.5/5.0
- Condition / age +2.5/5.0
- 1% rule +2.3/10.0
- DSCR +2.3/10.0
- Appreciation +0.0/10.0
$375,000
🖨 Deal sheet 📄 Offer letter ✓ Due diligence
Listing remarks MLS
Welcome to this charming 3-bedroom ranch offering a great opportunity for homeowners and investors alike. Priced at its appraised value, this property presents excellent potential in today's market. The home features a functional single-level layout with three comfortable bedrooms and a full bathroom. An unfinished basement provides additional space for storage or future customization. Situated on a nice lot, the property also includes a backyard-ideal for outdoor use, gardening, or entertaining.
Key facts
- 0.31 acre lot
- Garage
- Built 1955
Neighborhood map
What this means for you Summary
Snapshot
- This is a 3-bed/1.0-bath single-family listed at $375k.
Deal economics
- At list price, monthly cash flow is $-326 ($-4k/yr) — negative.
- To cash-flow at today's rent, offer at most $317k (15.3% below list).
- To meet the 1% rule (rent ≥ 1% of price), the offer needs to be $275k (26.6% below list).
- Recommended offer: $275k (26.6% below list) — sets the bar for 1% rule.
- Cap rate 5.3% vs local median 3.6% in New Milford — top-decile yield for the area; either an underpriced asset or a hidden risk that comps aren't pricing in. Stress-test before assuming the spread holds.
Location & tenants
- Location reads 86/100 on livability (#2 in CT, #371 nationally) — a professional / high-income tenant draw. Strengths: crime A+, commute A+, housing A+; Watch: cost of living C-, amenities D-.
- New Milford School District (suburban): math 29% / reading 47% proficiency, ranked #100 of 153 in CT (top 65%) — families likely to look elsewhere, expect single-tenant / working-renter base with shorter leases; only 15% free/reduced lunch — higher-income household profile.
- Market conditions: 147 active listings in the ZIP; 1 comparable units currently listed for rent nearby; solid renter incomes; 1,151 units permitted in Western Connecticut Planning Region in 2024 (714 in 5+ unit buildings).
- This rent runs 32% of the median local income ($104k/yr) — at the standard rent-burdened threshold; future hikes will face affordability resistance.
Forward outlook
- Local home prices are declining (-3.0%/yr); year-one equity from $3k of loan paydown is wiped out by about $11k of value loss. Plan a longer hold.
Negotiation context
- It's been on market 57 days — a 3% lower offer ($364k) is reasonable based on typical stale-listing flexibility.
- 3 sale attempts since 25y ago with the ask held roughly flat each time — persistent listings suggest the price (not the market) is what's stuck; bring a comps-based counter.
- Current owner paid $255k; 47% above their basis — modest negotiation headroom, anchor on the comps not their cost.
Risks & watch-outs
- Watch-outs: built in 1955 — expect roof / HVAC / electrical / plumbing capex.
Questions for the listing agent
- What do current leases actually rent for vs. the listed asking? Can we see a recent rent roll and the last 12 months of T-12 income?
- It's been on market 57 days. Have you received any prior offers? Is the seller open to a 27% concession, seller financing, or rate buy-down credit?
- Built in 1955 — when were the roof, HVAC, electrical panel, plumbing, and water heater last replaced?
- Is there a deadline driving the sale (1031 exchange, divorce, estate, relocation)? That informs how much negotiation room exists.
- The area grade is low — what's the realistic commute time and amenity access for the typical tenant pool here? Any planned neighborhood developments (good or bad) we should know about?
- What's the average days-on-market for RENTAL listings here right now (not sales)? A rising rental-DOM trend means longer vacancies and softer asking-rent achievability than the comps imply.
- What's the recent tenant-quality profile in this submarket — average credit score on applications, eviction rate, late-payment / NSF rate, and stable-employment percentage? A property-management company in the area should have these aggregated.
- How much new for-sale + rental construction is in the pipeline within 1–3 miles? Heavy new supply typically softens prices + rents 12–24 months out; constrained supply supports both.
Investment metrics
- 1% rule
- 0.73% ✗
- Cap rate
- 5.25%
- Cash-on-cash
- -3.72%
- DSCR
- 0.83
- GRM
- 11.4
CMA / ARV
- ARV (median comp)
- $481,397
- List price
- $375,000
- Delta
- -22.10%
- Verdict
- UNDERPRICED
- Comps
- 12 within 1.0 mi
Show comp detail 2 sales within ~0.75 mi
| Address | Dist | Beds/Ba | Sqft | Sold | Price | $/sf | Match |
|---|---|---|---|---|---|---|---|
| 40 Mount Tom Rd | 0.37mi | 3/2.5 | 1,236 (-5%) | 6mo | $485,000 | $392 | 63 |
| 7 Mount Tom Rd | 0.24mi | 3/1.0 | 1,140 (-13%) | 6mo | $210,000 | $184 | 62 |
Match score weights: distance 35% · size 25% · config 20% · recency 20%. Top-matched comps best support the ARV.
Projected returns pro-forma
-3.0% appreciation · 3.0% rent growth · sell at horizon
- IRR
- -22.6%
- Equity multiple
- 0.22×
- Total profit
- $-81,519
- Equity at exit
- $55,914
- IRR
- -16.8%
- Equity multiple
- 0.07×
- Total profit
- $-97,750
- Equity at exit
- $32,423
Cash invested: $105,000 (down + closing). Projections, not guarantees.
Landlord ↔ Tenant lean methodology
- Overall (STATE)
- 27 Tenant-Leaning
- State Connecticut
- 27 Tenant-Leaning · D+7
- County
- — inherits STATE
- City
- — inherits STATE
ZIP-level market 06776
- Active inventory
- 147
- Price-to-rent
- 11.4×
Monthly cashflow live
- Estimated rent
- $2,751 medium interval (Pro) →
- Mortgage (P&I)
- −$1,967
- Tax from tax record
- −$376 /mo · $4,514/yr
- Insurance
- −$156
- HOA
- −$0
- Vacancy / Maint / Mgmt
- −$578
- Net cashflow
- $-326
Break-even live
UW: 25.0% down · 7.5% · 30yr · 1.5% tax · 5.0% vac · 8.0% maint · 8.0% mgmt
Financing live
Cash to close
- Down payment
- $93,750
- Closing costs
- $11,250
- Reserves months
- —
- Total cash needed
- —
Loan-product check · same deal, 3 products live
Conventional
25% down · 7.5% · 30yr
- Down + closing
- —
- Monthly P&I
- —
- Monthly cashflow
- —
- DSCR
- —
- Eligible?
- —
Personal DTI + credit; lowest rate.
DSCR
20% down · 8.5% · 30yr
- Down + closing
- —
- Monthly P&I
- —
- Monthly cashflow
- —
- DSCR
- —
- Eligible?
- —
No personal income docs; deal must DSCR.
Hard money
10% down · 12.0% · 12mo
- Down + closing
- —
- Monthly P&I
- —
- Monthly cashflow
- —
- DSCR
- —
- Eligible?
- —
Short-term bridge; refi at stabilization.
Rent comps 1 comps
| Address | Beds | Baths | Sqft | Rent | $/sqft | DOM | Units | Dist |
|---|---|---|---|---|---|---|---|---|
| 2 Clara Ln New Milford, CT | 2.0 | 1.0 | 1280 | $3,300 | $2.58 | 43d | 1 | 1.06mi |
Listing history 25 events
-
2026-06-19days on market $375,000 Active 57 DOM
-
2026-06-18days on market $375,000 Active 56 DOM
-
2026-06-17days on market $375,000 Active 55 DOM
-
2026-06-16days on market $375,000 Active 54 DOM
-
2026-06-15days on market $375,000 Active 53 DOM
-
2026-06-14days on market $375,000 Active 51 DOM
-
2026-06-13remarks 551-char remark
-
2026-06-13days on market $375,000 Active 50 DOM
-
2026-06-10statusdays on market $375,000 Active 48 DOM
-
2026-06-03statusdays on market $375,000 Under Contract 47 DOM
-
2026-06-02days on market $375,000 Active 46 DOM
-
2026-06-01days on market $375,000 Active 45 DOM
-
2026-05-31days on market $375,000 Active 44 DOM
-
2026-05-30days on market $375,000 Active 43 DOM
-
2026-04-18$385,000 Active 503-char remark
Show marketing remark (503 chars)
Welcome to this charming 3-bedroom ranch offering a great opportunity for homeowners and investors alike. Priced at its appraised value, this property presents excellent potential in today's market. The home features a functional single-level layout with three comfortable bedrooms and a full bathroom. An unfinished basement provides additional space for storage or future customization. Situated on a nice lot, the property also includes a backyard-ideal for outdoor use, gardening, or entertaining.
-
2026-04-16historical $385,000 503-char remark
Show marketing remark (503 chars)
Welcome to this charming 3-bedroom ranch offering a great opportunity for homeowners and investors alike. Priced at its appraised value, this property presents excellent potential in today's market. The home features a functional single-level layout with three comfortable bedrooms and a full bathroom. An unfinished basement provides additional space for storage or future customization. Situated on a nice lot, the property also includes a backyard-ideal for outdoor use, gardening, or entertaining.
-
2021-05-25soldstatus $255,000
-
2021-05-21soldstatus $255,000 Closed 747-char remark
Show marketing remark (747 chars)
Lovingly cared for, this delightful Ranch brings the ease of one level living and the potential for updates to express your signature style. The living room, dining room, sunroom and kitchen provide ample space and great flow for entertaining. 3 bedrooms and 1 full bath complete the main level. The unfinished basement is a canvas for many possibilities. A level backyard adds private, outdoor living space to enjoy. Home includes generator hook up and security system. Set amid the quiet hills of northern New Milford, there are endless opportunities for outdoor recreation and scenic drives. Nearby locations include Lake Waramaug, Kent Falls, Mt Tom State Park, as well as the picturesque Village Green & quaint town center of New Milford.
-
2021-01-23historical Under Contract - Continue to Show 747-char remark
Show marketing remark (747 chars)
Lovingly cared for, this delightful Ranch brings the ease of one level living and the potential for updates to express your signature style. The living room, dining room, sunroom and kitchen provide ample space and great flow for entertaining. 3 bedrooms and 1 full bath complete the main level. The unfinished basement is a canvas for many possibilities. A level backyard adds private, outdoor living space to enjoy. Home includes generator hook up and security system. Set amid the quiet hills of northern New Milford, there are endless opportunities for outdoor recreation and scenic drives. Nearby locations include Lake Waramaug, Kent Falls, Mt Tom State Park, as well as the picturesque Village Green & quaint town center of New Milford.
-
2021-01-11$250,000 Active 747-char remark
Show marketing remark (747 chars)
Lovingly cared for, this delightful Ranch brings the ease of one level living and the potential for updates to express your signature style. The living room, dining room, sunroom and kitchen provide ample space and great flow for entertaining. 3 bedrooms and 1 full bath complete the main level. The unfinished basement is a canvas for many possibilities. A level backyard adds private, outdoor living space to enjoy. Home includes generator hook up and security system. Set amid the quiet hills of northern New Milford, there are endless opportunities for outdoor recreation and scenic drives. Nearby locations include Lake Waramaug, Kent Falls, Mt Tom State Park, as well as the picturesque Village Green & quaint town center of New Milford.
-
2001-07-02soldstatus $182,500
-
2001-06-28soldstatus $182,500
-
2001-04-13$182,500
-
1993-01-04soldstatus $136,900
-
1987-05-22soldstatus $159,000
ⓘ Source: listings_history table (triggers on properties + properties_extension) + one-shot
backfill from property_details.listing_events for pre-trigger history.
Tax reassessment forecast CT · Partial reset (capped growth)
- Current annual tax
- $4,514 · $376/mo
- Projected year-2 tax
- $6,270 · $522/mo
- Expected delta
- +$1,756/yr (+$146/mo · 38.9%)
ⓘ Screening estimate from a state-policy table — verify with the county assessor before closing.
Climate risk First Street
- Flood 1/10 Low FEMA zone X · 0% chance over 30 yrs
- Wildfire 3/10 Moderate
- Heat 4/10 Moderate 7 d/yr ≥96°F today · 15 d/yr by 30 yrs out
- Wind 4/10 Moderate 18% chance of damaging wind over 30 yrs
- Air quality 3/10 Moderate 2 unhealthy d/yr today · 3 by 30 yrs out
Nearby sold comps map
Loading sold comps map…
Walkable amenities ~0.75 mi
Loading nearby amenities…
Taxation est. · year 1
- Rental income
- $33,013
- − Mortgage interest
- −$21,006
- − Property taxes
- −$4,514
- − Insurance
- −$1,875
- − Repairs & maintenance
- −$2,641
- − Management
- −$2,641
- − Depreciation
- −$10,909
- Taxable loss
- −$10,573
- Est. tax savings @ 24.0%
- +$2,538
- After-tax cash flow
- $-1,370/yr
For passive investors: Depreciation is non-cash, so a rental often shows a tax loss while cash-flowing — sheltering income. Rental losses are passive: they offset passive income freely, and up to $25,000/yr can offset ordinary (W-2) income if you actively participate and your MAGI is under $100k (phasing out to $0 by $150k); unused losses carry forward. On sale, claimed depreciation is recaptured at up to 25%, and gains may owe capital-gains tax (a 1031 exchange can defer both). Figures are a year-1 estimate at your 24.0% rate — not tax advice; consult a CPA.
Schools (NCES district)
- District
- New Milford School District
- NCES district ID
- 0902850
- Math proficiency
- 29% ▼ -22.00%
- Reading proficiency
- 47% ▼ -11.00%
- Median HH income
- $81,576
- Composite
- 35.78/100
- National rank
- #4839
- State rank
- #100 of 153 in CT
Livability — New Milford
- Score
- 86/100
- State rank
- #2
- US rank
- #371
Category grades
Schools grade is shown separately in the Schools card above.
Census & demographics
- County
- Litchfield County · 81,203 people
- City population
- 27,010
- Metro
- Torrington, CT
- Population (ZIP)
- 27,010
- Household income
- $104,112
- Rent vs Own
- Severe rent burden
- 627.0
Population outlook (Western Connecticut County) Hauer SSP2
- By 2040
- 685,031
Race, ethnicity, and origin ACS 2023
- Neighborhood character
- Predominantly White (77%)
- Race & ethnicity
- White 77% Hispanic / Latino 12% Two or more races 7% Black 4% Asian 4%
- Hispanic origin (detail)
- Puerto Rican 4% Dominican 2%
- Common ancestry
- Romanian 4% Lithuanian 3% Italian 2%
- Foreign-born
- 12% · Canada, China
- Languages at home
- 86% English-only · Spanish 6% Other Indo-European 3% Chinese 1%
Political lean MEDSL · Western Connecticut
- 2024 margin
- D (+19.1) · D 58.8% · R 39.7% · Other 1.6%
- All cycles
- 2024: D+19.1
Not yet ingested
- Civics
- —
Market trends
- HPI YoY
- ▼ -264.52%
- Current HPI
- 305.6036
- Rent YoY
- —
- Metro
- Torrington, CT
- State GDP YoY
- ▲ 1.06%
- F500 in state
- 38
Industry mix (Fortune 500 HQ in CT)
| Industry | F500 HQs | Revenue |
|---|---|---|
| Industrial Machinery | 4 | $38B |
|
||
| Insurance | 3 | $71B |
|
||
| Financial Services | 2 | $25B |
|
||
| Transportation / Logistics | 2 | $18B |
|
||
| Healthcare | 1 | $247B |
|
||
| Telecommunications | 1 | $55B |
|
||
Price history
+142.1% since first listed11 events — show timeline
- 2026-04-18 Listed $385,000 Smart MLS
- 2026-04-16 Coming Soon $385,000 Smart MLS
- 2021-05-25 Sold (Public Records) $255,000 Public Records
- 2021-05-21 Sold (MLS) $255,000 Smart MLS
- 2021-01-23 Contingent — Smart MLS
- 2021-01-11 Listed $250,000 Smart MLS
- 2001-07-02 Sold (Public Records) $182,500 Public Records
- 2001-06-28 Sold (MLS) $182,500 Smart MLS
- 2001-04-13 Listed $182,500 Smart MLS
- 1993-01-04 Sold (Public Records) $136,900 Public Records
- 1987-05-22 Sold (Public Records) $159,000 Public Records
Property tax history
+2.0%/yrLatest (2023): $4,514 · +2.2% YoY. Source: county tax records.
Cash-flow waterfall
monthlySold comps — $/sqft
last 12 mo · ≤1 miLoading sold comps…