 Fourplex
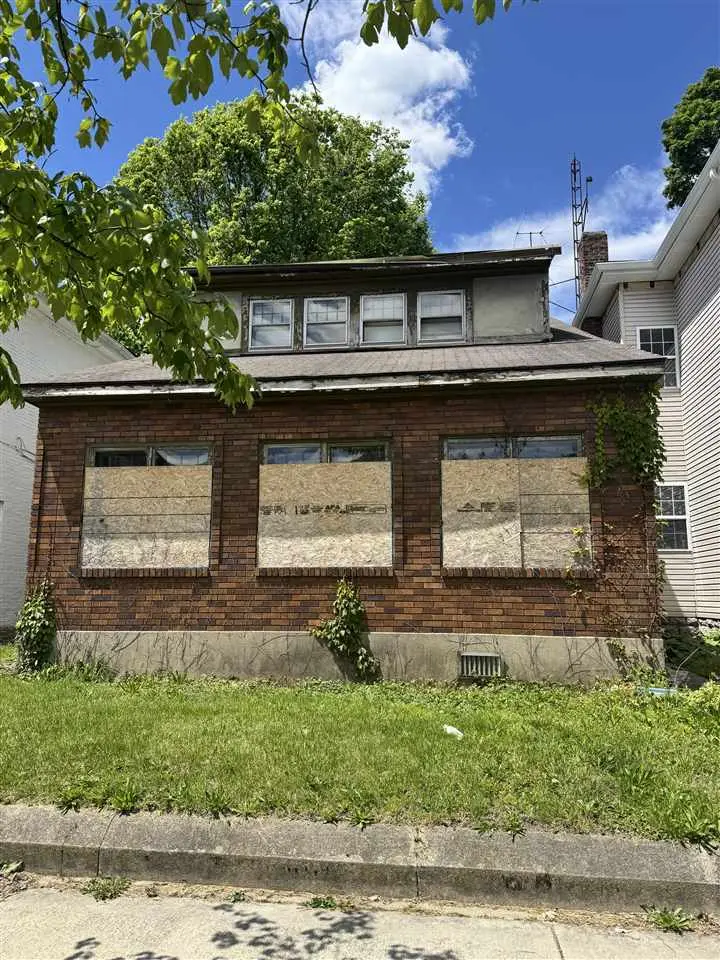
122 S 12th St · Richmond, IN
Flood risk 1/10 · Minimal
- FEMA flood zone
- X (unshaded)
- Chance of flooding over 30 yrs
- 0.0%
- Est. flood insurance / yr
- $473 – $860
Fire risk 1/10 · Minimal
- Est. fire insurance / yr
- $717 – $1,331
Heat risk 3/10 · Minor
- Hot days now (above 100°F)
- 7 days/yr
- Hot days in 30 yrs
- 18 days/yr
Wind risk 2/10 · Minimal
- Chance of severe wind over 30 yrs
- 1.0%
Air-quality risk 3/10 · Minor
- Unhealthy air days now
- 2 days/yr
- Unhealthy air days in 30 yrs
- 3 days/yr
Risk factors via First Street. Map © Google.
Why this score? — see what drove the D grade
The composite is a weighted blend of 9 inputs, each scored 0–100. Each bar is that input's sub-score; the figure is the points it added to the 100-point composite (weight × sub-score).
- Cash flow +15.0/30.0
- ARV discount +7.5/15.0
- 1% rule +5.0/10.0
- DSCR +5.0/10.0
- Livability +4.2/5.0
- Rent growth +2.5/5.0
- Condition / age +2.5/5.0
- Schools +1.9/10.0
- Appreciation +0.0/10.0
$28,500
🖨 Deal sheet 📄 Offer letter ✓ Due diligence
Multi-family units
County records classify this as Multi-Family (5+ Unit). Listing-text estimate: 4 units. estimate disagrees with records
5+ unit building — per-unit beds/baths from public records are typically unavailable; the breakdown below (if shown) is an estimate from the listing text.
Listing remarks MLS
Fantastic Investment Opportunity in Historic Richmond! This triplex in the historic community of Richmond is a great investment opportunity for those looking to capitalize on a fixer-upper. The property requires a complete rehab, with the back apartment needing the most work. The upstairs apartment and the other downstairs unit are solid structures that will require less extensive renovations. With the potential for high returns, this property is perfect for investors ready to bring this historic gem back to life. Don't miss out on this promising opportunity!
Key facts
- 5,793 sq ft lot
- Built 1920
- Listed 18 days
Property features AI
Exterior
- Home design: Residential income property (quadruplex); 2 stories
- Exterior features: Shingle roof
Interior
- Interior features: Basement
Neighborhood map
What this means for you Summary
Snapshot
- This is a 4 × 1-bed/1-bath units multifamily listed at $28k.
Deal economics
- At list price, monthly cash flow is $2k ($27k/yr) — positive. Per door: $564/mo.
- The deal already cash-flows at list — no discount required.
- Meets the 1% rule at list price ($3k rent vs $28k).
- Recommended offer: $28k (1.5% below list) — sets the bar for market timing.
- Cap rate 101.3% vs local median 5.2% in Richmond — top-decile yield for the area; either an underpriced asset or a hidden risk that comps aren't pricing in. Stress-test before assuming the spread holds.
Location & tenants
- Location reads 83/100 on livability (#10 in IN, #869 nationally) — a professional / high-income tenant draw. Strengths: commute A+, cost of living A+, housing A+; Watch: crime D+, schools D-, employment D-.
- Richmond Community Schools (town): math 18% / reading 27% proficiency, ranked #270 of 301 in IN (top 90%) — low school quality limits family demand, transient renter base, plan for 1-2y turnover; 65% free/reduced lunch — lower-income household profile, screen leases tightly.
- Market conditions: 273 active listings in the ZIP; 38 units permitted in Wayne County in 2024 (0 in 5+ unit buildings).
- At $3,108/mo this rent would consume 73% of the median local household income ($51k/yr) (locally 1600% of renters already pay >50% of income on rent) — very limited rent-growth headroom before tenants either downsize or default.
Forward outlook
- Local home prices are declining (-3.0%/yr); year-one equity from $197 of loan paydown is wiped out by about $855 of value loss. Plan a longer hold.
- Wayne County population projected at -21% by 2050 — secular population decline; favor cash flow + early exit over multi-decade hold.
- At projected returns (-3.0% appreciation + 3.0% rent growth), your $8k cash investment doubles in ~1 year — after that, you're playing with house money.
Negotiation context
- It's been on market 18 days — a 2% lower offer ($28k) is reasonable based on typical stale-listing flexibility.
- 6 sale attempts since 6y ago; this cycle's ask has dropped $6k (19%) from the opening price — seller is motivated, your offer sets the floor, not the list.
- Current owner paid $15k; list at $28k implies a 90% gain — meaningful room to come down on a strong offer.
Risks & watch-outs
- Watch-outs: built in 1920 — expect roof / HVAC / electrical / plumbing capex.
Questions for the listing agent
- Can we see the unit-by-unit rent roll, current vacancy, and any below-market leases? What's the average tenancy length?
- What capital expenditures (roof, boiler, parking lot, exteriors) have been made in the last 5 years, and what's planned in the next 2?
- Built in 1920 — when were the roof, HVAC, electrical panel, plumbing, and water heater last replaced?
- Is there a deadline driving the sale (1031 exchange, divorce, estate, relocation)? That informs how much negotiation room exists.
- Schools are D-rated, which usually means shorter tenancies and higher turnover. Who's the typical renter profile here, and what's been the actual vacancy rate?
- Crime grade is D in this area — have there been break-ins, vandalism, or insurance claims at this property in the last 3 years? What carrier currently insures it and at what premium?
- The area grade is low — what's the realistic commute time and amenity access for the typical tenant pool here? Any planned neighborhood developments (good or bad) we should know about?
- What's the average days-on-market for RENTAL listings here right now (not sales)? A rising rental-DOM trend means longer vacancies and softer asking-rent achievability than the comps imply.
- What's the recent tenant-quality profile in this submarket — average credit score on applications, eviction rate, late-payment / NSF rate, and stable-employment percentage? A property-management company in the area should have these aggregated.
- How much new apartment / multifamily construction is in the pipeline within 1–3 miles? Heavy new supply (>2% of stock underway) typically softens rents 12–24 months out; light construction supports rent growth.
Investment metrics
- 1% rule
- 10.91% ✓
- Cap rate
- 101.30%
- Cash-on-cash
- 339.32%
- DSCR
- 16.10
- GRM
- 0.8
CMA / ARV
- ARV (on-the-fly)
- $84,644
- Comps found
- 5
Show comp detail 5 sales within ~0.75 mi
| Address | Dist | Beds/Ba | Sqft | Sold | Price | $/sf | Match |
|---|---|---|---|---|---|---|---|
| 300 S 7th St | 0.39mi | 4/4.0 | 3,031 (+0%) | 16mo | $85,000 | $28 | 68 |
| 116 S 14th St | 0.16mi | 4/1.0 | 2,780 (-8%) | 7mo | $80,000 | $29 | 61 |
| 54 S 16th St | 0.32mi | 4/4.0 | 2,656 (-12%) | 15mo | $59,900 | $23 | 53 |
| 305-307 S 8th St | 0.30mi | 4/2.0 | 2,722 (-10%) | 21mo | $35,000 | $13 | 44 |
| 805 S 7th St | 0.70mi | 4/2.0 | 2,664 (-12%) | 5mo | $79,500 | $30 | 36 |
Match score weights: distance 35% · size 25% · config 20% · recency 20%. Top-matched comps best support the ARV.
Projected returns pro-forma
-3.0% appreciation · 3.0% rent growth · sell at horizon
- IRR
- —
- Equity multiple
- 18.44×
- Total profit
- $139,147
- Equity at exit
- $4,249
- IRR
- —
- Equity multiple
- 39.40×
- Total profit
- $306,420
- Equity at exit
- $2,464
Cash invested: $7,980 (down + closing). Projections, not guarantees.
Landlord ↔ Tenant lean methodology
- Overall (STATE)
- 90 Strongly Landlord-Friendly
- State Indiana
- 90 Strongly Landlord-Friendly · R+11
- County
- — inherits STATE
- City
- — inherits STATE
ZIP-level market 47374
- Active inventory
- 273
- Price-to-rent
- 3.1×
Monthly cashflow live
- Estimated rent
- $3,108 medium interval (Pro) →
- Mortgage (P&I)
- −$149
- Tax from tax record
- −$38 /mo · $450/yr
- Insurance
- −$12
- HOA
- −$0
- Vacancy / Maint / Mgmt
- −$653
- Net cashflow
- $2,256
Break-even live
4-unit breakdown (identical units grouped — click to expand)
| Units | Beds | Baths | Est. rent |
|---|---|---|---|
| 4× units | 1 | 1 | $3,108 |
| #1 | 1 | 1 | $777 |
| #2 | 1 | 1 | $777 |
| #3 | 1 | 1 | $777 |
| #4 | 1 | 1 | $777 |
| Total (4 units) | $3,108 | ||
UW: 25.0% down · 7.5% · 30yr · 1.5% tax · 5.0% vac · 8.0% maint · 8.0% mgmt
Financing live
Cash to close
- Down payment
- $7,125
- Closing costs
- $855
- Reserves months
- —
- Total cash needed
- —
Loan-product check · same deal, 3 products live
Conventional
25% down · 7.5% · 30yr
- Down + closing
- —
- Monthly P&I
- —
- Monthly cashflow
- —
- DSCR
- —
- Eligible?
- —
Personal DTI + credit; lowest rate.
DSCR
20% down · 8.5% · 30yr
- Down + closing
- —
- Monthly P&I
- —
- Monthly cashflow
- —
- DSCR
- —
- Eligible?
- —
No personal income docs; deal must DSCR.
Hard money
10% down · 12.0% · 12mo
- Down + closing
- —
- Monthly P&I
- —
- Monthly cashflow
- —
- DSCR
- —
- Eligible?
- —
Short-term bridge; refi at stabilization.
Listing history 18 events
-
2026-05-31status $28,500 Pending 18 DOM
-
2026-05-30days on market $28,500 Active 18 DOM
-
2026-05-20price $28,500
-
2026-05-12$35,000 Active
-
2025-03-19soldstatus $15,000 Closed 566-char remark
Show marketing remark (566 chars)
Fantastic Investment Opportunity in Historic Richmond! This triplex in the historic community of Richmond is a great investment opportunity for those looking to capitalize on a fixer-upper. The property requires a complete rehab, with the back apartment needing the most work. The upstairs apartment and the other downstairs unit are solid structures that will require less extensive renovations. With the potential for high returns, this property is perfect for investors ready to bring this historic gem back to life. Don't miss out on this promising opportunity!
-
2025-02-28status Pending 566-char remark
Show marketing remark (566 chars)
Fantastic Investment Opportunity in Historic Richmond! This triplex in the historic community of Richmond is a great investment opportunity for those looking to capitalize on a fixer-upper. The property requires a complete rehab, with the back apartment needing the most work. The upstairs apartment and the other downstairs unit are solid structures that will require less extensive renovations. With the potential for high returns, this property is perfect for investors ready to bring this historic gem back to life. Don't miss out on this promising opportunity!
-
2025-02-19status Active 566-char remark
Show marketing remark (566 chars)
Fantastic Investment Opportunity in Historic Richmond! This triplex in the historic community of Richmond is a great investment opportunity for those looking to capitalize on a fixer-upper. The property requires a complete rehab, with the back apartment needing the most work. The upstairs apartment and the other downstairs unit are solid structures that will require less extensive renovations. With the potential for high returns, this property is perfect for investors ready to bring this historic gem back to life. Don't miss out on this promising opportunity!
-
2025-01-30status Pending 566-char remark
Show marketing remark (566 chars)
Fantastic Investment Opportunity in Historic Richmond! This triplex in the historic community of Richmond is a great investment opportunity for those looking to capitalize on a fixer-upper. The property requires a complete rehab, with the back apartment needing the most work. The upstairs apartment and the other downstairs unit are solid structures that will require less extensive renovations. With the potential for high returns, this property is perfect for investors ready to bring this historic gem back to life. Don't miss out on this promising opportunity!
-
2025-01-27$18,000 Active 566-char remark
Show marketing remark (566 chars)
Fantastic Investment Opportunity in Historic Richmond! This triplex in the historic community of Richmond is a great investment opportunity for those looking to capitalize on a fixer-upper. The property requires a complete rehab, with the back apartment needing the most work. The upstairs apartment and the other downstairs unit are solid structures that will require less extensive renovations. With the potential for high returns, this property is perfect for investors ready to bring this historic gem back to life. Don't miss out on this promising opportunity!
-
2025-01-14historical
-
2024-11-15status Active
-
2024-10-25status Pending
-
2024-10-21price $24,000
-
2024-09-07price $39,000
-
2024-08-08price $50,000
-
2024-07-14$55,000 Active
-
2020-10-15soldstatus $17,000
-
2020-08-28$27,500
ⓘ Source: listings_history table (triggers on properties + properties_extension) + one-shot
backfill from property_details.listing_events for pre-trigger history.
Tax reassessment forecast IN · Partial reset (capped growth)
- Current annual tax
- $450 · $38/mo
- Projected year-2 tax
- $450 · $38/mo
- Expected delta
- $0/yr ($0/mo · 0.0%)
ⓘ Screening estimate from a state-policy table — verify with the county assessor before closing.
Climate risk First Street
- Flood 1/10 Low FEMA zone X (unshaded) · 0% chance over 30 yrs
- Wildfire 1/10 Low
- Heat 3/10 Moderate 7 d/yr ≥100°F today · 18 d/yr by 30 yrs out
- Wind 2/10 Low 100% chance of damaging wind over 30 yrs
- Air quality 3/10 Moderate 2 unhealthy d/yr today · 3 by 30 yrs out
Nearby sold comps map
Loading sold comps map…
Walkable amenities ~0.75 mi
Loading nearby amenities…
Taxation est. · year 1
- Rental income
- $37,296
- − Mortgage interest
- −$1,596
- − Property taxes
- −$450
- − Insurance
- −$142
- − Repairs & maintenance
- −$2,984
- − Management
- −$2,984
- − Depreciation
- −$829
- Taxable income
- $28,311
- Est. tax owed @ 24.0%
- −$6,795
- After-tax cash flow
- $20,283/yr
For passive investors: Depreciation is non-cash, so a rental often shows a tax loss while cash-flowing — sheltering income. Rental losses are passive: they offset passive income freely, and up to $25,000/yr can offset ordinary (W-2) income if you actively participate and your MAGI is under $100k (phasing out to $0 by $150k); unused losses carry forward. On sale, claimed depreciation is recaptured at up to 25%, and gains may owe capital-gains tax (a 1031 exchange can defer both). Figures are a year-1 estimate at your 24.0% rate — not tax advice; consult a CPA.
Schools (NCES district)
- District
- Richmond Community Schools
- NCES district ID
- 1809510
- Math proficiency
- 18% ▼ -7.00%
- Reading proficiency
- 27% ▼ -2.00%
- Median HH income
- $35,288
- Composite
- 18.55/100
- National rank
- #8913
- State rank
- #270 of 301 in IN
Livability — Richmond
- Score
- 83/100
- State rank
- #10
- US rank
- #869
Category grades
Schools grade is shown separately in the Schools card above.
Census & demographics
- Census place
- Richmond, IN
- County
- Wayne County · 44,615 people
- City population
- 44,615
- Metro
- Richmond, IN
- Population (ZIP)
- 44,615
- Household income
- $50,766
- Rent vs Own
- Severe rent burden
- 1600.0
Population outlook (Wayne County) Hauer SSP2
- Today (2025)
- 63,316 people
- By 2030
- 60,893 · -3.8%
- By 2040
- 55,386 · -12.5%
- By 2050
- 49,946 · -21.1%
- By 2075
- 37,900 · -40.1%
- By 2100
- 26,562 · -58.0%
Race, ethnicity, and origin ACS 2023
- Neighborhood character
- Predominantly White (82%)
- Race & ethnicity
- White 82% Two or more races 7% Black 6% Hispanic / Latino 4% Asian 1%
- Common ancestry
- Slovak 2% Italian 1% Lithuanian 1%
- Foreign-born
- 4% · Canada, China
- Languages at home
- 95% English-only · Spanish 3%
Political lean MEDSL · Wayne
- 2024 margin
- Solid R (+32.5) · D 32.9% · R 65.4% · Other 1.6%
- 2008→2024 swing
- -28.6pp toward R · 2008: -3.9pp · 2024: -32.5pp
- All cycles
- 2024: R+32.5 2020: R+29.1 2016: R+30.1 2012: R+14.7 2008: R+3.9
Not yet ingested
- Civics
- —
Market trends
- HPI YoY
- ▼ -118.64%
- Current HPI
- 182.5038
- Rent YoY
- —
- Metro
- Richmond, IN
- State GDP YoY
- ▲ 2.90%
- F500 in state
- 18
Industry mix (Fortune 500 HQ in IN)
| Industry | F500 HQs | Revenue |
|---|---|---|
| Industrial Machinery | 2 | $37B |
|
||
| Healthcare | 1 | $177B |
|
||
| Pharmaceuticals | 1 | $45B |
|
||
| Metals / Steel | 1 | $18B |
|
||
| Agriculture | 1 | $17B |
|
||
| Packaging | 1 | $12B |
|
||
Price history
+3.6% since first listed16 events — show timeline
- 2026-05-20 Price Changed $28,500 RRELMS
- 2026-05-12 Listed $35,000 RRELMS
- 2025-03-19 Sold (MLS) $15,000 MIBOR as Distributed by MLS Grid
- 2025-02-28 Pending — MIBOR as Distributed by MLS Grid
- 2025-02-19 Relisted — MIBOR as Distributed by MLS Grid
- 2025-01-30 Pending — MIBOR as Distributed by MLS Grid
- 2025-01-27 Listed $18,000 MIBOR as Distributed by MLS Grid
- 2025-01-14 Listing Removed — MIBOR as Distributed by MLS Grid
- 2024-11-15 Relisted — MIBOR as Distributed by MLS Grid
- 2024-10-25 Pending — MIBOR as Distributed by MLS Grid
- 2024-10-21 Price Changed $24,000 MIBOR as Distributed by MLS Grid
- 2024-09-07 Price Changed $39,000 MIBOR as Distributed by MLS Grid
- 2024-08-08 Price Changed $50,000 MIBOR as Distributed by MLS Grid
- 2024-07-14 Listed $55,000 MIBOR as Distributed by MLS Grid
- 2020-10-15 Sold (MLS) $17,000 RRELMS
- 2020-08-28 Listed $27,500 RRELMS
Property tax history
-9.6%/yrLatest (2024): $450 · -33.9% YoY. Source: county tax records.
Cash-flow waterfall
monthlySold comps — $/sqft
last 12 mo · ≤1 miLoading sold comps…