108 S 5th St · Akron, PA
Flood risk 1/10 · Minimal
- FEMA flood zone
- X (unshaded)
- Chance of flooding over 30 yrs
- 0.0%
- Est. flood insurance / yr
- $473 – $860
Fire risk 1/10 · Minimal
- Est. fire insurance / yr
- $511 – $949
Heat risk 5/10 · Moderate
- Hot days now (above 100°F)
- 7 days/yr
- Hot days in 30 yrs
- 15 days/yr
Wind risk 4/10 · Minor
- Chance of severe wind over 30 yrs
- 16.0%
Air-quality risk 4/10 · Minor
- Unhealthy air days now
- 6 days/yr
- Unhealthy air days in 30 yrs
- 7 days/yr
Risk factors via First Street. Map © Google.
Why this score? — see what drove the D grade
The composite is a weighted blend of 9 inputs, each scored 0–100. Each bar is that input's sub-score; the figure is the points it added to the 100-point composite (weight × sub-score).
- Cash flow +14.7/30.0
- ARV discount +5.9/15.0
- DSCR +4.5/10.0
- Schools +4.3/10.0
- 1% rule +3.8/10.0
- Livability +3.6/5.0
- Rent growth +2.5/5.0
- Condition / age +2.5/5.0
- Appreciation +0.0/10.0
$349,000
🖨 Deal sheet (PDF) 📄 Offer letter ✓ Due diligence
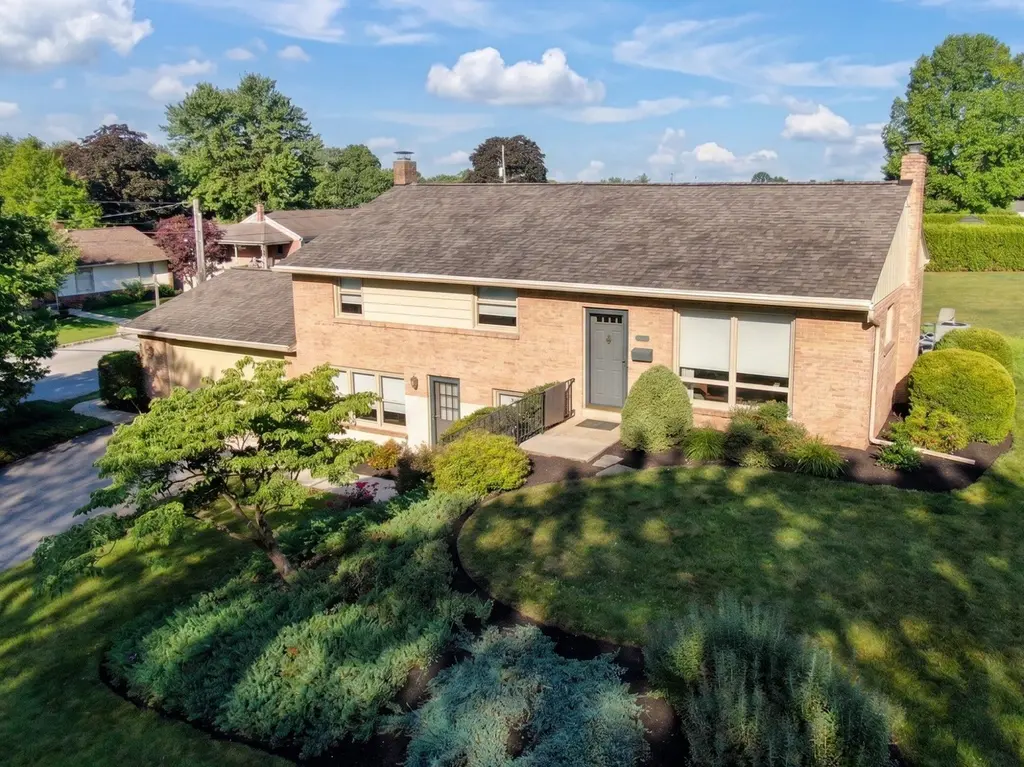
Listing remarks
Charming all-brick split-level home in a lovely Akron Borough neighborhood! This well-maintained home features three nice-sized bedrooms, two full baths, hardwood floors throughout, and tile flooring in the kitchen. The welcoming living room opens to the dining area with a slider door leading to the patio, perfect for outdoor enjoyment. The spacious lower level offers flexible living space for a family room and/or office, highlighted by a large window, hearth with stove, second full bath, laundry area, closet, and door to the backyard. Additional features include an unfinished utility/storage room, radon mitigation system already in place, and an attached two-car garage.
Key facts
- 9,148 sq ft lot
- 2 garage spots
- Built 1963
Property features AI
Exterior
- Parking: Attached front-entry garage with inside access (2 garage spaces)
- Utilities: Public water; Public sewer; Electric hot water; Electric cooling; Oil heating
- Home design: Detached property; Property in good condition; Year built estimated
- Construction: Brick and frame construction; Architectural shingle roof; Block foundation; Active radon mitigation
- Exterior features: Patio(s); Basement partially finished with daylight/walkout level; Full basement (partially finished)
Interior
- Kitchen: Built-in microwave; Dishwasher; Garbage disposal; Self-cleaning oven; Electric range/oven; Refrigerator
- Bedrooms: Three bedrooms on the upper level
- Flooring: Hardwood; Ceramic tile; Vinyl
- Bathrooms: Two full bathrooms (one on upper level, one on lower level)
- Heating & cooling: Forced air heating (oil-fired); Central air conditioning; 200+ amp electrical service
- Interior features: Attic/house fan; Built-ins; Combination dining and living area; Pantry; Wood stove; Tub shower; Stall shower; Sliding glass door
- Laundry & utility: Washer; Electric dryer (front loading); Laundry in basement; Electric water heater
Neighborhood map
What this means for you Summary
Snapshot
- This is a 3-bed/1.5-bath single-family listed at $349k.
Deal economics
- At list price, monthly cash flow is $90 ($1k/yr) — positive.
- The deal already cash-flows at list — no discount required.
- To meet the 1% rule (rent ≥ 1% of price), the offer needs to be $307k (12.0% below list).
- Recommended offer: $307k (12.0% below list) — sets the bar for 1% rule.
Location & tenants
- Location reads 72/100 on livability (#638 in PA) — a middle-class / working-renter tenant base. Strengths: crime A+, cost of living A+, housing A+; Watch: amenities F, commute F.
- Ephrata Area SD (suburban): math 43% / reading 57% proficiency, ranked #173 of 539 in PA (top 32%) — acceptable for families but not a draw, mixed tenant base, ~2y average lease.
- Zoned schools: Akron El Sch (math 47% / reading 57%, grade C-, #586 of 1,518 statewide, top 42%, 276 students, 60% FRL); Ephrata Shs (math 78% / reading 44%, grade B-, #74 of 437 statewide, top 17%, 1,317 students, 41% FRL) — zoned schools average 51% FRL vs 32% district-wide (18 pts higher); higher-poverty schools than district average — tighter screening recommended.
- Market conditions: 15 active listings in the ZIP; 2 comparable units currently listed for rent nearby; 1,093 units permitted in Lancaster County in 2024 (201 in 5+ unit buildings).
Forward outlook
- Local home prices are declining (-3.0%/yr); year-one equity from $2k of loan paydown is wiped out by about $10k of value loss. Plan a longer hold.
- Lancaster County population projected at +5% by 2050 — modest demand growth; plan on rents tracking national, not racing it.
Negotiation context
- Only 3 days on market — expect competitive offers; lowballing is unlikely to land.
- Current owner paid $52k; list at $349k implies a 578% gain — meaningful room to come down on a strong offer.
Risks & watch-outs
- Climate carrying-cost: extreme-heat days projected 7→15/yr by 2055 (HVAC capex compounding) — expect insurance premiums to compound above CPI over the hold.
Questions for the listing agent
- Built in 1963 — when were the roof, HVAC, electrical panel, plumbing, and water heater last replaced?
- Is there a deadline driving the sale (1031 exchange, divorce, estate, relocation)? That informs how much negotiation room exists.
- Schools are B-rated — typically a magnet for longer-tenancy family renters. What's the average tenant stay here, and is there a school-zone premium baked into asking?
- The area grade is low — what's the realistic commute time and amenity access for the typical tenant pool here? Any planned neighborhood developments (good or bad) we should know about?
- What's the average days-on-market for RENTAL listings here right now (not sales)? A rising rental-DOM trend means longer vacancies and softer asking-rent achievability than the comps imply.
- What's the recent tenant-quality profile in this submarket — average credit score on applications, eviction rate, late-payment / NSF rate, and stable-employment percentage? A property-management company in the area should have these aggregated.
- How much new for-sale + rental construction is in the pipeline within 1–3 miles? Heavy new supply typically softens prices + rents 12–24 months out; constrained supply supports both.
Investment metrics
- 1% rule
- 0.88% ✗
- Cap rate
- 6.60%
- Cash-on-cash
- 1.11%
- DSCR
- 1.05
- GRM
- 9.5
CMA / ARV
- ARV (on-the-fly)
- $337,132
- Comps found
- 12
Show comp detail 12 sales within ~0.75 mi
| Address | Dist | Beds/Ba | Sqft | Sold | Price | $/sf | Match |
|---|---|---|---|---|---|---|---|
| 728 Main St | 0.27mi | 4/2.5 (+1) | 1,894 (0%) | 2mo | $415,000 | $219 | 77 |
| 32 S 11th St | 0.51mi | 3/1.5 | 1,875 (-1%) | 8mo | $303,000 | $162 | 68 |
| 103 Main St | 0.36mi | 3/2.0 | 2,000 (+6%) | 5mo | $337,000 | $169 | 68 |
| 11 Wolf Rd | 0.30mi | 3/2.5 | 2,059 (+9%) | 6mo | $360,000 | $175 | 62 |
| 628 Fulton St | 0.21mi | 3/2.5 | 1,644 (-13%) | 6mo | $275,000 | $167 | 59 |
| 15 Main St | 0.54mi | 3/2.0 | 2,044 (+8%) | 2mo | $395,000 | $193 | 57 |
| 244 Miller | 0.56mi | 3/2.5 | 2,036 (+8%) | 5mo | $410,000 | $201 | 54 |
| 3320 Rothsville | 0.55mi | 3/2.5 | 1,710 (-10%) | 1mo | $400,000 | $234 | 53 |
| 923 Oak St | 0.58mi | 3/2.0 | 2,106 (+11%) | 11mo | $429,900 | $204 | 44 |
| 123 N 11th St | 0.53mi | 4/2.0 (+1) | 2,170 (+15%) | 1mo | $282,000 | $130 | 44 |
| 134 Westbrook Dr | 0.65mi | 3/2.0 | 1,680 (-11%) | 9mo | $195,000 | $116 | 41 |
| 157 Millway Rd | 0.72mi | 4/2.0 (+1) | 2,176 (+15%) | 1mo | $386,250 | $178 | 34 |
Match score weights: distance 35% · size 25% · config 20% · recency 20%. Top-matched comps best support the ARV.
Projected returns pro-forma
-3.0% appreciation · 3.0% rent growth · sell at horizon
- IRR
- -14.5%
- Equity multiple
- 0.48×
- Total profit
- $-50,816
- Equity at exit
- $52,037
- IRR
- -5.8%
- Equity multiple
- 0.62×
- Total profit
- $-36,863
- Equity at exit
- $30,175
Cash invested: $97,720 (down + closing). Projections, not guarantees.
Landlord ↔ Tenant lean methodology
- Overall (STATE)
- 62 Landlord-Friendly
- State Pennsylvania
- 62 Landlord-Friendly · EVEN
- County
- — inherits STATE
- City
- — inherits STATE
ZIP-level market 17501
- Home prices YoY
- -26.1%
- Active inventory
- 15
- Price-to-rent
- 9.5×
Monthly cashflow live
- Estimated rent
- $3,071 medium interval (Pro) →
- Mortgage (P&I)
- −$1,830
- Tax from tax record
- −$360 /mo · $4,325/yr
- Insurance
- −$145
- HOA
- −$0
- Vacancy / Maint / Mgmt
- −$645
- Net cashflow
- $90
Break-even live
Sensitivity live
| Price | -10% $288 | -5% $189 | +0% $90 | +5% $-9 | +10% $-107 |
|---|---|---|---|---|---|
| Rent | -10% $-153 | -5% $-31 | +0% $90 | +5% $211 | +10% $333 |
| Rate | -1.0pp $266 | -0.5pp $179 | base $90 | +0.5pp $0 | +1.0pp $-92 |
UW: 25.0% down · 7.5% · 30yr · 1.5% tax · 5.0% vac · 8.0% maint · 8.0% mgmt
Financing live
Cash to close
- Down payment
- $87,250
- Closing costs
- $10,470
- Reserves months
- —
- Total cash needed
- —
Loan-product check · same deal, 3 products live
Conventional
25% down · 7.5% · 30yr
- Down + closing
- —
- Monthly P&I
- —
- Monthly cashflow
- —
- DSCR
- —
- Eligible?
- —
Personal DTI + credit; lowest rate.
DSCR
20% down · 8.5% · 30yr
- Down + closing
- —
- Monthly P&I
- —
- Monthly cashflow
- —
- DSCR
- —
- Eligible?
- —
No personal income docs; deal must DSCR.
Hard money
10% down · 12.0% · 12mo
- Down + closing
- —
- Monthly P&I
- —
- Monthly cashflow
- —
- DSCR
- —
- Eligible?
- —
Short-term bridge; refi at stabilization.
Rent comps 2 comps
| Address | Beds | Baths | Sqft | Rent | $/sqft | DOM | Units | Dist |
|---|---|---|---|---|---|---|---|---|
| 17 N 5th St Akron, PA | 3.0 | 2.5 | 1890 | $3,150 | $1.67 | 16d | 1 | 0.10mi |
| 166 Eagle Dr Ephrata, PA | 3.0 | 4.0 | 1596 | $2,350 | $1.47 | 45d | 1 | 0.77mi |
Listing history 7 events
-
2026-06-16status $349,000 Pending 3 DOM
-
2026-06-15days on market $349,000 Active 3 DOM
-
2026-06-14statusdays on market $349,000 Active 1 DOM
-
2026-06-10days on market $349,000 Coming Soon 3 DOM
-
2026-06-09days on market $349,000 Coming Soon 2 DOM
-
2026-06-08remarks 679-char remark
-
2026-06-08$349,000 Coming Soon 1 DOM
ⓘ Source: listings_history table (triggers on properties + properties_extension) + one-shot
backfill from property_details.listing_events for pre-trigger history.
Tax reassessment forecast PA · Partial reset (capped growth)
- Current annual tax
- $4,325 · $360/mo
- Projected year-2 tax
- $4,920 · $410/mo
- Expected delta
- +$595/yr (+$50/mo · 13.7%)
ⓘ Screening estimate from a state-policy table — verify with the county assessor before closing.
Climate risk First Street
- Flood 1/10 Low FEMA zone X (unshaded) · 0% chance over 30 yrs
- Wildfire 1/10 Low
- Heat 5/10 Major 7 d/yr ≥100°F today · 15 d/yr by 30 yrs out
- Wind 4/10 Moderate 16% chance of damaging wind over 30 yrs
- Air quality 4/10 Moderate 6 unhealthy d/yr today · 7 by 30 yrs out
Nearby sold comps map
Loading sold comps map…
Walkable amenities ~0.75 mi
Loading nearby amenities…
Taxation est. · year 1
- Rental income
- $36,852
- − Mortgage interest
- −$19,549
- − Property taxes
- −$4,325
- − Insurance
- −$1,745
- − Repairs & maintenance
- −$2,948
- − Management
- −$2,948
- − Depreciation
- −$10,153
- Taxable loss
- −$4,816
- Est. tax savings @ 24.0%
- +$1,156
- After-tax cash flow
- $2,237/yr
For passive investors: Depreciation is non-cash, so a rental often shows a tax loss while cash-flowing — sheltering income. Rental losses are passive: they offset passive income freely, and up to $25,000/yr can offset ordinary (W-2) income if you actively participate and your MAGI is under $100k (phasing out to $0 by $150k); unused losses carry forward. On sale, claimed depreciation is recaptured at up to 25%, and gains may owe capital-gains tax (a 1031 exchange can defer both). Figures are a year-1 estimate at your 24.0% rate — not tax advice; consult a CPA.
Schools (NCES district)
- District
- Ephrata Area SD
- NCES district ID
- 4209270
- Math proficiency
- 43% ▼ -10.00%
- Reading proficiency
- 57% ▼ -9.00%
- Median HH income
- $54,320
- Composite
- 43.14/100
- National rank
- #3078
- State rank
- #173 of 539 in PA
Livability — Akron
- Score
- 72/100
- State rank
- #638
- US rank
- #6217
Category grades
Schools grade is shown separately in the Schools card above.
Census & demographics
- Census place
- Akron, PA
- City population
- 4,823
- Population (ZIP)
- 4,823
Population outlook (Lancaster County) Hauer SSP2
- Today (2025)
- 561,011 people
- By 2030
- 570,969 · +1.8%
- By 2040
- 585,929 · +4.4%
- By 2050
- 591,056 · +5.4%
- By 2075
- 594,747 · +6.0%
- By 2100
- 558,850 · -0.4%
Race, ethnicity, and origin ACS 2023
- Neighborhood character
- Predominantly White (82%)
- Race & ethnicity
- White 82% Hispanic / Latino 8% Two or more races 6% Asian 3% Black 1%
- Hispanic origin (detail)
- Puerto Rican 4%
- Common ancestry
- Lithuanian 2% Slovak 2% Italian 1%
- Foreign-born
- 5% · Canada, Jamaica
- Languages at home
- 90% English-only · Spanish 5% Arabic 2% German/W. Germanic 1%
Political lean MEDSL · Lancaster
- 2024 margin
- R (+15.9) · D 41.5% · R 57.5%
- 2008→2024 swing
- -4.1pp toward R · 2008: -11.8pp · 2024: -15.9pp
- All cycles
- 2024: R+15.9 2020: R+15.8 2016: R+19.7 2012: R+19.2 2008: R+11.8
Not yet ingested
- Civics
- —
Market trends
- HPI YoY
- ▼ -98.31%
- Current HPI
- 278.9238
- Rent YoY
- —
- Metro
- —
- State GDP YoY
- ▲ 1.68%
- F500 in state
- 34
Industry mix (Fortune 500 HQ in PA)
| Industry | F500 HQs | Revenue |
|---|---|---|
| Healthcare | 2 | $309B |
|
||
| Insurance | 2 | $27B |
|
||
| Telecommunications / Media | 1 | $124B |
|
||
| Industrial Distribution | 1 | $22B |
|
||
| Financial Services | 1 | $20B |
|
||
| Chemicals / Materials | 1 | $18B |
|
||
Price history
+577.7% since first listed2 events — show timeline
- 2026-06-07 Coming Soon $349,000 BRIGHT MLS
- 1980-11-05 Sold (Public Records) $51,500 Public Records
Property tax history
+2.6%/yrLatest (2026): $4,325 · +5.1% YoY. Source: county tax records.
Cash-flow waterfall
monthlySold comps — $/sqft
last 12 mo · ≤1 miLoading sold comps…