 Duplex
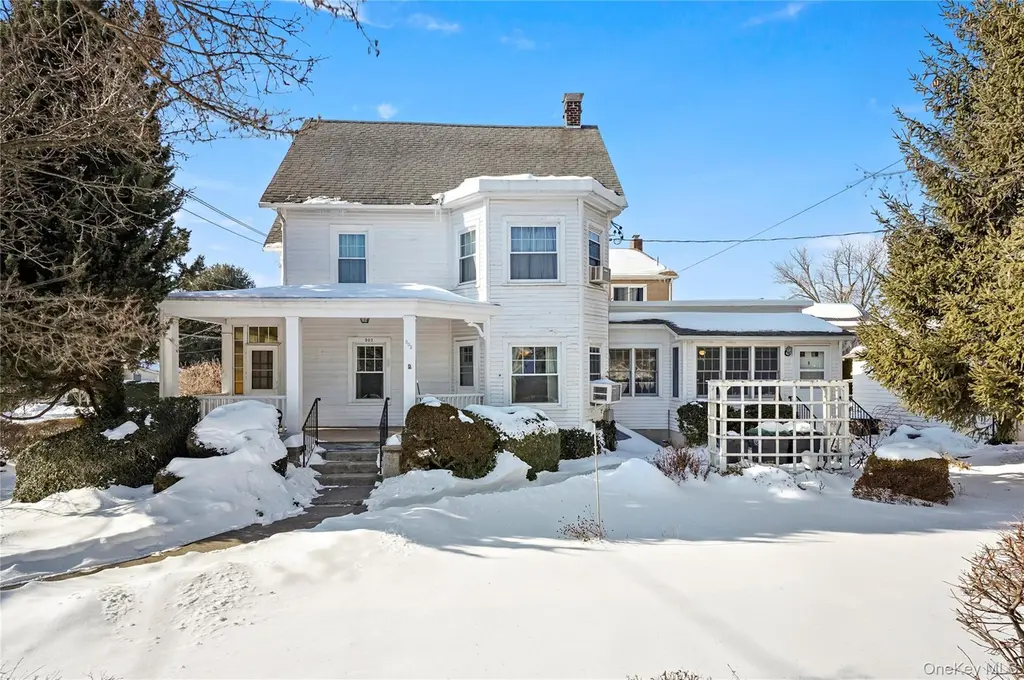
503 Second Ave · Pelham, NY
Flood risk 1/10 · Minimal
- FEMA flood zone
- X (unshaded)
- Chance of flooding over 30 yrs
- 0.0%
- Est. flood insurance / yr
- $473 – $860
Fire risk 1/10 · Minimal
- Est. fire insurance / yr
- $691 – $1,283
Heat risk 6/10 · Moderate
- Hot days now (above 98°F)
- 7 days/yr
- Hot days in 30 yrs
- 15 days/yr
Wind risk 6/10 · Moderate
- Chance of severe wind over 30 yrs
- 27.0%
Air-quality risk 5/10 · Moderate
- Unhealthy air days now
- 6 days/yr
- Unhealthy air days in 30 yrs
- 8 days/yr
Risk factors via First Street. Map © Google.
Why this score? — see what drove the D grade
The composite is a weighted blend of 9 inputs, each scored 0–100. Each bar is that input's sub-score; the figure is the points it added to the 100-point composite (weight × sub-score).
- ARV discount +15.0/15.0
- Schools +7.6/10.0
- Cash flow +7.4/30.0
- Livability +4.2/5.0
- 1% rule +2.8/10.0
- Rent growth +2.5/5.0
- Condition / age +2.5/5.0
- DSCR +1.5/10.0
- Appreciation +0.0/10.0
$850,000
🖨 Deal sheet 📄 Offer letter ✓ Due diligence
Multi-family units
County records classify this as Multi-Family (2-4 Unit). Listing-text estimate: 2 units. confirmed
Listing remarks MLS
Situated on a prominent corner lot in the heart of Pelham, this classic two-family home offers flexibility, charm, and long-term potential in a highly desirable village setting. The property features two distinct LEGAL residential units with 1st floor separate entrances, making it ideal for owner-occupants, extended family living, or income-producing use. A covered front porch enhances the home’s traditional curb appeal, while the corner exposure allows for abundant natural light throughout. Inside, the home retains much of its original character, including high ceilings and generously sized rooms, with interiors largely in original condition and ready for personalization or renovation. Upper levels feature sloped ceilings and dormer windows that add architectural interest and warmth. With multiple floors, a finished attic offering 2 additional rooms and basement space for storage or expansion, and a layout that supports a true two-family configuration, this property presents a rare opportunity to own a versatile residence with strong upside, conveniently located near shops, schools, and Metro-North transportation.
Key facts
- Covered front porch
- Finished attic
- High ceilings
Tags
Neighborhood map
What this means for you Summary
Snapshot
- This is a 2 × 3-bed/3.0-bath units multifamily listed at $850k.
Deal economics
- At list price, monthly cash flow is $-1k ($-13k/yr) — negative. Per door: $-548/mo.
- To cash-flow at today's rent, offer at most $656k (22.8% below list).
- To meet the 1% rule (rent ≥ 1% of price), the offer needs to be $662k (22.1% below list).
- Recommended offer: $656k (22.8% below list) — sets the bar for cash-flow.
- Cap rate 4.7% vs local median 0.5% in Pelham — top-decile yield for the area; either an underpriced asset or a hidden risk that comps aren't pricing in. Stress-test before assuming the spread holds.
Location & tenants
- Location reads 85/100 on livability (#27 in NY, #480 nationally) — a professional / high-income tenant draw. Strengths: schools A+, crime A+, amenities A+; Watch: cost of living F.
- Pelham Union Free School District (suburban): math 80% / reading 81% proficiency, ranked #29 of 590 in NY (top 5%) — strong family-tenant draw, lease renewals of 3-5y typical; only 5% free/reduced lunch — higher-income household profile.
- Market conditions: 80 active listings in the ZIP; 12 comparable units currently listed for rent nearby; rentals leasing fast (median 5d on market — plan ~1-2 weeks tenant-placement turnaround); high-income renter base; 954 units permitted in Westchester County in 2024 (649 in 5+ unit buildings).
- This rent runs 37% of the median local income ($215k/yr) — at the standard rent-burdened threshold; future hikes will face affordability resistance.
Forward outlook
- Local home prices are declining (-3.0%/yr); year-one equity from $6k of loan paydown is wiped out by about $26k of value loss. Plan a longer hold.
- Westchester County population projected at +10% by 2050 — modest demand growth; plan on rents tracking national, not racing it.
Negotiation context
- It's been on market 123 days — a 12% lower offer ($748k) is reasonable based on typical stale-listing flexibility.
Risks & watch-outs
- Watch-outs: built in 1890 — expect roof / HVAC / electrical / plumbing capex.
- Climate carrying-cost: major wind risk, 27% chance of damaging wind over 30y; extreme-heat days projected 7→15/yr by 2055 (HVAC capex compounding) — expect insurance premiums to compound above CPI over the hold.
Questions for the listing agent
- What do current leases actually rent for vs. the listed asking? Can we see a recent rent roll and the last 12 months of T-12 income?
- It's been on market 123 days. Have you received any prior offers? Is the seller open to a 23% concession, seller financing, or rate buy-down credit?
- Can we see the unit-by-unit rent roll, current vacancy, and any below-market leases? What's the average tenancy length?
- What capital expenditures (roof, boiler, parking lot, exteriors) have been made in the last 5 years, and what's planned in the next 2?
- Built in 1890 — when were the roof, HVAC, electrical panel, plumbing, and water heater last replaced?
- Why hasn't it sold? Are there any deal-killer items the seller is aware of (foundation, flood, title, zoning, code violations)?
- Is there a deadline driving the sale (1031 exchange, divorce, estate, relocation)? That informs how much negotiation room exists.
- Schools are A-rated — typically a magnet for longer-tenancy family renters. What's the average tenant stay here, and is there a school-zone premium baked into asking?
- The area grade is low — what's the realistic commute time and amenity access for the typical tenant pool here? Any planned neighborhood developments (good or bad) we should know about?
- What's the average days-on-market for RENTAL listings here right now (not sales)? A rising rental-DOM trend means longer vacancies and softer asking-rent achievability than the comps imply.
- What's the recent tenant-quality profile in this submarket — average credit score on applications, eviction rate, late-payment / NSF rate, and stable-employment percentage? A property-management company in the area should have these aggregated.
- How much new apartment / multifamily construction is in the pipeline within 1–3 miles? Heavy new supply (>2% of stock underway) typically softens rents 12–24 months out; light construction supports rent growth.
Investment metrics
- 1% rule
- 0.78% ✗
- Cap rate
- 4.74%
- Cash-on-cash
- -5.53%
- DSCR
- 0.75
- GRM
- 10.7
CMA / ARV
- ARV (median comp)
- $1,671,999
- List price
- $850,000
- Delta
- -49.16%
- Verdict
- UNDERPRICED
- Comps
- 20 within 1.0 mi
Show comp detail 3 sales within ~0.75 mi
| Address | Dist | Beds/Ba | Sqft | Sold | Price | $/sf | Match |
|---|---|---|---|---|---|---|---|
| 3 Poplar Ave | 0.29mi | 4/2.0 (+1) | 1,945 (+4%) | 10mo | $879,000 | $452 | 64 |
| 530 Fourth Ave | 0.16mi | 4/2.0 (+1) | 1,600 (-14%) | 9mo | $800,000 | $500 | 55 |
| 404 Fifth Ave | 0.23mi | 3/2.0 | 2,125 (+14%) | 15mo | $1,050,000 | $494 | 52 |
Match score weights: distance 35% · size 25% · config 20% · recency 20%. Top-matched comps best support the ARV.
Projected returns pro-forma
-3.0% appreciation · 3.0% rent growth · sell at horizon
- IRR
- -25.7%
- Equity multiple
- 0.13×
- Total profit
- $-207,223
- Equity at exit
- $126,738
- IRR
- -22.0%
- Equity multiple
- -0.13×
- Total profit
- $-268,867
- Equity at exit
- $73,492
Cash invested: $238,000 (down + closing). Projections, not guarantees.
Landlord ↔ Tenant lean methodology
- Overall (STATE)
- 15 Strongly Tenant-Friendly
- State New York
- 15 Strongly Tenant-Friendly · D+10
- County
- — inherits STATE
- City
- — inherits STATE
ZIP-level market 10803
- Active inventory
- 80
- Price-to-rent
- 21.4×
Monthly cashflow live
- Estimated rent
- $6,624 high interval (Pro) →
- Mortgage (P&I)
- −$4,457
- Tax from tax record
- −$1,518 /mo · $18,219/yr
- Insurance
- −$354
- HOA
- −$0
- Vacancy / Maint / Mgmt
- −$1,391
- Net cashflow
- $-1,097
Break-even live
2-unit breakdown (identical units grouped — click to expand)
| Units | Beds | Baths | Est. rent |
|---|---|---|---|
| 2× units | 3 | 3 | $6,624 |
| #1 | 3 | 3 | $3,312 |
| #2 | 3 | 3 | $3,312 |
| Total (2 units) | $6,624 | ||
UW: 25.0% down · 7.5% · 30yr · 1.5% tax · 5.0% vac · 8.0% maint · 8.0% mgmt
Financing live
Cash to close
- Down payment
- $212,500
- Closing costs
- $25,500
- Reserves months
- —
- Total cash needed
- —
Loan-product check · same deal, 3 products live
Conventional
25% down · 7.5% · 30yr
- Down + closing
- —
- Monthly P&I
- —
- Monthly cashflow
- —
- DSCR
- —
- Eligible?
- —
Personal DTI + credit; lowest rate.
DSCR
20% down · 8.5% · 30yr
- Down + closing
- —
- Monthly P&I
- —
- Monthly cashflow
- —
- DSCR
- —
- Eligible?
- —
No personal income docs; deal must DSCR.
Hard money
10% down · 12.0% · 12mo
- Down + closing
- —
- Monthly P&I
- —
- Monthly cashflow
- —
- DSCR
- —
- Eligible?
- —
Short-term bridge; refi at stabilization.
Rent comps 12 comps
| Address | Beds | Baths | Sqft | Rent | $/sqft | DOM | Units | Dist |
|---|---|---|---|---|---|---|---|---|
| 222 Lorraine Ave Mount Vernon, NY | 4.0 | 1.5 | 1948 | $5,500 | $2.82 | 7d | 1 | 0.42mi |
| 375 Hawthorne Ter Mount Vernon, NY | 3.0 | 3.5 | 1975 | $10,000 | $5.06 | 1d | 1 | 0.65mi |
| 131 Pelhamdale Ave Mount Vernon, NY | 2.0 | 2.0 | 1600 | $3,300 | $2.06 | 4d | 1 | 0.73mi |
| 123 Clinton Ave Unit 2 New Rochelle, NY | 4.0 | 2.0 | 1378 | $4,250 | $3.08 | 43d | 1 | 0.81mi |
| 9 9th St Unit 1st Floor New Rochelle, NY | 3.0 | 1.0 | 1463 | $3,400 | $2.32 | 43d | 1 | 0.89mi |
| 14 Horton Ave Unit 3rd Fl New Rochelle, NY | 4.0 | 1.0 | 1300 | $3,600 | $2.77 | 43d | 1 | 1.12mi |
| 173 Washington St Unit 2 Mt Vernon, NY | 3.0 | 2.0 | 1500 | $3,200 | $2.13 | 1d | 1 | 1.23mi |
| 70 Elm Ave Unit Right Mt Vernon, NY | 3.0 | 2.5 | 1800 | $4,000 | $2.22 | 4d | 1 | 1.26mi |
| 21 E Cedar St Mount Vernon, NY | 3.0 | 1.0 | 2600 | $3,750 | $1.44 | 20d | 1 | 1.42mi |
| 325 Huguenot St New Rochelle, NY | 1.0–2.0 | 1.0–2.0 | 989 | $4,625 | $4.68 | 5d | 8 | 1.47mi |
| 333 Huguenot St New Rochelle, NY | 2.0 | 1.0–2.0 | 853 | $4,785 | $5.61 | 2d | 12 | 1.48mi |
| 1 Shearwood Pl New Rochelle, NY | 3.0 | 1.0–2.0 | 896 | $4,340 | $4.84 | 2d | 31 | 1.49mi |
Listing history 10 events
-
2026-06-09status $850,000 Pending 123 DOM
-
2026-06-08days on market $850,000 Active 123 DOM
-
2026-06-07pricedays on market $850,000 Active 122 DOM
-
2026-06-04days on market $949,000 Active 119 DOM
-
2026-06-03days on market $949,000 Active 118 DOM
-
2026-06-02days on market $949,000 Active 117 DOM
-
2026-06-01days on market $949,000 Active 116 DOM
-
2026-05-31days on market $949,000 Active 115 DOM
-
2026-02-25price $949,000 1138-char remark
Show marketing remark (1138 chars)
Situated on a prominent corner lot in the heart of Pelham, this classic two-family home offers flexibility, charm, and long-term potential in a highly desirable village setting. The property features two distinct LEGAL residential units with 1st floor separate entrances, making it ideal for owner-occupants, extended family living, or income-producing use. A covered front porch enhances the home’s traditional curb appeal, while the corner exposure allows for abundant natural light throughout. Inside, the home retains much of its original character, including high ceilings and generously sized rooms, with interiors largely in original condition and ready for personalization or renovation. Upper levels feature sloped ceilings and dormer windows that add architectural interest and warmth. With multiple floors, a finished attic offering 2 additional rooms and basement space for storage or expansion, and a layout that supports a true two-family configuration, this property presents a rare opportunity to own a versatile residence with strong upside, conveniently located near shops, schools, and Metro-North transportation.
-
2026-02-05$970,000 Active 1138-char remark
Show marketing remark (1138 chars)
Situated on a prominent corner lot in the heart of Pelham, this classic two-family home offers flexibility, charm, and long-term potential in a highly desirable village setting. The property features two distinct LEGAL residential units with 1st floor separate entrances, making it ideal for owner-occupants, extended family living, or income-producing use. A covered front porch enhances the home’s traditional curb appeal, while the corner exposure allows for abundant natural light throughout. Inside, the home retains much of its original character, including high ceilings and generously sized rooms, with interiors largely in original condition and ready for personalization or renovation. Upper levels feature sloped ceilings and dormer windows that add architectural interest and warmth. With multiple floors, a finished attic offering 2 additional rooms and basement space for storage or expansion, and a layout that supports a true two-family configuration, this property presents a rare opportunity to own a versatile residence with strong upside, conveniently located near shops, schools, and Metro-North transportation.
ⓘ Source: listings_history table (triggers on properties + properties_extension) + one-shot
backfill from property_details.listing_events for pre-trigger history.
Tax reassessment forecast NY · Partial reset (capped growth)
- Current annual tax
- $18,219 · $1,518/mo
- Projected year-2 tax
- $18,219 · $1,518/mo
- Expected delta
- $0/yr ($0/mo · 0.0%)
ⓘ Screening estimate from a state-policy table — verify with the county assessor before closing.
Climate risk First Street
- Flood 1/10 Low FEMA zone X (unshaded) · 0% chance over 30 yrs
- Wildfire 1/10 Low
- Heat 6/10 Major 7 d/yr ≥98°F today · 15 d/yr by 30 yrs out
- Wind 6/10 Major 27% chance of damaging wind over 30 yrs
- Air quality 5/10 Major 6 unhealthy d/yr today · 8 by 30 yrs out
Nearby sold comps map
Loading sold comps map…
Walkable amenities ~0.75 mi
Loading nearby amenities…
Taxation est. · year 1
- Rental income
- $79,488
- − Mortgage interest
- −$47,613
- − Property taxes
- −$18,219
- − Insurance
- −$4,250
- − Repairs & maintenance
- −$6,359
- − Management
- −$6,359
- − Depreciation
- −$24,727
- Taxable loss
- −$28,040
- Est. tax savings @ 24.0%
- +$6,730
- After-tax cash flow
- $-6,434/yr
For passive investors: Depreciation is non-cash, so a rental often shows a tax loss while cash-flowing — sheltering income. Rental losses are passive: they offset passive income freely, and up to $25,000/yr can offset ordinary (W-2) income if you actively participate and your MAGI is under $100k (phasing out to $0 by $150k); unused losses carry forward. On sale, claimed depreciation is recaptured at up to 25%, and gains may owe capital-gains tax (a 1031 exchange can defer both). Figures are a year-1 estimate at your 24.0% rate — not tax advice; consult a CPA.
Schools (NCES district)
- District
- Pelham Union Free School District
- NCES district ID
- 3622680
- Math proficiency
- 80% ▲ 3.00%
- Reading proficiency
- 81% ▲ 6.00%
- Median HH income
- $136,478
- Composite
- 76.35/100
- National rank
- #109
- State rank
- #29 of 590 in NY
Livability — Pelham
- Score
- 85/100
- State rank
- #27
- US rank
- #480
Category grades
Schools grade is shown separately in the Schools card above.
Census & demographics
- Census place
- Pelham, NY
- County
- Westchester County · 709,332 people
- City population
- 13,072
- Metro
- New York-Newark-Jersey City, NY-NJ-PA
- Population (ZIP)
- 13,072
- Household income
- $215,208
- Rent vs Own
- Severe rent burden
- 119.0
Population outlook (Westchester County) Hauer SSP2
- Today (2025)
- 1,028,035 people
- By 2030
- 1,051,636 · +2.3%
- By 2040
- 1,098,520 · +6.9%
- By 2050
- 1,136,044 · +10.5%
- By 2075
- 1,196,925 · +16.4%
- By 2100
- 1,175,147 · +14.3%
Race, ethnicity, and origin ACS 2023
- Neighborhood character
- Predominantly White (67%)
- Race & ethnicity
- White 67% Hispanic / Latino 13% Two or more races 12% Asian 7% Black 6%
- Hispanic origin (detail)
- Mexican 2% Puerto Rican 4% Dominican 3% Salvadoran 1%
- Common ancestry
- Romanian 3% Scotch-Irish 3% Slovak 2%
- Foreign-born
- 17% · Canada, China, South Korea
- Languages at home
- 80% English-only · Spanish 7% Other Indo-European 6% Russian/Polish/Slavic 2%
Political lean MEDSL · Westchester
- 2024 margin
- Strong D (+26.3) · D 63.1% · R 36.9%
- 2008→2024 swing
- -1.3pp toward R · 2008: 27.6pp · 2024: 26.3pp
- All cycles
- 2024: D+26.3 2020: D+36.3 2016: D+32.8 2012: D+22.2 2008: D+27.6
Not yet ingested
- Civics
- —
Market trends
- HPI YoY
- ▼ -844.94%
- Current HPI
- 357.3886
- Rent YoY
- —
- Metro
- New York-Newark-Jersey City, NY-NJ-PA
- State GDP YoY
- ▲ 2.60%
- F500 in state
- 92
Industry mix (Fortune 500 HQ in NY)
| Industry | F500 HQs | Revenue |
|---|---|---|
| Financial Services | 10 | $950B |
|
||
| Consumer Goods | 9 | $162B |
|
||
| Insurance | 4 | $225B |
|
||
| Telecommunications | 2 | $144B |
|
||
| Pharmaceuticals | 2 | $112B |
|
||
| Media / Entertainment | 2 | $69B |
|
||
Price history
-2.2% since first listed2 events — show timeline
- 2026-02-25 Price Changed $949,000 OneKey® MLS as Distributed by MLS Grid
- 2026-02-05 Listed $970,000 OneKey® MLS as Distributed by MLS Grid
Property tax history
+0.8%/yrLatest (2025): $18,219 · +3.7% YoY. Source: county tax records.
Cash-flow waterfall
monthlySold comps — $/sqft
last 12 mo · ≤1 miLoading sold comps…