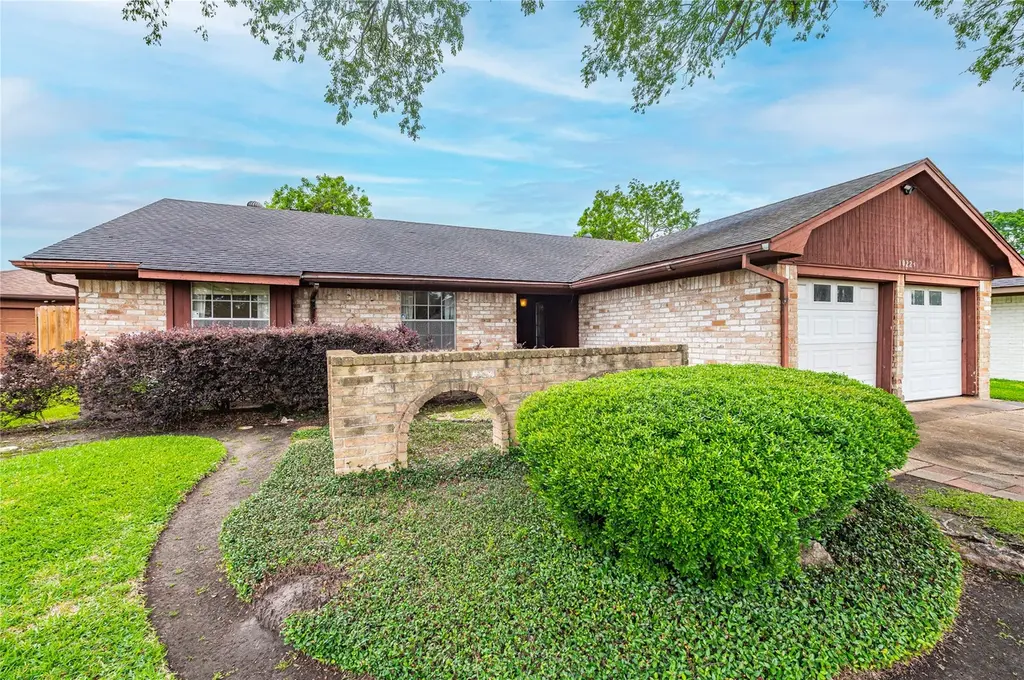
10223 Kirkglen Dr · Houston, TX
Flood risk 1/10 · Minimal
- FEMA flood zone
- X (shaded)
- Chance of flooding over 30 yrs
- 0.0%
- Est. flood insurance / yr
- $507 – $1,088
Fire risk 1/10 · Minimal
- Est. fire insurance / yr
- $1,222 – $2,270
Heat risk 10/10 · Severe
- Hot days now (above 108°F)
- 7 days/yr
- Hot days in 30 yrs
- 24 days/yr
Wind risk 9/10 · Severe
- Chance of severe wind over 30 yrs
- 99.0%
Air-quality risk 2/10 · Minimal
- Unhealthy air days now
- 1 days/yr
- Unhealthy air days in 30 yrs
- 2 days/yr
Risk factors via First Street. Map © Google.
Why this score? — see what drove the D grade
The composite is a weighted blend of 9 inputs, each scored 0–100. Each bar is that input's sub-score; the figure is the points it added to the 100-point composite (weight × sub-score).
- ARV discount +13.2/15.0
- Cash flow +9.8/30.0
- 1% rule +4.3/10.0
- Livability +3.7/5.0
- Rent growth +3.4/5.0
- DSCR +2.8/10.0
- Schools +2.6/10.0
- Condition / age +2.5/5.0
- Appreciation +0.0/10.0
$212,000
🖨 Deal sheet (PDF) 📄 Offer letter ✓ Due diligence
Listing remarks
This 3-bedroom, 2-bath home in the established Kirkwood South community is a true opportunity—whether you're looking to create your dream space or secure your next investment. Ideally located near Beamer & Beltway 8, you’ll enjoy easy access to shopping, dining, and major commuting routes. Inside, you’ll find a spacious living room complete with a brick fireplace, perfect for gathering and relaxing. The open-concept kitchen flows into the family room, offering a functional layout with great potential for modern updates. A formal living area adds flexibility—ideal for a home office, second sitting area, or playroom. Step outside to a covered back patio, perfect
Key facts
- Brick fireplace
- Open-concept kitchen
- Double-wide driveway
Tags
Property features AI
Finance
- HOA & community: Community managed by Crest Management; Annual association fee of $300
Exterior
- Parking: Attached garage; 2 garage spaces; Driveway
- Utilities: Public water; Public sewer
- Home design: Residential property; Single-story entry level
- Construction: Brick construction; Built in 1970; Composition roof; Slab foundation
- Exterior features: Covered patio; Deck; Patio; Fenced backyard; Subdivision lot
Interior
- Kitchen: Dishwasher; Garbage disposal
- Bedrooms: Primary bedroom on the first floor (approx. 14x12); Two additional bedrooms on the first floor (each approx. 12x11)
- Flooring: Laminate; Tile; Vinyl
- Bathrooms: 2 full bathrooms
- Heating & cooling: Central heating (gas); Central air conditioning (electric)
- Interior features: Kitchen and family room combo; Pantry; Ceiling fans; Gas fireplace (1)
Neighborhood map
What this means for you Summary
Snapshot
- This is a 3-bed/2.0-bath single-family listed at $212k.
Deal economics
- At list price, monthly cash flow is $-137 ($-2k/yr) — negative.
- To cash-flow at today's rent, offer at most $188k (11.4% below list).
- To meet the 1% rule (rent ≥ 1% of price), the offer needs to be $197k (7.1% below list).
- Recommended offer: $188k (11.4% below list) — sets the bar for cash-flow.
- Cap rate 5.5% vs local median 3.1% in Houston — top-decile yield for the area; either an underpriced asset or a hidden risk that comps aren't pricing in. Stress-test before assuming the spread holds.
Location & tenants
- Location reads 74/100 on livability (#184 in TX, #4,771 nationally) — a middle-class / working-renter tenant base. Strengths: amenities A+, cost of living A+, housing A+; Watch: crime F.
- Pasadena ISD (suburban): math 29% / reading 32% proficiency, ranked #612 of 826 in TX (top 74%) — families likely to look elsewhere, expect single-tenant / working-renter base with shorter leases; 71% free/reduced lunch — lower-income household profile, screen leases tightly.
- Zoned schools: Meador El (math 17% / reading 32%, grade F, #3,052 of 4,322 statewide, top 74%, 467 students, 92% FRL); Morris Middle (math 32% / reading 33%, grade F, #947 of 1,662 statewide, top 58%, 703 students, 86% FRL); Pasadena H S (math 41% / reading 31%, grade F, #930 of 1,632 statewide, top 57%, 2,221 students, 90% FRL) — zoned schools average 89% FRL vs 71% district-wide (18 pts higher); higher-poverty schools than district average — tighter screening recommended.
- Market conditions: Rents rising (+3.5%/yr); 192 active listings in the ZIP; 19 comparable units currently listed for rent nearby; rentals at typical pace (median 21d on market — plan ~3-4 weeks tenant-placement turnaround); solid renter incomes; 29,883 units permitted in Harris County in 2024 (8,621 in 5+ unit buildings).
Forward outlook
- Local home prices are declining (-3.0%/yr); year-one equity from $1k of loan paydown is wiped out by about $6k of value loss. Plan a longer hold.
- Harris County population projected at +47% by 2050 — long-run rental-demand tailwind backs the buy-and-hold thesis.
Negotiation context
- It's been on market 15 days — a 2% lower offer ($209k) is reasonable based on typical stale-listing flexibility.
Risks & watch-outs
- Watch-outs: property tax is 2.6% of price.
- Climate carrying-cost: severe wind risk, 99% chance of damaging wind over 30y; extreme-heat days projected 7→24/yr by 2055 (HVAC capex compounding) — expect insurance premiums to compound above CPI over the hold.
Questions for the listing agent
- What do current leases actually rent for vs. the listed asking? Can we see a recent rent roll and the last 12 months of T-12 income?
- Built in 1970 — when were the roof, HVAC, electrical panel, plumbing, and water heater last replaced?
- Property tax is high relative to price — has the assessment been appealed recently, and will the sale trigger a re-assessment?
- What does the HOA fee cover, when was the last increase, and are there any pending special assessments or reserve-fund shortfalls?
- Is there a deadline driving the sale (1031 exchange, divorce, estate, relocation)? That informs how much negotiation room exists.
- Schools are D-rated, which usually means shorter tenancies and higher turnover. Who's the typical renter profile here, and what's been the actual vacancy rate?
- Crime grade is F in this area — have there been break-ins, vandalism, or insurance claims at this property in the last 3 years? What carrier currently insures it and at what premium?
- The area grade is low — what's the realistic commute time and amenity access for the typical tenant pool here? Any planned neighborhood developments (good or bad) we should know about?
- What's the average days-on-market for RENTAL listings here right now (not sales)? A rising rental-DOM trend means longer vacancies and softer asking-rent achievability than the comps imply.
- What's the recent tenant-quality profile in this submarket — average credit score on applications, eviction rate, late-payment / NSF rate, and stable-employment percentage? A property-management company in the area should have these aggregated.
- How much new for-sale + rental construction is in the pipeline within 1–3 miles? Heavy new supply typically softens prices + rents 12–24 months out; constrained supply supports both.
Investment metrics
- 1% rule
- 0.93% ✗
- Cap rate
- 5.52%
- Cash-on-cash
- -2.77%
- DSCR
- 0.88
- GRM
- 9.0
CMA / ARV
- ARV (median comp)
- $243,019
- List price
- $212,000
- Delta
- -12.76%
- Verdict
- UNDERPRICED
- Comps
- 20 within 1.0 mi
Show comp detail 12 sales within ~0.75 mi
| Address | Dist | Beds/Ba | Sqft | Sold | Price | $/sf | Match |
|---|---|---|---|---|---|---|---|
| 10302 Kirkdale Dr | 0.08mi | 3/2.0 | 1,738 (-3%) | 8mo | $244,900 | $141 | 85 |
| 10819 Sageriver Dr | 0.42mi | 3/2.5 | 1,780 (-0%) | 1mo | $239,000 | $134 | 77 |
| 10511 Kirklane Dr | 0.30mi | 3/2.0 | 1,698 (-5%) | 4mo | $289,999 | $171 | 75 |
| 10511 Sagepine Ln | 0.31mi | 4/2.0 (+1) | 1,848 (+4%) | 1mo | $154,300 | $83 | 74 |
| 11414 Newton St | 0.67mi | 3/2.0 | 1,742 (-2%) | 1mo | $245,000 | $141 | 64 |
| 11026 Sageview Dr | 0.69mi | 3/2.0 | 1,906 (+7%) | 4mo | $179,900 | $94 | 53 |
| 10519 Sagepark Ln | 0.70mi | 4/2.0 (+1) | 1,704 (-4%) | 3mo | $235,000 | $138 | 52 |
| 10518 Sagetree Dr | 0.26mi | 4/2.0 (+1) | 2,047 (+15%) | 8mo | $295,000 | $144 | 51 |
| 11214 Sagehaven Dr | 0.74mi | 3/2.0 | 1,949 (+9%) | 2mo | $287,000 | $147 | 48 |
| 11123 Sageview Dr | 0.74mi | 3/2.0 | 1,634 (-8%) | 6mo | $245,000 | $150 | 46 |
| 10610 Sagepark Ln | 0.72mi | 3/2.0 | 2,011 (+13%) | 1mo | $239,500 | $119 | 44 |
| 11611 Sagehollow Ln | 0.69mi | 4/2.0 (+1) | 2,040 (+14%) | 1mo | $285,000 | $140 | 38 |
Match score weights: distance 35% · size 25% · config 20% · recency 20%. Top-matched comps best support the ARV.
Projected returns pro-forma
-3.0% appreciation · 3.48% rent growth · sell at horizon
- IRR
- -20.2%
- Equity multiple
- 0.29×
- Total profit
- $-41,952
- Equity at exit
- $31,610
- IRR
- -11.9%
- Equity multiple
- 0.27×
- Total profit
- $-43,117
- Equity at exit
- $18,330
Cash invested: $59,360 (down + closing). Projections, not guarantees.
Landlord ↔ Tenant lean methodology
- Overall (STATE)
- 87 Strongly Landlord-Friendly
- State Texas
- 87 Strongly Landlord-Friendly · R+5
- County
- — inherits STATE
- City
- — inherits STATE
ZIP-level market 77089
- Rents YoY
- 3.5%
- Active inventory
- 192
- Price-to-rent
- 9.0×
Monthly cashflow live
- Estimated rent
- $1,969 high interval (Pro) →
- Mortgage (P&I)
- −$1,112
- Tax from tax record
- −$467 /mo · $5,605/yr
- Insurance
- −$88
- HOA
- −$25
- Vacancy / Maint / Mgmt
- −$413
- Net cashflow
- $-137
Break-even live
Sensitivity live
| Price | -10% $-17 | -5% $-77 | +0% $-137 | +5% $-197 | +10% $-257 |
|---|---|---|---|---|---|
| Rent | -10% $-292 | -5% $-215 | +0% $-137 | +5% $-59 | +10% $19 |
| Rate | -1.0pp $-30 | -0.5pp $-83 | base $-137 | +0.5pp $-192 | +1.0pp $-248 |
UW: 25.0% down · 7.5% · 30yr · 1.5% tax · 5.0% vac · 8.0% maint · 8.0% mgmt
Financing live
Cash to close
- Down payment
- $53,000
- Closing costs
- $6,360
- Reserves months
- —
- Total cash needed
- —
Loan-product check · same deal, 3 products live
Conventional
25% down · 7.5% · 30yr
- Down + closing
- —
- Monthly P&I
- —
- Monthly cashflow
- —
- DSCR
- —
- Eligible?
- —
Personal DTI + credit; lowest rate.
DSCR
20% down · 8.5% · 30yr
- Down + closing
- —
- Monthly P&I
- —
- Monthly cashflow
- —
- DSCR
- —
- Eligible?
- —
No personal income docs; deal must DSCR.
Hard money
10% down · 12.0% · 12mo
- Down + closing
- —
- Monthly P&I
- —
- Monthly cashflow
- —
- DSCR
- —
- Eligible?
- —
Short-term bridge; refi at stabilization.
Rent comps 19 comps
| Address | Beds | Baths | Sqft | Rent | $/sqft | DOM | Units | Dist |
|---|---|---|---|---|---|---|---|---|
| 11666 Gulf Pointe Dr Houston, TX | 1.0–3.0 | 1.0–2.0 | 1129 | $2,101 | $1.86 | 1d | 26 | 0.50mi |
| 11144 Fuqua St Houston, TX | 1.0–2.0 | 1.0–2.0 | 1066 | $1,959 | $1.84 | 12d | 24 | 0.51mi |
| 11881 Gulf Pointe Dr Unit 3047 Houston, TX | 3.0 | 2.0 | 1365 | $1,992 | $1.46 | 20d | 1 | 0.53mi |
| 11881 Gulf Pointe Dr Unit 3112 Houston, TX | 3.0 | 2.0 | 1365 | $2,024 | $1.48 | 1d | 1 | 0.57mi |
| 11881 Gulf Pointe Dr Unit 11914 Houston, TX | 3.0 | 2.0 | 1365 | $2,035 | $1.49 | 45d | 1 | 0.57mi |
| 11881 Gulf Pointe Dr Unit 3174 Houston, TX | 3.0 | 2.0 | 1365 | $2,064 | $1.51 | 12d | 1 | 0.57mi |
| 10819 Sagewind Dr Houston, TX | 4.0 | 2.0 | 1514 | $1,966 | $1.30 | 7d | 1 | 0.80mi |
| 11203 Sagehill Dr Houston, TX | 3.0 | 2.0 | 1766 | $1,900 | $1.08 | 7d | 1 | 0.84mi |
| 10418 Sagemeadow Ln Houston, TX | 4.0 | 2.0 | 1429 | $1,950 | $1.36 | 45d | 1 | 0.93mi |
| 11438 Brook Meadow Dr Houston, TX | 3.0 | 2.0 | 1450 | $1,895 | $1.31 | 24d | 1 | 1.01mi |
| 11511 Grapewood Ct Houston, TX | 3.0 | 2.0 | 1597 | $1,800 | $1.13 | 5d | 1 | 1.13mi |
| 9122 Southbluff Blvd Houston, TX | 3.0 | 2.0 | 1900 | $2,000 | $1.05 | 45d | 1 | 1.16mi |
| 12516 S Green Dr Houston, TX | 3.0 | 2.0 | 1295 | $1,600 | $1.24 | 45d | 1 | 1.21mi |
| 10010 Sagecanyon Dr Houston, TX | 3.0 | 2.0 | 1380 | $2,000 | $1.45 | 45d | 1 | 1.29mi |
| 10606 Kirkwren Dr Unit 1029082P Houston, TX | 4.0 | 2.0 | 1614 | $15,665 | $9.71 | 26d | 1 | 1.39mi |
| 10606 Kirkwren Dr Houston, TX | 4.0 | 2.0 | 1618 | $8,750 | $5.41 | 24d | 1 | 1.39mi |
| 9610 Foredale St Houston, TX | 3.0 | 2.0 | 1836 | $1,625 | $0.89 | 5d | 1 | 1.39mi |
| 10123 Clearwick St Houston, TX | 4.0 | 3.0 | 2029 | $2,650 | $1.31 | 45d | 1 | 1.42mi |
| 10026 Gil Jr Ln Houston, TX | 4.0 | 3.0 | 2250 | $2,100 | $0.93 | 1d | 1 | 1.43mi |
HOA detail
- Monthly dues
- $25 · $300/yr
Listing history 4 events
-
2026-05-10status Pending 912-char remark
-
2026-05-04status Pending 912-char remark
-
2026-04-23$212,000 Active 912-char remark
-
1989-12-28soldstatus
ⓘ Source: listings_history table (triggers on properties + properties_extension) + one-shot
backfill from property_details.listing_events for pre-trigger history.
Tax reassessment forecast TX · Resets to sale price
- Current annual tax
- $5,605 · $467/mo
- Projected year-2 tax
- $5,605 · $467/mo
- Expected delta
- $0/yr ($0/mo · 0.0%)
ⓘ Screening estimate from a state-policy table — verify with the county assessor before closing.
Climate risk First Street
- Flood 1/10 Low FEMA zone X (shaded) · 0% chance over 30 yrs
- Wildfire 1/10 Low
- Heat 10/10 Extreme 7 d/yr ≥108°F today · 24 d/yr by 30 yrs out
- Wind 9/10 Extreme 99% chance of damaging wind over 30 yrs
- Air quality 2/10 Low 1 unhealthy d/yr today · 2 by 30 yrs out
Nearby sold comps map
Loading sold comps map…
Walkable amenities ~0.75 mi
Loading nearby amenities…
Taxation est. · year 1
- Rental income
- $23,623
- − Mortgage interest
- −$11,875
- − Property taxes
- −$5,605
- − Insurance
- −$1,060
- − Repairs & maintenance
- −$1,890
- − Management
- −$1,890
- − HOA
- −$300
- − Depreciation
- −$6,167
- Taxable loss
- −$5,164
- Est. tax savings @ 24.0%
- +$1,239
- After-tax cash flow
- $-404/yr
For passive investors: Depreciation is non-cash, so a rental often shows a tax loss while cash-flowing — sheltering income. Rental losses are passive: they offset passive income freely, and up to $25,000/yr can offset ordinary (W-2) income if you actively participate and your MAGI is under $100k (phasing out to $0 by $150k); unused losses carry forward. On sale, claimed depreciation is recaptured at up to 25%, and gains may owe capital-gains tax (a 1031 exchange can defer both). Figures are a year-1 estimate at your 24.0% rate — not tax advice; consult a CPA.
Schools (NCES district)
- District
- Pasadena ISD
- NCES district ID
- 4834320
- Math proficiency
- 29% ▼ -17.00%
- Reading proficiency
- 32% ▼ -9.00%
- Median HH income
- $45,163
- Composite
- 26.15/100
- National rank
- #7275
- State rank
- #612 of 826 in TX
Livability — Houston
- Score
- 74/100
- State rank
- #184
- US rank
- #4771
Category grades
Schools grade is shown separately in the Schools card above.
Census & demographics
- Census place
- Houston, TX
- County
- Harris County · 4,702,590 people
- City population
- 3,226,434
- Metro
- Houston-The Woodlands-Sugar Land, TX
- Population (ZIP)
- 57,741
- Household income
- $88,140
- Rent vs Own
- Severe rent burden
- 1483.0
Population outlook (Harris County) Hauer SSP2
- Today (2025)
- 5,571,493 people
- By 2030
- 6,089,821 · +9.3%
- By 2040
- 7,142,806 · +28.2%
- By 2050
- 8,185,864 · +46.9%
- By 2075
- 10,574,329 · +89.8%
- By 2100
- 12,109,958 · +117.4%
Race, ethnicity, and origin ACS 2023
- Neighborhood character
- Highly diverse neighborhood (Simpson 0.71)
- Race & ethnicity
- Hispanic / Latino 45% Two or more races 22% White 19% Asian 17% Black 16%
- Hispanic origin (detail)
- Mexican 37%
- Common ancestry
- Lithuanian 2% Italian 2% Romanian 1%
- Foreign-born
- 23% · Canada, Vietnam, China
- Languages at home
- 53% English-only · Spanish 33% Vietnamese 7% Other Indo-European 1%
Political lean MEDSL · Harris
- 2024 margin
- Lean D (+5.5) · D 52.0% · R 46.4% · Other 1.6%
- 2008→2024 swing
- +3.9pp toward D · 2008: 1.6pp · 2024: 5.5pp
- All cycles
- 2024: D+5.5 2020: D+13.3 2016: D+12.4 2012: D+0.1 2008: D+1.6
Not yet ingested
- Civics
- —
Market trends
- HPI YoY
- ▼ -156.31%
- Current HPI
- 249.5438
- Rent YoY
- ▲ 3.48%
- Metro
- Houston-The Woodlands-Sugar Land, TX
- State GDP YoY
- ▲ 3.95%
- F500 in state
- 110
Industry mix (Fortune 500 HQ in TX)
| Industry | F500 HQs | Revenue |
|---|---|---|
| Energy | 16 | $1,198B |
|
||
| Technology | 5 | $198B |
|
||
| Engineering / Construction | 4 | $72B |
|
||
| Energy Services | 3 | $60B |
|
||
| Utilities | 3 | $41B |
|
||
| Healthcare | 2 | $330B |
|
||
Price history
4 events — show timeline
- 2026-05-10 Pending — HARMLS
- 2026-05-04 Pending — HARMLS
- 2026-04-23 Listed $212,000 HARMLS
- 1989-12-28 Sold (Public Records) — Public Records
Property tax history
+7.2%/yrLatest (2025): $5,605 · -0.1% YoY. Source: county tax records.
Cash-flow waterfall
monthlySold comps — $/sqft
last 12 mo · ≤1 miLoading sold comps…