 Triplex
1103-1107 Logan Ave · Waterloo, IA
Flood risk 5/10 · Moderate
- FEMA flood zone
- X
- Chance of flooding over 30 yrs
- 0.49%
- Est. flood insurance / yr
- $507 – $1,088
Fire risk 1/10 · Minimal
- Est. fire insurance / yr
- $902 – $1,676
Heat risk 3/10 · Minor
- Hot days now (above 101°F)
- 7 days/yr
- Hot days in 30 yrs
- 16 days/yr
Wind risk 2/10 · Minimal
- Chance of severe wind over 30 yrs
- —
Air-quality risk 1/10 · Minimal
- Unhealthy air days now
- 0 days/yr
- Unhealthy air days in 30 yrs
- 0 days/yr
Risk factors via First Street. Map © Google.
Why this score? — see what drove the C+ grade
The composite is a weighted blend of 9 inputs, each scored 0–100. Each bar is that input's sub-score; the figure is the points it added to the 100-point composite (weight × sub-score).
- Cash flow +30.0/30.0
- 1% rule +10.0/10.0
- DSCR +10.0/10.0
- Schools +4.4/10.0
- Rent growth +4.2/5.0
- Livability +4.0/5.0
- Condition / age +2.2/5.0
- ARV discount +0.0/15.0
- Appreciation +0.0/10.0
$138,500
🖨 Deal sheet (PDF) 📄 Offer letter ✓ Due diligence
Multi-family units
County records classify this as Multi-Family (2-4 Unit). Listing-text estimate: 3 units. confirmed
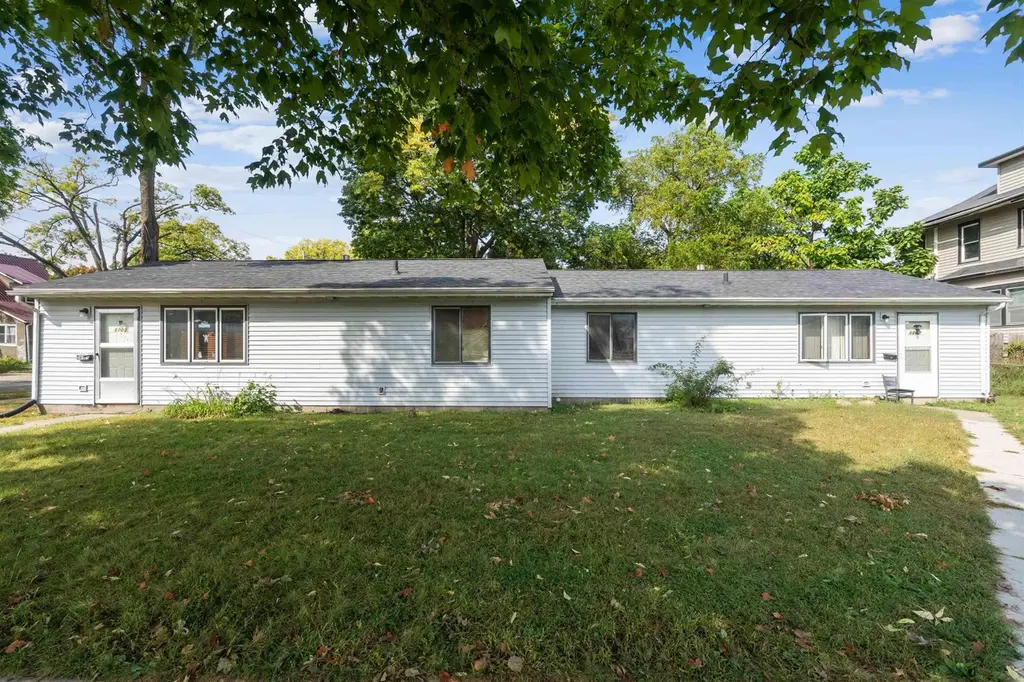
Listing remarks MLS
Great investment opportunity in a ranch style duplex! Two bedroom, one bathroom, living room, kitchen, 12x14 concrete patio each unit. Nice corner lot location in a quiet neighborhood. 1103 rent is $660/month 1107 rent is $675/month, both section 8 tenants. Would make for a great investment! Schedule your showing today!
Key facts
- Concrete patio
- Quiet neighborhood
- Ranch style duplex
Tags
Neighborhood map
What this means for you Summary
Snapshot
- This is a 3 × 2-bed/1-bath units multifamily listed at $138k. Condition is rated fair.
Deal economics
- At list price, monthly cash flow is $973 ($12k/yr) — positive. Per door: $324/mo.
- The deal already cash-flows at list — no discount required.
- Meets the 1% rule at list price ($2k rent vs $138k).
- Recommended offer: $122k (12.0% below list) — sets the bar for market timing.
- Cap rate 14.7% vs local median 4.2% in Waterloo — top-decile yield for the area; either an underpriced asset or a hidden risk that comps aren't pricing in. Stress-test before assuming the spread holds.
Location & tenants
- Location reads 81/100 on livability (#74 in IA, #1,589 nationally) — a professional / high-income tenant draw. Strengths: commute A+, cost of living A+, housing A+; Watch: schools C-, crime F, employment D-.
- Waterloo Community School District (urban): math 50% / reading 54% proficiency, ranked #276 of 289 in IA (top 96%) — acceptable for families but not a draw, mixed tenant base, ~2y average lease.
- Market conditions: Rents rising fast (+6.7%/yr); 98 active listings in the ZIP; 14 comparable units currently listed for rent nearby; rentals at typical pace (median 22d on market — plan ~3-4 weeks tenant-placement turnaround); 43% of comp listings sitting > 30 days — soft ceiling on asking rent; 287 units permitted in Black Hawk County in 2024 (67 in 5+ unit buildings).
- At $2,443/mo this rent would consume 59% of the median local household income ($50k/yr) (locally 871% of renters already pay >50% of income on rent) — very limited rent-growth headroom before tenants either downsize or default.
Forward outlook
- Local home prices are declining (-3.0%/yr); year-one equity from $958 of loan paydown is wiped out by about $4k of value loss. Plan a longer hold.
- Black Hawk County population projected at +10% by 2050 — modest demand growth; plan on rents tracking national, not racing it.
- At projected returns (-3.0% appreciation + 6.7% rent growth), your $39k cash investment doubles in ~4 years — after that, you're playing with house money.
Negotiation context
- It's been on market 235 days — a 12% lower offer ($122k) is reasonable based on typical stale-listing flexibility.
Risks & watch-outs
- Climate carrying-cost: moderate flood risk — expect insurance premiums to compound above CPI over the hold.
Questions for the listing agent
- It's been on market 235 days. Have you received any prior offers? Is the seller open to a 12% concession, seller financing, or rate buy-down credit?
- Can we see the unit-by-unit rent roll, current vacancy, and any below-market leases? What's the average tenancy length?
- What capital expenditures (roof, boiler, parking lot, exteriors) have been made in the last 5 years, and what's planned in the next 2?
- Have any recent inspections been done? Can we get a copy of the seller's disclosures and any deferred-maintenance estimates?
- Why hasn't it sold? Are there any deal-killer items the seller is aware of (foundation, flood, title, zoning, code violations)?
- Is there a deadline driving the sale (1031 exchange, divorce, estate, relocation)? That informs how much negotiation room exists.
- Crime grade is F in this area — have there been break-ins, vandalism, or insurance claims at this property in the last 3 years? What carrier currently insures it and at what premium?
- What's the average days-on-market for RENTAL listings here right now (not sales)? A rising rental-DOM trend means longer vacancies and softer asking-rent achievability than the comps imply.
- What's the recent tenant-quality profile in this submarket — average credit score on applications, eviction rate, late-payment / NSF rate, and stable-employment percentage? A property-management company in the area should have these aggregated.
- How much new apartment / multifamily construction is in the pipeline within 1–3 miles? Heavy new supply (>2% of stock underway) typically softens rents 12–24 months out; light construction supports rent growth.
Investment metrics
- 1% rule
- 1.76% ✓
- Cap rate
- 14.72%
- Cash-on-cash
- 30.10%
- DSCR
- 2.34
- GRM
- 4.7
CMA / ARV
- ARV (median comp)
- $94,257
- List price
- $138,500
- Delta
- 46.94%
- Verdict
- OVERPRICED
- Comps
- 13 within 1.0 mi
Show comp detail 3 sales within ~0.75 mi
| Address | Dist | Beds/Ba | Sqft | Sold | Price | $/sf | Match |
|---|---|---|---|---|---|---|---|
| 1103-1107 Logan Ave | 0.00mi | —/— | 1,728 (0%) | 0mo | $127,000 | $73 | 100 |
| 1123-1125 N Barclay St | 0.51mi | —/— | 1,752 (+1%) | 9mo | $65,000 | $37 | 66 |
| 52 Franklin St | 0.74mi | 2/2.0 | 1,616 (-6%) | 21mo | $34,000 | $21 | 37 |
Match score weights: distance 35% · size 25% · config 20% · recency 20%. Top-matched comps best support the ARV.
Projected returns pro-forma
-3.0% appreciation · 6.67% rent growth · sell at horizon
- IRR
- 28.8%
- Equity multiple
- 2.26×
- Total profit
- $48,907
- Equity at exit
- $20,651
- IRR
- 38.3%
- Equity multiple
- 5.23×
- Total profit
- $163,916
- Equity at exit
- $11,975
Cash invested: $38,780 (down + closing). Projections, not guarantees.
Landlord ↔ Tenant lean methodology
- Overall (STATE)
- 83 Strongly Landlord-Friendly
- State Iowa
- 83 Strongly Landlord-Friendly · R+6
- County
- — inherits STATE
- City
- — inherits STATE
ZIP-level market 50703
- Rents YoY
- 6.7%
- Active inventory
- 98
- Price-to-rent
- 14.2×
Monthly cashflow live
- Estimated rent
- $2,443 high interval (Pro) →
- Mortgage (P&I)
- −$726
- Tax est. 1.5%
- −$173 /mo · $2,078/yr
- Insurance
- −$58
- HOA
- −$0
- Vacancy / Maint / Mgmt
- −$513
- Net cashflow
- $973
Break-even live
Sensitivity live
| Price | -10% $1,069 | -5% $1,021 | +0% $973 | +5% $925 | +10% $877 |
|---|---|---|---|---|---|
| Rent | -10% $780 | -5% $876 | +0% $973 | +5% $1,069 | +10% $1,166 |
| Rate | -1.0pp $1,043 | -0.5pp $1,008 | base $973 | +0.5pp $937 | +1.0pp $900 |
3-unit breakdown (identical units grouped — click to expand)
| Units | Beds | Baths | Est. rent |
|---|---|---|---|
| 3× units | 2 | 1 | $2,442 |
| #1 | 2 | 1 | $814 |
| #2 | 2 | 1 | $814 |
| #3 | 2 | 1 | $814 |
| Total (3 units) | $2,443 | ||
UW: 25.0% down · 7.5% · 30yr · 1.5% tax · 5.0% vac · 8.0% maint · 8.0% mgmt
Financing live
Cash to close
- Down payment
- $34,625
- Closing costs
- $4,155
- Reserves months
- —
- Total cash needed
- —
Loan-product check · same deal, 3 products live
Conventional
25% down · 7.5% · 30yr
- Down + closing
- —
- Monthly P&I
- —
- Monthly cashflow
- —
- DSCR
- —
- Eligible?
- —
Personal DTI + credit; lowest rate.
DSCR
20% down · 8.5% · 30yr
- Down + closing
- —
- Monthly P&I
- —
- Monthly cashflow
- —
- DSCR
- —
- Eligible?
- —
No personal income docs; deal must DSCR.
Hard money
10% down · 12.0% · 12mo
- Down + closing
- —
- Monthly P&I
- —
- Monthly cashflow
- —
- DSCR
- —
- Eligible?
- —
Short-term bridge; refi at stabilization.
Rent comps 14 comps
| Address | Beds | Baths | Sqft | Rent | $/sqft | DOM | Units | Dist |
|---|---|---|---|---|---|---|---|---|
| 440 Cutler St Waterloo, IA | 3.0 | 1.5 | 1566 | $1,200 | $0.77 | 21d | 1 | 0.14mi |
| 203 Reed St Waterloo, IA | 3.0 | 1.5 | 1492 | $1,200 | $0.80 | 21d | 1 | 0.18mi |
| 1125 Ackermant St Waterloo, IA | 3.0 | 2.0 | 1202 | $1,100 | $0.92 | 21d | 1 | 0.33mi |
| 214 Edwards St Waterloo, IA | 3.0 | 1.0 | 1150 | $825 | $0.72 | 21d | 1 | 0.40mi |
| 401 Charles St Waterloo, IA | 3.0 | 1.0 | 1276 | $995 | $0.78 | 44d | 1 | 0.45mi |
| 311 E 3rd St Waterloo, IA | 2.0 | 2.0 | 1154 | $1,500 | $1.30 | 21d | 1 | 1.04mi |
| 919 Oneida St Waterloo, IA | 3.0 | 1.0 | 1144 | $930 | $0.81 | 44d | 1 | 1.13mi |
| 45 W Jefferson St Waterloo, IA | 1.0–2.0 | 1.0–2.0 | 1062 | $1,750 | $1.65 | 21d | 9 | 1.30mi |
| 910 Mulberry St Apt 3 Waterloo, IA | 2.0 | 1.0 | 1064 | $695 | $0.65 | 21d | 1 | 1.34mi |
| 824 Sycamore St Unit 824-09 Waterloo, IA | 2.0 | 2.0 | 1054 | $1,250 | $1.19 | 44d | 1 | 1.42mi |
| 920-928 Sycamore St Unit 920-07 Waterloo, IA | 2.0 | 2.0 | 1054 | $1,250 | $1.19 | 44d | 1 | 1.45mi |
| 1107 Mulberry St Waterloo, IA | 3.0 | 1.0 | 1248 | $950 | $0.76 | 21d | 1 | 1.45mi |
| 924 Sycamore St #1 Waterloo, IA | 2.0 | 2.0 | 1054 | $1,250 | $1.19 | 44d | 1 | 1.47mi |
| 223 W 4th St Ste 203 Waterloo, IA | 2.0 | 1.5 | 1466 | $1,250 | $0.85 | 44d | 1 | 1.49mi |
Listing history 5 events
-
2026-05-12status Pending 321-char remark
Show marketing remark (321 chars)
Great investment opportunity in a ranch style duplex! Two bedroom, one bathroom, living room, kitchen, 12x14 concrete patio each unit. Nice corner lot location in a quiet neighborhood. 1103 rent is $660/month 1107 rent is $675/month, both section 8 tenants. Would make for a great investment! Schedule your showing today!
-
2026-04-27price $138,500 321-char remark
Show marketing remark (321 chars)
Great investment opportunity in a ranch style duplex! Two bedroom, one bathroom, living room, kitchen, 12x14 concrete patio each unit. Nice corner lot location in a quiet neighborhood. 1103 rent is $660/month 1107 rent is $675/month, both section 8 tenants. Would make for a great investment! Schedule your showing today!
-
2026-01-22price $142,500 321-char remark
Show marketing remark (321 chars)
Great investment opportunity in a ranch style duplex! Two bedroom, one bathroom, living room, kitchen, 12x14 concrete patio each unit. Nice corner lot location in a quiet neighborhood. 1103 rent is $660/month 1107 rent is $675/month, both section 8 tenants. Would make for a great investment! Schedule your showing today!
-
2025-10-24price $148,500 321-char remark
Show marketing remark (321 chars)
Great investment opportunity in a ranch style duplex! Two bedroom, one bathroom, living room, kitchen, 12x14 concrete patio each unit. Nice corner lot location in a quiet neighborhood. 1103 rent is $660/month 1107 rent is $675/month, both section 8 tenants. Would make for a great investment! Schedule your showing today!
-
2025-09-19$152,500 Active 321-char remark
Show marketing remark (321 chars)
Great investment opportunity in a ranch style duplex! Two bedroom, one bathroom, living room, kitchen, 12x14 concrete patio each unit. Nice corner lot location in a quiet neighborhood. 1103 rent is $660/month 1107 rent is $675/month, both section 8 tenants. Would make for a great investment! Schedule your showing today!
ⓘ Source: listings_history table (triggers on properties + properties_extension) + one-shot
backfill from property_details.listing_events for pre-trigger history.
Climate risk First Street
- Flood 5/10 Major FEMA zone X · 49% chance over 30 yrs
- Wildfire 1/10 Low
- Heat 3/10 Moderate 7 d/yr ≥101°F today · 16 d/yr by 30 yrs out
- Wind 2/10 Low
- Air quality 1/10 Low 0 unhealthy d/yr today · 0 by 30 yrs out
Nearby sold comps map
Loading sold comps map…
Walkable amenities ~0.75 mi
Loading nearby amenities…
Taxation est. · year 1
- Rental income
- $29,316
- − Mortgage interest
- −$7,758
- − Property taxes
- −$2,078
- − Insurance
- −$692
- − Repairs & maintenance
- −$2,345
- − Management
- −$2,345
- − Depreciation
- −$4,029
- Taxable income
- $10,068
- Est. tax owed @ 24.0%
- −$2,416
- After-tax cash flow
- $9,258/yr
For passive investors: Depreciation is non-cash, so a rental often shows a tax loss while cash-flowing — sheltering income. Rental losses are passive: they offset passive income freely, and up to $25,000/yr can offset ordinary (W-2) income if you actively participate and your MAGI is under $100k (phasing out to $0 by $150k); unused losses carry forward. On sale, claimed depreciation is recaptured at up to 25%, and gains may owe capital-gains tax (a 1031 exchange can defer both). Figures are a year-1 estimate at your 24.0% rate — not tax advice; consult a CPA.
Condition & rehab AI · 12 photos
This two-unit property requires moderate rehabilitation, focusing on exterior repairs and painting to enhance its curb appeal and rental value.
Repairs flagged
- Major siding — Significant wear and tear
- Major exterior paint — Visible peeling and fading
Value-add opportunities
- Both paint exterior — Enhances curb appeal and value
- Both repair siding — Improves home's appearance and value
Renovation cost estimate screening
| Repair item | Severity | Est. cost |
|---|---|---|
| siding · Significant wear and tear | Major | $15,000–50,000 |
| exterior paint · Visible peeling and fading | Major | $15,000–50,000 |
| Total estimated repair cost · 2 items | $30,000–100,000 |
Value-add ROI direction
- Both paint exterior — Enhances curb appeal and value ↑
- Both repair siding — Improves home's appearance and value ↑
ⓘ Cost ranges are severity-bucket heuristics (US national rule-of-thumb). Get contractor quotes + a written scope before underwriting a rehab budget.
Schools (NCES district)
- District
- Waterloo Community School District
- NCES district ID
- 1930480
- Math proficiency
- 50% ▼ -4.00%
- Reading proficiency
- 54% ▲ 1.00%
- Median HH income
- $42,545
- Composite
- 43.72/100
- National rank
- #2950
- State rank
- #276 of 289 in IA
Livability — Waterloo
- Score
- 81/100
- State rank
- #74
- US rank
- #1589
Category grades
Schools grade is shown separately in the Schools card above.
Census & demographics
- Census place
- Waterloo, IA
- County
- Black Hawk County · 112,933 people
- City population
- 69,066
- Metro
- Waterloo-Cedar Falls, IA
- Population (ZIP)
- 17,952
- Household income
- $50,060
- Rent vs Own
- Severe rent burden
- 871.0
Population outlook (Black Hawk County) Hauer SSP2
- Today (2025)
- 139,716 people
- By 2030
- 142,853 · +2.2%
- By 2040
- 147,843 · +5.8%
- By 2050
- 153,247 · +9.7%
- By 2075
- 167,977 · +20.2%
- By 2100
- 177,320 · +26.9%
Race, ethnicity, and origin ACS 2023
- Neighborhood character
- Diverse neighborhood (Simpson 0.62)
- Race & ethnicity
- White 55% Black 26% Hispanic / Latino 10% Two or more races 7% Asian 2%
- Hispanic origin (detail)
- Mexican 6%
- Common ancestry
- Iranian 1% Portuguese 1% Lithuanian 1%
- Foreign-born
- 7% · Canada, Philippines, China
- Languages at home
- 89% English-only · Spanish 7% Other Asian/Pacific 2% Russian/Polish/Slavic 1%
Political lean MEDSL · Black Hawk
- 2024 margin
- Toss-up / Even · D 50.0% · R 48.8% · Other 1.2%
- 2008→2024 swing
- -21.3pp toward R · 2008: 22.4pp · 2024: 1.2pp
- All cycles
- 2024: D+1.2 2020: D+9.0 2016: D+7.3 2012: D+20.0 2008: D+22.4
Not yet ingested
- Civics
- —
Market trends
- HPI YoY
- ▼ -117.18%
- Current HPI
- 132.9478
- Rent YoY
- ▲ 6.67%
- Metro
- Waterloo-Cedar Falls, IA
- State GDP YoY
- ▲ 2.48%
- F500 in state
- 4
Industry mix (Fortune 500 HQ in IA)
| Industry | F500 HQs | Revenue |
|---|---|---|
| Financial Services | 1 | $16B |
|
||
| Retail / Convenience | 1 | $15B |
|
||
Price history
-9.2% since first listed5 events — show timeline
- 2026-05-12 Pending — NEIRBR as distributed by MLS GRID
- 2026-04-27 Price Changed $138,500 NEIRBR as distributed by MLS GRID
- 2026-01-22 Price Changed $142,500 NEIRBR as distributed by MLS GRID
- 2025-10-24 Price Changed $148,500 NEIRBR as distributed by MLS GRID
- 2025-09-19 Listed $152,500 NEIRBR as distributed by MLS GRID
Cash-flow waterfall
monthlySold comps — $/sqft
last 12 mo · ≤1 miLoading sold comps…