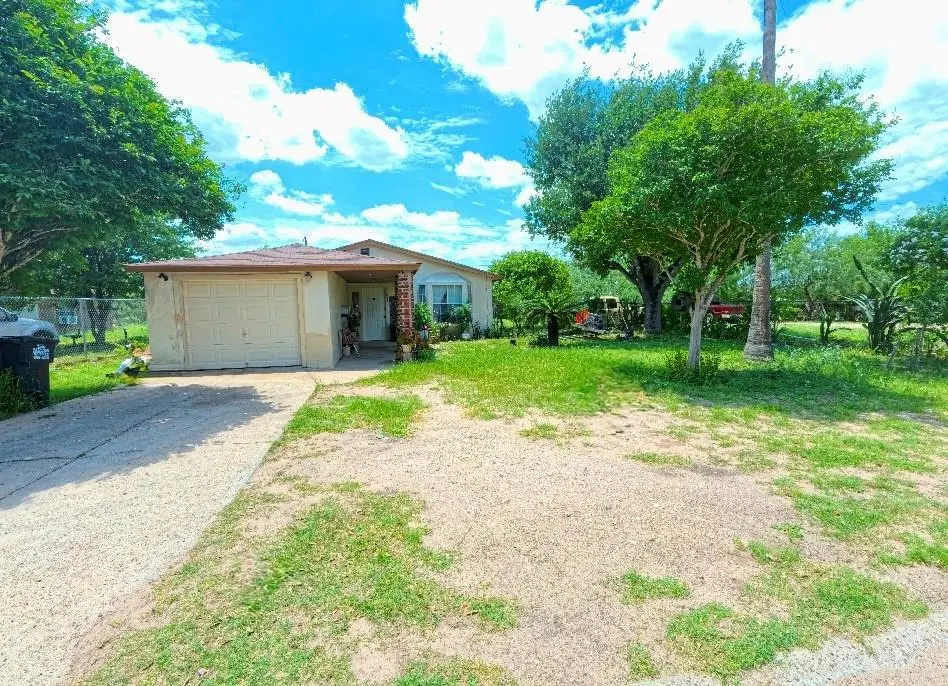
2801 Valencia Ave · La Homa, TX
Flood risk 1/10 · Minimal
- FEMA flood zone
- X
- Chance of flooding over 30 yrs
- 0.0%
- Est. flood insurance / yr
- $507 – $1,088
Fire risk 7/10 · Major
- Est. fire insurance / yr
- $1,222 – $2,270
Heat risk 9/10 · Severe
- Hot days now (above 112°F)
- 7 days/yr
- Hot days in 30 yrs
- 22 days/yr
Wind risk 8/10 · Major
- Chance of severe wind over 30 yrs
- 96.0%
Air-quality risk 2/10 · Minimal
- Unhealthy air days now
- 0 days/yr
- Unhealthy air days in 30 yrs
- 1 days/yr
Risk factors via First Street. Map © Google.
Why this score? — see what drove the D+ grade
The composite is a weighted blend of 9 inputs, each scored 0–100. Each bar is that input's sub-score; the figure is the points it added to the 100-point composite (weight × sub-score).
- Cash flow +16.0/30.0
- ARV discount +12.6/15.0
- DSCR +4.9/10.0
- 1% rule +4.8/10.0
- Livability +2.8/5.0
- Rent growth +2.5/5.0
- Condition / age +2.5/5.0
- Schools +1.9/10.0
- Appreciation +0.0/10.0
$139,995
🖨 Deal sheet 📄 Offer letter ✓ Due diligence
Listing remarks
This 3-bedroom, 2.5-bathroom home situated on a generous half-acre lot offers a prime opportunity for investors or buyers looking to customize a property from the ground up. The residence features a functional layout with plenty of interior potential, while the expansive outdoor space provides rare flexibility for future additions, workshops, or landscaping projects. Being sold strictly as-is, this fixer-upper is priced to reflect its current condition, allowing the next owner to bring their vision to life and build immediate equity. Opportunities to secure this much land in a central location are increasingly hard to find, making this a must-see for those ready for their next project. Brin
Key facts
- Half-acre lot
- Central location
- 0.5 acre lot
Tags
Property features AI
Finance
- HOA & community: No homeowners association
Exterior
- Parking: Attached garage (1 car); 1 total covered parking space
- Utilities: Public water; City sewer
- Home design: Single-family property (detached); Shingle roof
- Construction: Brick, stucco, and wood siding construction; Slab foundation
- Exterior features: Partial fencing; Paved road access; Detached quarters on the property
Interior
- Kitchen: Electric water heater; No conveying appliances
- Flooring: Other flooring
- Bathrooms: 2 full bathrooms; 1 half bathroom
- Interior features: Countertops: other; No window coverings
- Laundry & utility: Laundry area located in the garage
Neighborhood map
What this means for you Summary
Snapshot
- This is a 3-bed/1.0-bath single-family listed at $140k.
Deal economics
- At list price, monthly cash flow is $69 ($829/yr) — positive.
- The deal already cash-flows at list — no discount required.
- To meet the 1% rule (rent ≥ 1% of price), the offer needs to be $137k (1.8% below list).
- Recommended offer: $136k (3.0% below list) — sets the bar for market timing.
- Cap rate 6.9% vs local median 5.5% in La Homa — meaningfully above typical; check what's discounted (condition, days-on-market, listing class) to confirm the premium yield is real.
Location & tenants
- Location reads 56/100 on livability (#1,308 in TX) — a working-class tenant base; expect higher turnover. Strengths: cost of living A+, housing A-; Watch: crime F, amenities F, commute F.
- La Joya ISD (suburban): math 18% / reading 29% proficiency, ranked #759 of 826 in TX (top 92%) — low school quality limits family demand, transient renter base, plan for 1-2y turnover.
- Zoned schools: Diaz-Villarreal El (math 17% / reading 18%, grade F, #3,805 of 4,322 statewide, top 89%, 594 students, 97% FRL); Domingo Trevino Middle (math 10% / reading 22%, grade F, #1,543 of 1,662 statewide, top 94%, 623 students, 99% FRL); Juarez-Lincoln H S (math 10% / reading 20%, grade F, #1,507 of 1,632 statewide, top 93%, 2,062 students, 99% FRL) — zoned schools average 98% FRL vs 54% district-wide (45 pts higher); higher-poverty schools than district average — tighter screening recommended.
- Market conditions: 474 active listings in the ZIP; 3 comparable units currently listed for rent nearby; rentals lingering (median 44d on market — plan ~5-8 weeks vacancy on turnover, expect pricing pressure); 67% of comp listings sitting > 30 days — soft ceiling on asking rent; 7,378 units permitted in Hidalgo County in 2024 (641 in 5+ unit buildings).
- This rent runs 31% of the median local income ($52k/yr) — at the standard rent-burdened threshold; future hikes will face affordability resistance.
Forward outlook
- Local home prices are declining (-3.0%/yr); year-one equity from $968 of loan paydown is wiped out by about $4k of value loss. Plan a longer hold.
- Hidalgo County population projected at +28% by 2050 — long-run rental-demand tailwind backs the buy-and-hold thesis.
Negotiation context
- It's been on market 44 days — a 3% lower offer ($136k) is reasonable based on typical stale-listing flexibility.
- Current owner paid $11k; list at $140k implies a 1128% gain — meaningful room to come down on a strong offer.
Risks & watch-outs
- Climate carrying-cost: severe wind risk, 96% chance of damaging wind over 30y; major wildfire risk; extreme-heat days projected 7→22/yr by 2055 (HVAC capex compounding) — expect insurance premiums to compound above CPI over the hold.
Questions for the listing agent
- It's been on market 44 days. Have you received any prior offers? Is the seller open to a 3% concession, seller financing, or rate buy-down credit?
- Is there a deadline driving the sale (1031 exchange, divorce, estate, relocation)? That informs how much negotiation room exists.
- Schools are F-rated, which usually means shorter tenancies and higher turnover. Who's the typical renter profile here, and what's been the actual vacancy rate?
- Crime grade is F in this area — have there been break-ins, vandalism, or insurance claims at this property in the last 3 years? What carrier currently insures it and at what premium?
- The area grade is low — what's the realistic commute time and amenity access for the typical tenant pool here? Any planned neighborhood developments (good or bad) we should know about?
- What's the average days-on-market for RENTAL listings here right now (not sales)? A rising rental-DOM trend means longer vacancies and softer asking-rent achievability than the comps imply.
- What's the recent tenant-quality profile in this submarket — average credit score on applications, eviction rate, late-payment / NSF rate, and stable-employment percentage? A property-management company in the area should have these aggregated.
- How much new for-sale + rental construction is in the pipeline within 1–3 miles? Heavy new supply typically softens prices + rents 12–24 months out; constrained supply supports both.
Investment metrics
- 1% rule
- 0.98% ✗
- Cap rate
- 6.89%
- Cash-on-cash
- 2.11%
- DSCR
- 1.09
- GRM
- 8.5
CMA / ARV
- ARV (median comp)
- $157,984
- List price
- $139,995
- Delta
- -11.39%
- Verdict
- UNDERPRICED
- Comps
- 18 within 1.0 mi
Show comp detail 2 sales within ~0.75 mi
| Address | Dist | Beds/Ba | Sqft | Sold | Price | $/sf | Match |
|---|---|---|---|---|---|---|---|
| 3408 Janie St | 0.42mi | 2/5.5 (-1) | 1,268 (+1%) | 6mo | $110,000 | $87 | 54 |
| 2510 Venecia Dr | 0.54mi | 2/2.0 (-1) | 1,122 (-10%) | 14mo | $100,000 | $89 | 37 |
Match score weights: distance 35% · size 25% · config 20% · recency 20%. Top-matched comps best support the ARV.
Projected returns pro-forma
-3.0% appreciation · 3.0% rent growth · sell at horizon
- IRR
- -12.9%
- Equity multiple
- 0.53×
- Total profit
- $-18,234
- Equity at exit
- $20,874
- IRR
- -3.8%
- Equity multiple
- 0.74×
- Total profit
- $-10,006
- Equity at exit
- $12,104
Cash invested: $39,199 (down + closing). Projections, not guarantees.
Landlord ↔ Tenant lean methodology
- Overall (STATE)
- 87 Strongly Landlord-Friendly
- State Texas
- 87 Strongly Landlord-Friendly · R+5
- County
- — inherits STATE
- City
- — inherits STATE
ZIP-level market 78574
- Home prices YoY
- -16.1%
- Active inventory
- 474
- Price-to-rent
- 8.5×
Monthly cashflow live
- Estimated rent
- $1,374 medium interval (Pro) →
- Mortgage (P&I)
- −$734
- Tax from tax record
- −$224 /mo · $2,689/yr
- Insurance
- −$58
- HOA
- −$0
- Vacancy / Maint / Mgmt
- −$289
- Net cashflow
- $69
Break-even live
UW: 25.0% down · 7.5% · 30yr · 1.5% tax · 5.0% vac · 8.0% maint · 8.0% mgmt
Financing live
Cash to close
- Down payment
- $34,999
- Closing costs
- $4,200
- Reserves months
- —
- Total cash needed
- —
Loan-product check · same deal, 3 products live
Conventional
25% down · 7.5% · 30yr
- Down + closing
- —
- Monthly P&I
- —
- Monthly cashflow
- —
- DSCR
- —
- Eligible?
- —
Personal DTI + credit; lowest rate.
DSCR
20% down · 8.5% · 30yr
- Down + closing
- —
- Monthly P&I
- —
- Monthly cashflow
- —
- DSCR
- —
- Eligible?
- —
No personal income docs; deal must DSCR.
Hard money
10% down · 12.0% · 12mo
- Down + closing
- —
- Monthly P&I
- —
- Monthly cashflow
- —
- DSCR
- —
- Eligible?
- —
Short-term bridge; refi at stabilization.
Rent comps 3 comps
| Address | Beds | Baths | Sqft | Rent | $/sqft | DOM | Units | Dist |
|---|---|---|---|---|---|---|---|---|
| 6505 Lima Ln Unit 3 Mission, TX | 2.0 | 2.0 | 981 | $785 | $0.80 | 43d | 1 | 0.35mi |
| 1413 N Inspiration Blvd Unit 200 Alton, TX | 2.0 | 2.0 | 1050 | $950 | $0.90 | 43d | 1 | 0.78mi |
| 1413 N Inspiration Blvd Alton, TX | 2.0 | 2.0 | 1050 | $950 | $0.90 | 23d | 1 | 0.78mi |
Listing history 19 events
-
2026-06-18days on market $139,995 Active 44 DOM
-
2026-06-17days on market $139,995 Active 43 DOM
-
2026-06-16days on market $139,995 Active 42 DOM
-
2026-06-15days on market $139,995 Active 41 DOM
-
2026-06-14days on market $139,995 Active 39 DOM
-
2026-06-13days on market $139,995 Active 38 DOM
-
2026-06-10pricedays on market $139,995 Active 36 DOM
-
2026-06-09days on market $145,000 Active 35 DOM
-
2026-06-08days on market $145,000 Active 34 DOM
-
2026-06-07days on market $145,000 Active 33 DOM
-
2026-06-05days on market $145,000 Active 30 DOM
-
2026-06-03days on market $145,000 Active 29 DOM
-
2026-06-02days on market $145,000 Active 28 DOM
-
2026-06-01days on market $145,000 Active 27 DOM
-
2026-05-31days on market $145,000 Active 26 DOM
-
2026-05-31days on market $145,000 Active 25 DOM
-
2026-05-05$145,000 Active 753-char remark
-
2004-12-06soldstatus
-
1996-12-10soldstatus $11,400
ⓘ Source: listings_history table (triggers on properties + properties_extension) + one-shot
backfill from property_details.listing_events for pre-trigger history.
Tax reassessment forecast TX · Resets to sale price
- Current annual tax
- $2,689 · $224/mo
- Projected year-2 tax
- $2,689 · $224/mo
- Expected delta
- $0/yr ($0/mo · 0.0%)
ⓘ Screening estimate from a state-policy table — verify with the county assessor before closing.
Climate risk First Street
- Flood 1/10 Low FEMA zone X · 0% chance over 30 yrs
- Wildfire 7/10 Severe
- Heat 9/10 Extreme 7 d/yr ≥112°F today · 22 d/yr by 30 yrs out
- Wind 8/10 Severe 96% chance of damaging wind over 30 yrs
- Air quality 2/10 Low 0 unhealthy d/yr today · 1 by 30 yrs out
Nearby sold comps map
Loading sold comps map…
Walkable amenities ~0.75 mi
Loading nearby amenities…
Taxation est. · year 1
- Rental income
- $16,491
- − Mortgage interest
- −$7,842
- − Property taxes
- −$2,689
- − Insurance
- −$700
- − Repairs & maintenance
- −$1,319
- − Management
- −$1,319
- − Depreciation
- −$4,073
- Taxable loss
- −$1,451
- Est. tax savings @ 24.0%
- +$348
- After-tax cash flow
- $1,177/yr
For passive investors: Depreciation is non-cash, so a rental often shows a tax loss while cash-flowing — sheltering income. Rental losses are passive: they offset passive income freely, and up to $25,000/yr can offset ordinary (W-2) income if you actively participate and your MAGI is under $100k (phasing out to $0 by $150k); unused losses carry forward. On sale, claimed depreciation is recaptured at up to 25%, and gains may owe capital-gains tax (a 1031 exchange can defer both). Figures are a year-1 estimate at your 24.0% rate — not tax advice; consult a CPA.
Schools (NCES district)
- District
- La Joya ISD
- NCES district ID
- 4826130
- Math proficiency
- 18% ▼ -35.00%
- Reading proficiency
- 29% ▼ -10.00%
- Median HH income
- $27,845
- Composite
- 18.65/100
- National rank
- #8891
- State rank
- #759 of 826 in TX
Livability — La Homa
- Score
- 56/100
- State rank
- #1308
- US rank
- #22643
Category grades
Schools grade is shown separately in the Schools card above.
Census & demographics
- Census place
- La Homa, TX
- County
- Hidalgo County · 623,128 people
- City population
- 62,456
- Metro
- McAllen-Edinburg-Mission, TX
- Population (ZIP)
- 62,456
- Household income
- $52,393
- Rent vs Own
- Severe rent burden
- 803.0
Population outlook (Hidalgo County) Hauer SSP2
- Today (2025)
- 955,232 people
- By 2030
- 1,009,774 · +5.7%
- By 2040
- 1,120,332 · +17.3%
- By 2050
- 1,225,036 · +28.2%
- By 2075
- 1,439,189 · +50.7%
- By 2100
- 1,533,429 · +60.5%
Race, ethnicity, and origin ACS 2023
- Neighborhood character
- Predominantly Hispanic (97%)
- Race & ethnicity
- Hispanic / Latino 97% Two or more races 62% White 2%
- Hispanic origin (detail)
- Mexican 93%
- Foreign-born
- 33% · Canada
- Languages at home
- 12% English-only · Spanish 87%
Political lean MEDSL · Hidalgo
- 2024 margin
- Toss-up / Even · D 48.1% · R 51.0%
- 2008→2024 swing
- -41.6pp toward R · 2008: 38.7pp · 2024: -2.9pp
- All cycles
- 2024: R+2.9 2020: D+17.1 2016: D+40.5 2012: D+41.8 2008: D+38.7
Not yet ingested
- Civics
- —
Market trends
- HPI YoY
- ▼ -44.13%
- Current HPI
- 230.3323
- Rent YoY
- —
- Metro
- McAllen-Edinburg-Mission, TX
- State GDP YoY
- ▲ 3.95%
- F500 in state
- 110
Industry mix (Fortune 500 HQ in TX)
| Industry | F500 HQs | Revenue |
|---|---|---|
| Energy | 16 | $1,198B |
|
||
| Technology | 5 | $198B |
|
||
| Engineering / Construction | 4 | $72B |
|
||
| Energy Services | 3 | $60B |
|
||
| Utilities | 3 | $41B |
|
||
| Healthcare | 2 | $330B |
|
||
Price history
+1128.0% since first listed4 events — show timeline
- 2026-06-09 Price Changed $139,995 MCALLENMLS
- 2026-05-05 Listed $145,000 MCALLENMLS
- 2004-12-06 Sold (Public Records) — Public Records
- 1996-12-10 Sold (Public Records) $11,400 Public Records
Property tax history
+7.6%/yrLatest (2025): $2,689 · +16.9% YoY. Source: county tax records.
Cash-flow waterfall
monthlySold comps — $/sqft
last 12 mo · ≤1 miLoading sold comps…