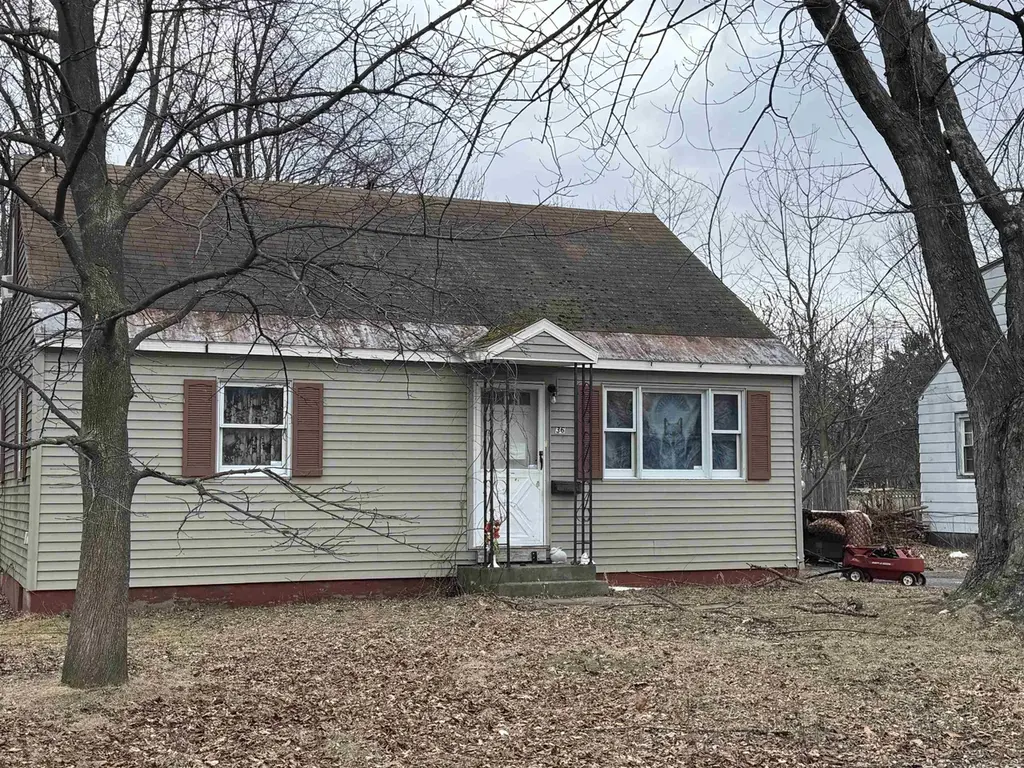
36 Vest Haven Dr · Burlington, VT
Flood risk 1/10 · Minimal
- FEMA flood zone
- X (unshaded)
- Chance of flooding over 30 yrs
- 0.0%
- Est. flood insurance / yr
- $473 – $860
Fire risk 1/10 · Minimal
- Est. fire insurance / yr
- $480 – $892
Heat risk 3/10 · Minor
- Hot days now (above 93°F)
- 7 days/yr
- Hot days in 30 yrs
- 15 days/yr
Wind risk 2/10 · Minimal
- Chance of severe wind over 30 yrs
- 1.0%
Air-quality risk 2/10 · Minimal
- Unhealthy air days now
- 1 days/yr
- Unhealthy air days in 30 yrs
- 1 days/yr
Risk factors via First Street. Map © Google.
Why this score? — see what drove the C+ grade
The composite is a weighted blend of 9 inputs, each scored 0–100. Each bar is that input's sub-score; the figure is the points it added to the 100-point composite (weight × sub-score).
- Cash flow +20.0/30.0
- ARV discount +15.0/15.0
- DSCR +6.3/10.0
- 1% rule +5.3/10.0
- Schools +5.0/10.0
- Livability +3.7/5.0
- Rent growth +2.5/5.0
- Condition / age +2.5/5.0
- Appreciation +0.0/10.0
$265,000
🖨 Deal sheet (PDF) 📄 Offer letter ✓ Due diligence
Listing remarks MLS
Burlington home features 3 beds, 1 bath on . 16 acres nestled on a quiet street in the New North End. Close proximity to Burlington Bike Path, Beaches & shops. This property is occupied. Do not approach property, trespass or disturb occupants . The property is now active in online auction.
Key facts
- 6,969 sq ft lot
- Built 1957
- Listed 154 days
Neighborhood map
What this means for you Summary
Snapshot
- This is a 3-bed/1.0-bath single-family listed at $265k.
Deal economics
- At list price, monthly cash flow is $323 ($4k/yr) — positive.
- The deal already cash-flows at list — no discount required.
- Meets the 1% rule at list price ($3k rent vs $265k).
- Recommended offer: $233k (12.0% below list) — sets the bar for market timing.
- Cap rate 7.8% vs local median 3.2% in Burlington — top-decile yield for the area; either an underpriced asset or a hidden risk that comps aren't pricing in. Stress-test before assuming the spread holds.
Location & tenants
- Location reads 74/100 on livability (#19 in VT, #4,619 nationally) — a middle-class / working-renter tenant base. Strengths: commute A+, health & safety A+, employment B; Watch: cost of living D, crime F, amenities F.
- Zoned schools: J. J. Flynn School (math 27% / reading 42%, grade F, #123 of 192 statewide, top 66%, 327 students, 54% FRL); Edmunds Middle School (math 42% / reading 57%, grade C, #8 of 26 statewide, top 32%, 365 students, 50% FRL); Burlington High School (math 42% / reading 57%, grade D, #8 of 48 statewide, top 15%, 987 students, 48% FRL).
- Market conditions: 44 active listings in the ZIP; 4 comparable units currently listed for rent nearby; rentals lingering (median 46d on market — plan ~5-8 weeks vacancy on turnover, expect pricing pressure); 75% of comp listings sitting > 30 days — soft ceiling on asking rent; 898 units permitted in Chittenden County in 2024 (554 in 5+ unit buildings).
Forward outlook
- Local home prices are declining (-3.0%/yr); year-one equity from $2k of loan paydown is wiped out by about $8k of value loss. Plan a longer hold.
- Chittenden County population projected at +8% by 2050 — modest demand growth; plan on rents tracking national, not racing it.
Negotiation context
- It's been on market 154 days — a 12% lower offer ($233k) is reasonable based on typical stale-listing flexibility.
Risks & watch-outs
- Watch-outs: built in 1957 — expect roof / HVAC / electrical / plumbing capex.
Questions for the listing agent
- It's been on market 154 days. Have you received any prior offers? Is the seller open to a 12% concession, seller financing, or rate buy-down credit?
- Built in 1957 — when were the roof, HVAC, electrical panel, plumbing, and water heater last replaced?
- Why hasn't it sold? Are there any deal-killer items the seller is aware of (foundation, flood, title, zoning, code violations)?
- Is there a deadline driving the sale (1031 exchange, divorce, estate, relocation)? That informs how much negotiation room exists.
- Schools are B-rated — typically a magnet for longer-tenancy family renters. What's the average tenant stay here, and is there a school-zone premium baked into asking?
- Crime grade is F in this area — have there been break-ins, vandalism, or insurance claims at this property in the last 3 years? What carrier currently insures it and at what premium?
- What's the average days-on-market for RENTAL listings here right now (not sales)? A rising rental-DOM trend means longer vacancies and softer asking-rent achievability than the comps imply.
- What's the recent tenant-quality profile in this submarket — average credit score on applications, eviction rate, late-payment / NSF rate, and stable-employment percentage? A property-management company in the area should have these aggregated.
- How much new for-sale + rental construction is in the pipeline within 1–3 miles? Heavy new supply typically softens prices + rents 12–24 months out; constrained supply supports both.
Investment metrics
- 1% rule
- 1.03% ✓
- Cap rate
- 7.76%
- Cash-on-cash
- 5.22%
- DSCR
- 1.23
- GRM
- 8.1
CMA / ARV
- ARV (median comp)
- $427,237
- List price
- $265,000
- Delta
- -37.97%
- Verdict
- UNDERPRICED
- Comps
- 20 within 1.0 mi
Show comp detail 12 sales within ~0.75 mi
| Address | Dist | Beds/Ba | Sqft | Sold | Price | $/sf | Match |
|---|---|---|---|---|---|---|---|
| 94 Plattsburg Ave | 0.21mi | 3/1.0 | 1,488 (+6%) | 10mo | $355,000 | $239 | 72 |
| 1616 North Ave | 0.28mi | 3/1.0 | 1,369 (-2%) | 15mo | $420,000 | $307 | 71 |
| 2069 North Ave | 0.43mi | 3/2.5 | 1,447 (+3%) | 9mo | $465,000 | $321 | 62 |
| 1968 North Ave | 0.26mi | 4/2.0 (+1) | 1,360 (-3%) | 16mo | $430,000 | $316 | 60 |
| 45 Green Acres Dr | 0.58mi | 4/1.0 (+1) | 1,350 (-4%) | 3mo | $260,000 | $193 | 59 |
| 36 Plattsburg Ave | 0.31mi | 4/1.0 (+1) | 1,296 (-8%) | 14mo | $398,000 | $307 | 56 |
| 61 Cross Pkwy | 0.64mi | 3/1.0 | 1,479 (+5%) | 8mo | $367,000 | $248 | 54 |
| 171 Pleasant Ave | 0.69mi | 3/1.0 | 1,350 (-4%) | 17mo | $394,000 | $292 | 48 |
| 63 Birch Ct | 0.51mi | 4/1.5 (+1) | 1,208 (-14%) | 2mo | $450,000 | $373 | 44 |
| 32 Starr Farm Bch | 0.66mi | 4/1.0 (+1) | 1,448 (+3%) | 18mo | $465,000 | $321 | 44 |
| 1381 North Ave | 0.73mi | 3/1.0 | 1,276 (-9%) | 19mo | $440,000 | $345 | 35 |
| 49 Oakland Ter | 0.73mi | 3/1.5 | 1,210 (-14%) | 12mo | $515,000 | $426 | 31 |
Match score weights: distance 35% · size 25% · config 20% · recency 20%. Top-matched comps best support the ARV.
Projected returns pro-forma
-3.0% appreciation · 3.0% rent growth · sell at horizon
- IRR
- -8.2%
- Equity multiple
- 0.70×
- Total profit
- $-22,327
- Equity at exit
- $39,512
- IRR
- 1.4%
- Equity multiple
- 1.10×
- Total profit
- $7,234
- Equity at exit
- $22,912
Cash invested: $74,200 (down + closing). Projections, not guarantees.
Landlord ↔ Tenant lean methodology
- Overall (STATE)
- 41 Moderately Tenant-Leaning
- State Vermont
- 41 Moderately Tenant-Leaning · D+15
- County
- — inherits STATE
- City
- — inherits STATE
ZIP-level market 05408
- Active inventory
- 44
- Price-to-rent
- 8.1×
Monthly cashflow live
- Estimated rent
- $2,740 medium interval (Pro) →
- Mortgage (P&I)
- −$1,390
- Tax from tax record
- −$342 /mo · $4,099/yr
- Insurance
- −$110
- HOA
- −$0
- Vacancy / Maint / Mgmt
- −$575
- Net cashflow
- $323
Break-even live
Sensitivity live
| Price | -10% $473 | -5% $398 | +0% $323 | +5% $248 | +10% $173 |
|---|---|---|---|---|---|
| Rent | -10% $106 | -5% $215 | +0% $323 | +5% $431 | +10% $539 |
| Rate | -1.0pp $456 | -0.5pp $390 | base $323 | +0.5pp $254 | +1.0pp $184 |
UW: 25.0% down · 7.5% · 30yr · 1.5% tax · 5.0% vac · 8.0% maint · 8.0% mgmt
Financing live
Cash to close
- Down payment
- $66,250
- Closing costs
- $7,950
- Reserves months
- —
- Total cash needed
- —
Loan-product check · same deal, 3 products live
Conventional
25% down · 7.5% · 30yr
- Down + closing
- —
- Monthly P&I
- —
- Monthly cashflow
- —
- DSCR
- —
- Eligible?
- —
Personal DTI + credit; lowest rate.
DSCR
20% down · 8.5% · 30yr
- Down + closing
- —
- Monthly P&I
- —
- Monthly cashflow
- —
- DSCR
- —
- Eligible?
- —
No personal income docs; deal must DSCR.
Hard money
10% down · 12.0% · 12mo
- Down + closing
- —
- Monthly P&I
- —
- Monthly cashflow
- —
- DSCR
- —
- Eligible?
- —
Short-term bridge; refi at stabilization.
Rent comps 4 comps
| Address | Beds | Baths | Sqft | Rent | $/sqft | DOM | Units | Dist |
|---|---|---|---|---|---|---|---|---|
| 18 Valade St Burlington, VT | 2.0 | 1.0 | 1080 | $2,400 | $2.22 | 22d | 1 | 0.23mi |
| 1540 North Ave Burlington, VT | 3.0 | 1.5 | 1220 | $2,600 | $2.13 | 45d | 1 | 0.45mi |
| 38 Marshall Dr Burlington, VT | 3.0 | 2.0 | 1168 | $3,250 | $2.78 | 45d | 1 | 0.90mi |
| 108 Lopes Ave Burlington, VT | 4.0 | 1.5 | 1600 | $3,900 | $2.44 | 45d | 1 | 1.10mi |
Listing history 12 events
-
2026-06-21days on market $265,000 Active 154 DOM
-
2026-06-19days on market $265,000 Active 152 DOM
-
2026-06-18days on market $265,000 Active 151 DOM
-
2026-06-17days on market $265,000 Active 150 DOM
-
2026-06-16days on market $265,000 Active 149 DOM
-
2026-06-15days on market $265,000 Active 148 DOM
-
2026-06-14days on market $265,000 Active 146 DOM
-
2026-06-13days on market $265,000 Active 145 DOM
-
2026-06-10days on market $265,000 Active 143 DOM
-
2026-06-09days on market $265,000 Active 142 DOM
-
2026-06-09days on market $265,000 Active 141 DOM
-
2026-01-07$265,000 Active 296-char remark
Show marketing remark (296 chars)
Burlington home features 3 beds, 1 bath on . 16 acres nestled on a quiet street in the New North End. Close proximity to Burlington Bike Path, Beaches & shops. This property is occupied. Do not approach property, trespass or disturb occupants . The property is now active in online auction.
ⓘ Source: listings_history table (triggers on properties + properties_extension) + one-shot
backfill from property_details.listing_events for pre-trigger history.
Tax reassessment forecast VT · Partial reset (capped growth)
- Current annual tax
- $4,099 · $342/mo
- Projected year-2 tax
- $4,567 · $381/mo
- Expected delta
- +$468/yr (+$39/mo · 11.4%)
ⓘ Screening estimate from a state-policy table — verify with the county assessor before closing.
Climate risk First Street
- Flood 1/10 Low FEMA zone X (unshaded) · 0% chance over 30 yrs
- Wildfire 1/10 Low
- Heat 3/10 Moderate 7 d/yr ≥93°F today · 15 d/yr by 30 yrs out
- Wind 2/10 Low 100% chance of damaging wind over 30 yrs
- Air quality 2/10 Low 1 unhealthy d/yr today · 1 by 30 yrs out
Nearby sold comps map
Loading sold comps map…
Walkable amenities ~0.75 mi
Loading nearby amenities…
Taxation est. · year 1
- Rental income
- $32,880
- − Mortgage interest
- −$14,844
- − Property taxes
- −$4,099
- − Insurance
- −$1,325
- − Repairs & maintenance
- −$2,630
- − Management
- −$2,630
- − Depreciation
- −$7,709
- Taxable loss
- −$358
- Est. tax savings @ 24.0%
- +$86
- After-tax cash flow
- $3,961/yr
For passive investors: Depreciation is non-cash, so a rental often shows a tax loss while cash-flowing — sheltering income. Rental losses are passive: they offset passive income freely, and up to $25,000/yr can offset ordinary (W-2) income if you actively participate and your MAGI is under $100k (phasing out to $0 by $150k); unused losses carry forward. On sale, claimed depreciation is recaptured at up to 25%, and gains may owe capital-gains tax (a 1031 exchange can defer both). Figures are a year-1 estimate at your 24.0% rate — not tax advice; consult a CPA.
Schools (NCES district)
No district data.
Livability — Burlington
- Score
- 74/100
- State rank
- #19
- US rank
- #4619
Category grades
Schools grade is shown separately in the Schools card above.
Census & demographics
- Census place
- Burlington, VT
- City population
- 31,662
- Population (ZIP)
- 10,199
Population outlook (Chittenden County) Hauer SSP2
- Today (2025)
- 170,769 people
- By 2030
- 174,716 · +2.3%
- By 2040
- 180,337 · +5.6%
- By 2050
- 183,768 · +7.6%
- By 2075
- 194,646 · +14.0%
- By 2100
- 194,933 · +14.2%
Race, ethnicity, and origin ACS 2023
- Neighborhood character
- Predominantly White (85%)
- Race & ethnicity
- White 85% Two or more races 6% Black 4% Hispanic / Latino 3% Asian 3%
- Common ancestry
- Lithuanian 9% Slovak 5% Romanian 5%
- Foreign-born
- 9% · Canada, Vietnam
- Languages at home
- 89% English-only · French/Haitian/Cajun 3% Russian/Polish/Slavic 3% Spanish 1%
Political lean MEDSL · Chittenden
- 2024 margin
- Solid D (+53.6) · D 75.4% · R 21.7% · Other 2.9%
- 2008→2024 swing
- +8.9pp toward D · 2008: 44.8pp · 2024: 53.6pp
- All cycles
- 2024: D+53.6 2020: D+54.5 2016: D+46.8 2012: D+41.9 2008: D+44.8
Not yet ingested
- Civics
- —
Market trends
- HPI YoY
- ▼ -212.09%
- Current HPI
- 319.5442
- Rent YoY
- —
- Metro
- —
- State GDP YoY
- —
- F500 in state
- 0
Price history
1 event — show timeline
- 2026-01-07 Listed $265,000 PrimeMLS
Property tax history
+22.5%/yrLatest (2024): $4,099 · +8.5% YoY. Source: county tax records.
Cash-flow waterfall
monthlySold comps — $/sqft
last 12 mo · ≤1 miLoading sold comps…