 Duplex
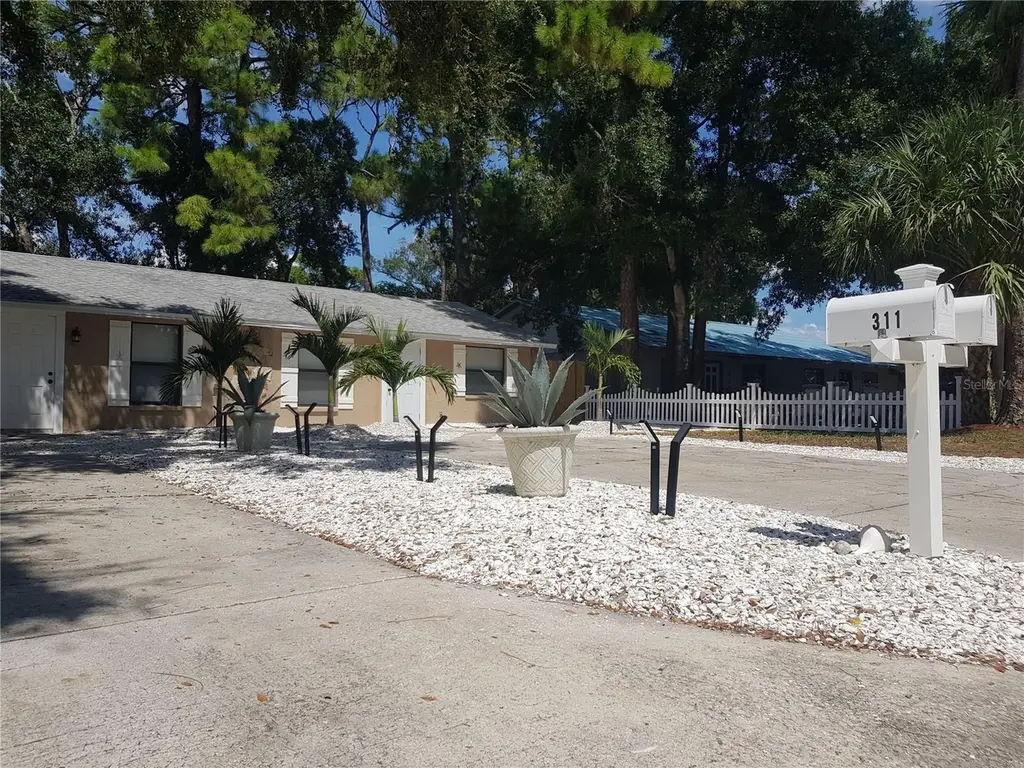
311 58th Ave E · Bayshore Gardens, FL
Flood risk 1/10 · Minimal
- FEMA flood zone
- X (unshaded)
- Chance of flooding over 30 yrs
- 0.0%
- Est. flood insurance / yr
- $507 – $1,088
Fire risk 1/10 · Minimal
- Est. fire insurance / yr
- $947 – $1,759
Heat risk 10/10 · Severe
- Hot days now (above 106°F)
- 7 days/yr
- Hot days in 30 yrs
- 27 days/yr
Wind risk 10/10 · Severe
- Chance of severe wind over 30 yrs
- 99.0%
Air-quality risk 2/10 · Minimal
- Unhealthy air days now
- 1 days/yr
- Unhealthy air days in 30 yrs
- 2 days/yr
Risk factors via First Street. Map © Google.
Why this score? — see what drove the F grade
The composite is a weighted blend of 9 inputs, each scored 0–100. Each bar is that input's sub-score; the figure is the points it added to the 100-point composite (weight × sub-score).
- Cash flow +12.8/30.0
- Schools +4.4/10.0
- Livability +4.1/5.0
- DSCR +3.8/10.0
- 1% rule +3.0/10.0
- Condition / age +2.5/5.0
- Rent growth +2.3/5.0
- ARV discount +0.0/15.0
- Appreciation +0.0/10.0
$499,000
🖨 Deal sheet 📄 Offer letter ✓ Due diligence
Multi-family units
County records classify this as Multi-Family (2-4 Unit). Listing-text estimate: 2 units. confirmed
Listing remarks MLS
Under contract-accepting backup offers. BACK ON THE MARKET! BUYER WAS UNABLE TO OBTAIN FINANCING. This property includes 311 & 313 58th Avenue East, Bradenton, FL. SOLD AS-IS.
Key facts
- Rental cash flow
- Coastal design
- Tenant occupied
Tags
Property features AI
Finance
- Financial info: Two-unit property; Annual net income reported: $40,000
- HOA & community: No association
Exterior
- Utilities: Public water; Public sewer; Electricity connected/available; Cable connected; Water and sewer available/connected
- Home design: Duplex (residential income property); One building
- Construction: Block, concrete and stucco construction; Shingle roof; Slab foundation; Built using durable masonry materials
- Exterior features: Exterior lighting; Private mailbox; Sidewalk
Interior
- Kitchen: Dishwasher; Range; Range hood; Microwave; Refrigerator; Ice maker; Exhaust fan; Electric water heater
- Bedrooms: Six bedrooms total (configured as two 3-bedroom units)
- Flooring: Laminate; Tile
- Bathrooms: Four bathrooms total (each 3-bedroom unit has 2 bathrooms)
- Heating & cooling: Central heating; Central air conditioning
- Interior features: Ceiling fans; Kitchen/family room combo; Thermostat
- Laundry & utility: Laundry closet
Neighborhood map
What this means for you Summary
Snapshot
- This is a 2 × 3-bed/?-bath units multifamily listed at $499k.
Deal economics
- At list price, monthly cash flow is $-42 ($-507/yr) — negative. Per door: $-21/mo.
- To cash-flow at today's rent, offer at most $492k (1.5% below list).
- To meet the 1% rule (rent ≥ 1% of price), the offer needs to be $399k (20.0% below list).
- Recommended offer: $399k (20.0% below list) — sets the bar for 1% rule.
- Cap rate 6.2% vs local median 4.7% in Bayshore Gardens — top-decile yield for the area; either an underpriced asset or a hidden risk that comps aren't pricing in. Stress-test before assuming the spread holds.
Location & tenants
- Location reads 82/100 on livability (#72 in FL, #1,180 nationally) — a professional / high-income tenant draw. Strengths: cost of living A+, housing A+, health & safety A+; Watch: crime C-, commute C-, schools F.
- Manatee (suburban): math 54% / reading 50% proficiency, ranked #26 of 73 in FL (top 36%) — acceptable for families but not a draw, mixed tenant base, ~2y average lease.
- Market conditions: Rents soft (-1.0%/yr); 384 active listings in the ZIP; 1 comparable units currently listed for rent nearby; 7,472 units permitted in Manatee County in 2024 (1,782 in 5+ unit buildings).
- At $3,991/mo this rent would consume 68% of the median local household income ($71k/yr) (locally 1469% of renters already pay >50% of income on rent) — very limited rent-growth headroom before tenants either downsize or default.
Forward outlook
- Local home prices are declining (-3.0%/yr); year-one equity from $3k of loan paydown is wiped out by about $15k of value loss. Plan a longer hold.
- Manatee County population projected at +43% by 2050 — long-run rental-demand tailwind backs the buy-and-hold thesis.
Negotiation context
- It's been on market 73 days — a 6% lower offer ($469k) is reasonable based on typical stale-listing flexibility.
- 13 sale attempts since 4y ago; this cycle's ask has dropped $86k (15%) from the opening price — seller is motivated, your offer sets the floor, not the list.
- Current owner paid $305k; list at $499k implies a 64% gain — meaningful room to come down on a strong offer.
Risks & watch-outs
- Climate carrying-cost: severe wind risk, 99% chance of damaging wind over 30y; extreme-heat days projected 7→27/yr by 2055 (HVAC capex compounding) — expect insurance premiums to compound above CPI over the hold.
Questions for the listing agent
- What do current leases actually rent for vs. the listed asking? Can we see a recent rent roll and the last 12 months of T-12 income?
- It's been on market 73 days. Have you received any prior offers? Is the seller open to a 20% concession, seller financing, or rate buy-down credit?
- Can we see the unit-by-unit rent roll, current vacancy, and any below-market leases? What's the average tenancy length?
- What capital expenditures (roof, boiler, parking lot, exteriors) have been made in the last 5 years, and what's planned in the next 2?
- Why hasn't it sold? Are there any deal-killer items the seller is aware of (foundation, flood, title, zoning, code violations)?
- Is there a deadline driving the sale (1031 exchange, divorce, estate, relocation)? That informs how much negotiation room exists.
- Schools are F-rated, which usually means shorter tenancies and higher turnover. Who's the typical renter profile here, and what's been the actual vacancy rate?
- The area grade is low — what's the realistic commute time and amenity access for the typical tenant pool here? Any planned neighborhood developments (good or bad) we should know about?
- What's the average days-on-market for RENTAL listings here right now (not sales)? A rising rental-DOM trend means longer vacancies and softer asking-rent achievability than the comps imply.
- What's the recent tenant-quality profile in this submarket — average credit score on applications, eviction rate, late-payment / NSF rate, and stable-employment percentage? A property-management company in the area should have these aggregated.
- How much new apartment / multifamily construction is in the pipeline within 1–3 miles? Heavy new supply (>2% of stock underway) typically softens rents 12–24 months out; light construction supports rent growth.
Investment metrics
- 1% rule
- 0.80% ✗
- Cap rate
- 6.19%
- Cash-on-cash
- -0.36%
- DSCR
- 0.98
- GRM
- 10.4
CMA / ARV
- ARV (on-the-fly)
- $401,940
- Comps found
- 8
Show comp detail 8 sales within ~0.75 mi
| Address | Dist | Beds/Ba | Sqft | Sold | Price | $/sf | Match |
|---|---|---|---|---|---|---|---|
| 5801 8th Street Ct E | 0.37mi | 6/4.0 | 1,982 (+0%) | 3mo | $414,900 | $209 | 80 |
| 1015-1017 58th Avenue Dr E | 0.51mi | 6/4.0 | 1,988 (+0%) | 3mo | $380,000 | $191 | 73 |
| 915 58th Avenue Dr E | 0.45mi | 6/4.0 | 1,872 (-6%) | 5mo | $380,000 | $203 | 66 |
| 508 60th Ave E | 0.35mi | 6/4.0 | 1,988 (+0%) | 20mo | $425,000 | $214 | 66 |
| 1004 58th Avenue Dr E | 0.47mi | 5/4.0 (-1) | 1,944 (-2%) | 6mo | $365,000 | $188 | 65 |
| 1026 61st Avenue Dr E | 0.74mi | 6/4.0 | 1,992 (+1%) | 5mo | $415,000 | $208 | 60 |
| 604 60th Avenue Dr W | 0.55mi | 6/4.0 | 2,112 (+7%) | 12mo | $370,000 | $175 | 53 |
| 1218 57th Ave E | 0.66mi | 6/4.0 | 1,952 (-1%) | 22mo | $367,150 | $188 | 48 |
Match score weights: distance 35% · size 25% · config 20% · recency 20%. Top-matched comps best support the ARV.
Projected returns pro-forma
-3.0% appreciation · 0.0% rent growth · sell at horizon
- IRR
- -20.1%
- Equity multiple
- 0.32×
- Total profit
- $-95,343
- Equity at exit
- $74,403
- IRR
- -20.7%
- Equity multiple
- 0.05×
- Total profit
- $-132,077
- Equity at exit
- $43,144
Cash invested: $139,720 (down + closing). Projections, not guarantees.
Landlord ↔ Tenant lean methodology
- Overall (STATE)
- 87 Strongly Landlord-Friendly
- State Florida
- 87 Strongly Landlord-Friendly · R+3
- County
- — inherits STATE
- City
- — inherits STATE
ZIP-level market 34203
- Home prices YoY
- -24.5%
- Rents YoY
- -1.0%
- Active inventory
- 384
- Price-to-rent
- 20.8×
Monthly cashflow live
- Estimated rent
- $3,991 high interval (Pro) →
- Mortgage (P&I)
- −$2,617
- Tax from tax record
- −$370 /mo · $4,445/yr
- Insurance
- −$208
- HOA
- −$0
- Vacancy / Maint / Mgmt
- −$838
- Net cashflow
- $-42
Break-even live
2-unit breakdown (identical units grouped — click to expand)
| Units | Beds | Baths | Est. rent |
|---|---|---|---|
| 2× units | 3 | — | $3,990 |
| #1 | 3 | — | $1,995 |
| #2 | 3 | — | $1,995 |
| Total (2 units) | $3,991 | ||
UW: 25.0% down · 7.5% · 30yr · 1.5% tax · 5.0% vac · 8.0% maint · 8.0% mgmt
Financing live
Cash to close
- Down payment
- $124,750
- Closing costs
- $14,970
- Reserves months
- —
- Total cash needed
- —
Loan-product check · same deal, 3 products live
Conventional
25% down · 7.5% · 30yr
- Down + closing
- —
- Monthly P&I
- —
- Monthly cashflow
- —
- DSCR
- —
- Eligible?
- —
Personal DTI + credit; lowest rate.
DSCR
20% down · 8.5% · 30yr
- Down + closing
- —
- Monthly P&I
- —
- Monthly cashflow
- —
- DSCR
- —
- Eligible?
- —
No personal income docs; deal must DSCR.
Hard money
10% down · 12.0% · 12mo
- Down + closing
- —
- Monthly P&I
- —
- Monthly cashflow
- —
- DSCR
- —
- Eligible?
- —
Short-term bridge; refi at stabilization.
Rent comps 1 comps
| Address | Beds | Baths | Sqft | Rent | $/sqft | DOM | Units | Dist |
|---|---|---|---|---|---|---|---|---|
| 703 59th Avenue Ter W Bradenton, FL | 5.0 | 2.0 | 1700 | $2,645 | $1.56 | 19d | 1 | 0.53mi |
Listing history 45 events
-
2026-06-15status $499,000 Pending 73 DOM
-
2026-06-15days on market $499,000 Active 73 DOM
-
2026-06-13days on market $499,000 Active 71 DOM
-
2026-06-13days on market $499,000 Active 70 DOM
-
2026-06-10days on market $499,000 Active 68 DOM
-
2026-06-09days on market $499,000 Active 67 DOM
-
2026-06-08days on market $499,000 Active 66 DOM
-
2026-06-08days on market $499,000 Active 65 DOM
-
2026-06-03days on market $499,000 Active 61 DOM
-
2026-06-02pricedays on market $499,000 Active 60 DOM
-
2026-06-01days on market $525,000 Active 59 DOM
-
2026-05-31days on market $525,000 Active 58 DOM
-
2026-05-14price $525,000
-
2026-04-28price $545,000
-
2026-04-17price $565,000
-
2026-04-03$585,000 Active
-
2025-12-23historical $2,195
-
2025-12-19$2,195
-
2025-12-16historical
-
2025-10-05$549,000 Active
-
2024-04-09historical $1,995
-
2024-03-29$1,995
-
2024-03-21historical $1,995
-
2024-03-12$1,995
-
2023-10-26historical $1,995
-
2023-10-23$1,995
-
2023-10-21historical $1,995
-
2023-09-20$1,995
-
2023-09-10historical $1,995
-
2023-09-08$1,995
-
2023-08-04soldstatus $305,000 Closed 183-char remark
Show marketing remark (183 chars)
Under contract-accepting backup offers. BACK ON THE MARKET! BUYER WAS UNABLE TO OBTAIN FINANCING. This property includes 311 & 313 58th Avenue East, Bradenton, FL. SOLD AS-IS.
-
2023-07-21status Pending 183-char remark
Show marketing remark (183 chars)
Under contract-accepting backup offers. BACK ON THE MARKET! BUYER WAS UNABLE TO OBTAIN FINANCING. This property includes 311 & 313 58th Avenue East, Bradenton, FL. SOLD AS-IS.
-
2023-07-15status Active 183-char remark
Show marketing remark (183 chars)
Under contract-accepting backup offers. BACK ON THE MARKET! BUYER WAS UNABLE TO OBTAIN FINANCING. This property includes 311 & 313 58th Avenue East, Bradenton, FL. SOLD AS-IS.
-
2023-06-30status Pending 183-char remark
Show marketing remark (183 chars)
Under contract-accepting backup offers. BACK ON THE MARKET! BUYER WAS UNABLE TO OBTAIN FINANCING. This property includes 311 & 313 58th Avenue East, Bradenton, FL. SOLD AS-IS.
-
2023-04-30status Pending 183-char remark
Show marketing remark (183 chars)
Under contract-accepting backup offers. BACK ON THE MARKET! BUYER WAS UNABLE TO OBTAIN FINANCING. This property includes 311 & 313 58th Avenue East, Bradenton, FL. SOLD AS-IS.
-
2023-03-24status Active 183-char remark
Show marketing remark (183 chars)
Under contract-accepting backup offers. BACK ON THE MARKET! BUYER WAS UNABLE TO OBTAIN FINANCING. This property includes 311 & 313 58th Avenue East, Bradenton, FL. SOLD AS-IS.
-
2023-03-17status Pending 183-char remark
Show marketing remark (183 chars)
Under contract-accepting backup offers. BACK ON THE MARKET! BUYER WAS UNABLE TO OBTAIN FINANCING. This property includes 311 & 313 58th Avenue East, Bradenton, FL. SOLD AS-IS.
-
2023-03-17status Active 183-char remark
Show marketing remark (183 chars)
Under contract-accepting backup offers. BACK ON THE MARKET! BUYER WAS UNABLE TO OBTAIN FINANCING. This property includes 311 & 313 58th Avenue East, Bradenton, FL. SOLD AS-IS.
-
2023-02-10price $355,000 183-char remark
Show marketing remark (183 chars)
Under contract-accepting backup offers. BACK ON THE MARKET! BUYER WAS UNABLE TO OBTAIN FINANCING. This property includes 311 & 313 58th Avenue East, Bradenton, FL. SOLD AS-IS.
-
2023-01-21status Active 183-char remark
Show marketing remark (183 chars)
Under contract-accepting backup offers. BACK ON THE MARKET! BUYER WAS UNABLE TO OBTAIN FINANCING. This property includes 311 & 313 58th Avenue East, Bradenton, FL. SOLD AS-IS.
-
2022-11-19status Pending 183-char remark
Show marketing remark (183 chars)
Under contract-accepting backup offers. BACK ON THE MARKET! BUYER WAS UNABLE TO OBTAIN FINANCING. This property includes 311 & 313 58th Avenue East, Bradenton, FL. SOLD AS-IS.
-
2022-10-26$352,440 Active 183-char remark
Show marketing remark (183 chars)
Under contract-accepting backup offers. BACK ON THE MARKET! BUYER WAS UNABLE TO OBTAIN FINANCING. This property includes 311 & 313 58th Avenue East, Bradenton, FL. SOLD AS-IS.
-
2000-01-19soldstatus $69,000
-
1996-05-22soldstatus $52,500
-
1992-09-24soldstatus $54,500
ⓘ Source: listings_history table (triggers on properties + properties_extension) + one-shot
backfill from property_details.listing_events for pre-trigger history.
Tax reassessment forecast FL · Resets to sale price
- Current annual tax
- $4,445 · $370/mo
- Projected year-2 tax
- $4,445 · $370/mo
- Expected delta
- $0/yr ($0/mo · 0.0%)
ⓘ Screening estimate from a state-policy table — verify with the county assessor before closing.
Climate risk First Street
- Flood 1/10 Low FEMA zone X (unshaded) · 0% chance over 30 yrs
- Wildfire 1/10 Low
- Heat 10/10 Extreme 7 d/yr ≥106°F today · 27 d/yr by 30 yrs out
- Wind 10/10 Extreme 99% chance of damaging wind over 30 yrs
- Air quality 2/10 Low 1 unhealthy d/yr today · 2 by 30 yrs out
Nearby sold comps map
Loading sold comps map…
Walkable amenities ~0.75 mi
Loading nearby amenities…
Taxation est. · year 1
- Rental income
- $47,892
- − Mortgage interest
- −$27,952
- − Property taxes
- −$4,445
- − Insurance
- −$2,495
- − Repairs & maintenance
- −$3,831
- − Management
- −$3,831
- − Depreciation
- −$14,516
- Taxable loss
- −$9,179
- Est. tax savings @ 24.0%
- +$2,203
- After-tax cash flow
- $1,696/yr
For passive investors: Depreciation is non-cash, so a rental often shows a tax loss while cash-flowing — sheltering income. Rental losses are passive: they offset passive income freely, and up to $25,000/yr can offset ordinary (W-2) income if you actively participate and your MAGI is under $100k (phasing out to $0 by $150k); unused losses carry forward. On sale, claimed depreciation is recaptured at up to 25%, and gains may owe capital-gains tax (a 1031 exchange can defer both). Figures are a year-1 estimate at your 24.0% rate — not tax advice; consult a CPA.
Schools (NCES district)
- District
- Manatee
- NCES district ID
- 1201230
- Math proficiency
- 54% ▼ -6.00%
- Reading proficiency
- 50% ▼ -2.00%
- Median HH income
- $49,607
- Composite
- 44.43/100
- National rank
- #2806
- State rank
- #26 of 73 in FL
Livability — Bayshore Gardens
- Score
- 82/100
- State rank
- #72
- US rank
- #1180
Category grades
Schools grade is shown separately in the Schools card above.
Census & demographics
- County
- Manatee County · 416,364 people
- City population
- 227,091
- Metro
- North Port-Sarasota-Bradenton, FL
- Population (ZIP)
- 40,618
- Household income
- $70,761
- Rent vs Own
- Severe rent burden
- 1469.0
Population outlook (Manatee County) Hauer SSP2
- Today (2025)
- 447,342 people
- By 2030
- 488,911 · +9.3%
- By 2040
- 567,934 · +27.0%
- By 2050
- 637,995 · +42.6%
- By 2075
- 781,970 · +74.8%
- By 2100
- 848,272 · +89.6%
Race, ethnicity, and origin ACS 2023
- Neighborhood character
- Predominantly White (65%)
- Race & ethnicity
- White 65% Hispanic / Latino 19% Two or more races 12% Black 9% Asian 5%
- Hispanic origin (detail)
- Mexican 9% Puerto Rican 3% Cuban 2% Dominican 1%
- Common ancestry
- Lithuanian 3% Romanian 3% Slovak 2%
- Foreign-born
- 17% · Canada, Vietnam, Dominican Republic
- Languages at home
- 76% English-only · Spanish 16% Vietnamese 2% Other Indo-European 1%
Political lean MEDSL · Manatee
- 2024 margin
- Strong R (+23.5) · D 37.9% · R 61.4%
- 2008→2024 swing
- -16.5pp toward R · 2008: -7.0pp · 2024: -23.5pp
- All cycles
- 2024: R+23.5 2020: R+16.1 2016: R+17.1 2012: R+12.5 2008: R+7.0
Not yet ingested
- Civics
- —
Market trends
- HPI YoY
- ▼ -95.87%
- Current HPI
- 295.8871
- Rent YoY
- ▼ -0.97%
- Metro
- North Port-Sarasota-Bradenton, FL
- State GDP YoY
- ▲ 3.28%
- F500 in state
- 36
Industry mix (Fortune 500 HQ in FL)
| Industry | F500 HQs | Revenue |
|---|---|---|
| Industrial Technology | 2 | $29B |
|
||
| Insurance | 2 | $17B |
|
||
| Retail | 1 | $60B |
|
||
| Technology Distribution | 1 | $58B |
|
||
| Homebuilding | 1 | $35B |
|
||
| Technology Manufacturing | 1 | $35B |
|
||
Price history
+863.3% since first listed33 events — show timeline
- 2026-05-14 Price Changed $525,000 Stellar MLS as Distributed by MLS Grid
- 2026-04-28 Price Changed $545,000 Stellar MLS as Distributed by MLS Grid
- 2026-04-17 Price Changed $565,000 Stellar MLS as Distributed by MLS Grid
- 2026-04-03 Listed $585,000 Stellar MLS as Distributed by MLS Grid
- 2025-12-23 Rental Removed $2,195 STELLARMLS
- 2025-12-19 Listed for Rent $2,195 STELLARMLS
- 2025-12-16 Listing Removed — Stellar MLS as Distributed by MLS Grid
- 2025-10-05 Listed $549,000 Stellar MLS as Distributed by MLS Grid
- 2024-04-09 Rental Removed $1,995 STELLARMLS
- 2024-03-29 Listed for Rent $1,995 STELLARMLS
- 2024-03-21 Rental Removed $1,995 STELLARMLS
- 2024-03-12 Listed for Rent $1,995 STELLARMLS
- 2023-10-26 Rental Removed $1,995 LISTANZA
- 2023-10-23 Listed for Rent $1,995 LISTANZA
- 2023-10-21 Rental Removed $1,995 STELLARMLS
- 2023-09-20 Listed for Rent $1,995 STELLARMLS
- 2023-09-10 Rental Removed $1,995 STELLARMLS
- 2023-09-08 Listed for Rent $1,995 STELLARMLS
- 2023-08-04 Sold (MLS) $305,000 Stellar MLS as Distributed by MLS Grid
- 2023-07-21 Pending — Stellar MLS as Distributed by MLS Grid
- 2023-07-15 Relisted — Stellar MLS as Distributed by MLS Grid
- 2023-06-30 Pending — Stellar MLS as Distributed by MLS Grid
- 2023-04-30 Pending — Stellar MLS as Distributed by MLS Grid
- 2023-03-24 Relisted — Stellar MLS as Distributed by MLS Grid
- 2023-03-17 Pending — Stellar MLS as Distributed by MLS Grid
- 2023-03-17 Relisted — Stellar MLS as Distributed by MLS Grid
- 2023-02-10 Price Changed $355,000 Stellar MLS as Distributed by MLS Grid
- 2023-01-21 Relisted — Stellar MLS as Distributed by MLS Grid
- 2022-11-19 Pending — Stellar MLS as Distributed by MLS Grid
- 2022-10-26 Listed $352,440 Stellar MLS as Distributed by MLS Grid
- 2000-01-19 Sold (Public Records) $69,000 Public Records
- 1996-05-22 Sold (Public Records) $52,500 Public Records
- 1992-09-24 Sold (Public Records) $54,500 Public Records
Property tax history
+14.1%/yrLatest (2025): $4,445 · +0.5% YoY. Source: county tax records.
Cash-flow waterfall
monthlySold comps — $/sqft
last 12 mo · ≤1 miLoading sold comps…