 Duplex
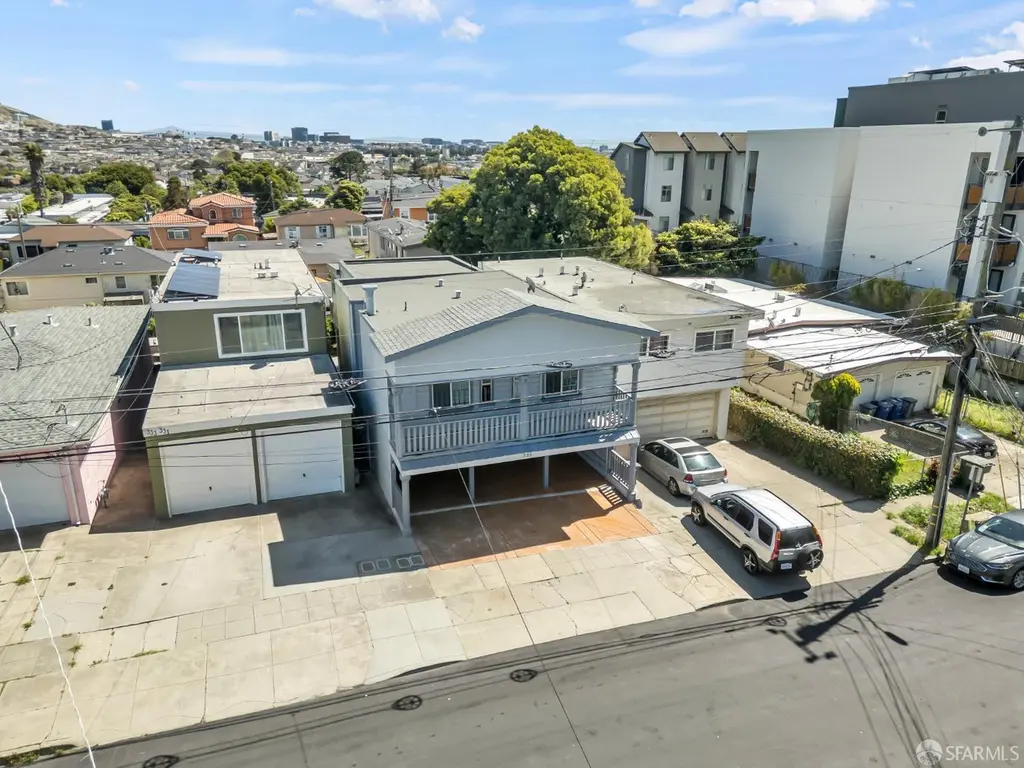
335 A St · South San Francisco, CA
Flood risk 1/10 · Minimal
- FEMA flood zone
- X (unshaded)
- Chance of flooding over 30 yrs
- 0.0%
- Est. flood insurance / yr
- $507 – $1,088
Fire risk 2/10 · Minimal
- Est. fire insurance / yr
- $659 – $1,223
Heat risk 2/10 · Minimal
- Hot days now (above 78°F)
- 8 days/yr
- Hot days in 30 yrs
- 19 days/yr
Wind risk 1/10 · Minimal
- Chance of severe wind over 30 yrs
- —
Air-quality risk 7/10 · Major
- Unhealthy air days now
- 13 days/yr
- Unhealthy air days in 30 yrs
- 13 days/yr
Risk factors via First Street. Map © Google.
Why this score? — see what drove the D grade
The composite is a weighted blend of 9 inputs, each scored 0–100. Each bar is that input's sub-score; the figure is the points it added to the 100-point composite (weight × sub-score).
- Cash flow +12.0/30.0
- ARV discount +9.0/15.0
- Rent growth +4.0/5.0
- Schools +4.0/10.0
- DSCR +3.5/10.0
- Livability +3.2/5.0
- Condition / age +2.5/5.0
- 1% rule +2.3/10.0
- Appreciation +0.0/10.0
$1,299,000
🖨 Deal sheet (PDF) 📄 Offer letter ✓ Due diligence
Multi-family units
County records classify this as Multi-Family (2-4 Unit). Listing-text estimate: 2 units. confirmed
Listing remarks
An investment opportunity awaits at 335-337 A Street, a well-maintained duplex ideally located in the heart of South San Francisco. Perfect for an owner-occupant or savvy investor, this versatile property features 1171sqft upper unit with two bedrooms, two full bathrooms, a spacious living room, kitchen, sunroom, and a private patio with a swing. Plus a 899sqft lower unit which is fully electric and includes one bedroom, a full bathroom, a bonus room/office, a cozy living room, and a kitchen with deck access. Additional highlights include a three-car carport, ample storage, washer and dryer hookups, and separate PG & E and water meters for each unit. A shared backyard with patio space a
Key facts
- Bonus room
- Deck access
- Private patio
Tags
Property features AI
Finance
- HOA & community: No HOA
Exterior
- Parking: Covered carport parking for 3 vehicles total
- Utilities: City utilities; Public sewer; Separate meters for water, gas and electricity
- Home design: Duplex (Residential Income); House(s) subtype; Built in 1930; Updated/remodeled condition
- Construction: Year built 1930
- Exterior features: Regular-shaped lot; Other-style roof
Interior
- Kitchen: Microwave; Free-standing refrigerator; Free-standing gas range; Dishwasher
- Bedrooms: Unit 1: 1 bedroom; Unit 2: 2 bedrooms
- Flooring: Wood; Tile; Laminate; Carpet
- Bathrooms: Unit 1: 1 full bathroom; Unit 2: 2 full bathrooms
- Heating & cooling: Gas heating
- Interior features: Updated/remodeled interiors; Dual-pane full windows; Two levels (2-story)
- Laundry & utility: Washer and dryer owned
Neighborhood map
What this means for you Summary
Snapshot
- This is a 2 × 3-bed/3.0-bath units multifamily listed at $1.30M.
Deal economics
- At list price, monthly cash flow is $-315 ($-4k/yr) — negative. Per door: $-157/mo.
- To cash-flow at today's rent, offer at most $1.24M (4.3% below list).
- To meet the 1% rule (rent ≥ 1% of price), the offer needs to be $948k (27.0% below list).
- Recommended offer: $948k (27.0% below list) — sets the bar for 1% rule.
- Cap rate 6.0% vs local median 2.1% in South San Francisco — top-decile yield for the area; either an underpriced asset or a hidden risk that comps aren't pricing in. Stress-test before assuming the spread holds.
Location & tenants
- Location reads 65/100 on livability (#372 in CA) — a middle-class / working-renter tenant base. Strengths: commute A+, employment A+; Watch: amenities F, cost of living F, health & safety F.
- South San Francisco Unified (urban): math 38% / reading 47% proficiency, ranked #176 of 517 in CA (top 34%) — families likely to look elsewhere, expect single-tenant / working-renter base with shorter leases.
- Zoned schools: Los Cerritos Elementary (math 17% / reading 22%, grade F, #1,270 of 1,571 statewide, top 83%, 306 students, 50% FRL); Alta Loma Middle (math 32% / reading 42%, grade F, #170 of 498 statewide, top 35%, 628 students, 34% FRL); South San Francisco High (math 37% / reading 64%, grade D+, #324 of 1,170 statewide, top 28%, 1,280 students, 41% FRL).
- Market conditions: Rents rising fast (+6.0%/yr); 76 active listings in the ZIP; 14 comparable units currently listed for rent nearby; rentals leasing fast (median 4d on market — plan ~1-2 weeks tenant-placement turnaround); high-income renter base; 1,019 units permitted in San Mateo County in 2024 (484 in 5+ unit buildings).
- At $9,479/mo this rent would consume 83% of the median local household income ($137k/yr) (locally 2470% of renters already pay >50% of income on rent) — very limited rent-growth headroom before tenants either downsize or default.
Forward outlook
- Local home prices are declining (-3.0%/yr); year-one equity from $9k of loan paydown is wiped out by about $39k of value loss. Plan a longer hold.
- San Mateo County population projected at +24% by 2050 — long-run rental-demand tailwind backs the buy-and-hold thesis.
Negotiation context
- It's been on market 53 days — a 3% lower offer ($1.26M) is reasonable based on typical stale-listing flexibility.
- Current owner paid $165k; list at $1.30M implies a 687% gain — meaningful room to come down on a strong offer.
Risks & watch-outs
- Watch-outs: built in 1930 — expect roof / HVAC / electrical / plumbing capex.
Questions for the listing agent
- What do current leases actually rent for vs. the listed asking? Can we see a recent rent roll and the last 12 months of T-12 income?
- It's been on market 53 days. Have you received any prior offers? Is the seller open to a 27% concession, seller financing, or rate buy-down credit?
- Can we see the unit-by-unit rent roll, current vacancy, and any below-market leases? What's the average tenancy length?
- What capital expenditures (roof, boiler, parking lot, exteriors) have been made in the last 5 years, and what's planned in the next 2?
- Built in 1930 — when were the roof, HVAC, electrical panel, plumbing, and water heater last replaced?
- Is there a deadline driving the sale (1031 exchange, divorce, estate, relocation)? That informs how much negotiation room exists.
- Schools are D-rated, which usually means shorter tenancies and higher turnover. Who's the typical renter profile here, and what's been the actual vacancy rate?
- The area grade is low — what's the realistic commute time and amenity access for the typical tenant pool here? Any planned neighborhood developments (good or bad) we should know about?
- What's the average days-on-market for RENTAL listings here right now (not sales)? A rising rental-DOM trend means longer vacancies and softer asking-rent achievability than the comps imply.
- What's the recent tenant-quality profile in this submarket — average credit score on applications, eviction rate, late-payment / NSF rate, and stable-employment percentage? A property-management company in the area should have these aggregated.
- How much new apartment / multifamily construction is in the pipeline within 1–3 miles? Heavy new supply (>2% of stock underway) typically softens rents 12–24 months out; light construction supports rent growth.
Investment metrics
- 1% rule
- 0.73% ✗
- Cap rate
- 6.00%
- Cash-on-cash
- -1.04%
- DSCR
- 0.95
- GRM
- 11.4
CMA / ARV
- ARV (median comp)
- $1,343,690
- List price
- $1,299,000
- Delta
- -3.33%
- Verdict
- FAIR
- Comps
- 11 within 1.0 mi
Show comp detail 1 sale within ~0.75 mi
| Address | Dist | Beds/Ba | Sqft | Sold | Price | $/sf | Match |
|---|---|---|---|---|---|---|---|
| 729 Grand Ave | 0.61mi | 4/2.0 (+1) | 1,310 (-6%) | 8mo | $1,505,000 | $1,149 | 51 |
Match score weights: distance 35% · size 25% · config 20% · recency 20%. Top-matched comps best support the ARV.
Projected returns pro-forma
-3.0% appreciation · 6.02% rent growth · sell at horizon
- IRR
- -15.2%
- Equity multiple
- 0.45×
- Total profit
- $-201,449
- Equity at exit
- $193,685
- IRR
- -2.7%
- Equity multiple
- 0.80×
- Total profit
- $-74,027
- Equity at exit
- $112,314
Cash invested: $363,720 (down + closing). Projections, not guarantees.
Landlord ↔ Tenant lean methodology
- Overall (STATE)
- 18 Strongly Tenant-Friendly
- State California
- 18 Strongly Tenant-Friendly · D+13
- County
- — inherits STATE
- City
- — inherits STATE
ZIP-level market 94080
- Rents YoY
- 6.0%
- Active inventory
- 76
- Price-to-rent
- 22.8×
Monthly cashflow live
- Estimated rent
- $9,479 medium interval (Pro) →
- Mortgage (P&I)
- −$6,812
- Tax from tax record
- −$450 /mo · $5,398/yr
- Insurance
- −$541
- HOA
- −$0
- Vacancy / Maint / Mgmt
- −$1,991
- Net cashflow
- $-315
Break-even live
Sensitivity live
| Price | -10% $421 | -5% $53 | +0% $-315 | +5% $-682 | +10% $-1,050 |
|---|---|---|---|---|---|
| Rent | -10% $-1,064 | -5% $-689 | +0% $-315 | +5% $60 | +10% $434 |
| Rate | -1.0pp $339 | -0.5pp $16 | base $-315 | +0.5pp $-651 | +1.0pp $-994 |
2-unit breakdown (identical units grouped — click to expand)
| Units | Beds | Baths | Est. rent |
|---|---|---|---|
| 2× units | 3 | 3 | $9,478 |
| #1 | 3 | 3 | $4,739 |
| #2 | 3 | 3 | $4,739 |
| Total (2 units) | $9,479 | ||
UW: 25.0% down · 7.5% · 30yr · 1.5% tax · 5.0% vac · 8.0% maint · 8.0% mgmt
Financing live
Cash to close
- Down payment
- $324,750
- Closing costs
- $38,970
- Reserves months
- —
- Total cash needed
- —
Loan-product check · same deal, 3 products live
Conventional
25% down · 7.5% · 30yr
- Down + closing
- —
- Monthly P&I
- —
- Monthly cashflow
- —
- DSCR
- —
- Eligible?
- —
Personal DTI + credit; lowest rate.
DSCR
20% down · 8.5% · 30yr
- Down + closing
- —
- Monthly P&I
- —
- Monthly cashflow
- —
- DSCR
- —
- Eligible?
- —
No personal income docs; deal must DSCR.
Hard money
10% down · 12.0% · 12mo
- Down + closing
- —
- Monthly P&I
- —
- Monthly cashflow
- —
- DSCR
- —
- Eligible?
- —
Short-term bridge; refi at stabilization.
Rent comps 14 comps
| Address | Beds | Baths | Sqft | Rent | $/sqft | DOM | Units | Dist |
|---|---|---|---|---|---|---|---|---|
| 739 Circle Ct South San Francisco, CA | 2.0 | 1.0 | 900 | $3,795 | $4.22 | 26d | 1 | 0.43mi |
| 663 1st Ln Unit 663 South San Francisco, CA | 3.0 | 2.0 | 1100 | $5,100 | $4.64 | 0d | 1 | 0.49mi |
| 150 Hazelwood Dr South San Francisco, CA | 4.0 | 3.0 | 1350 | $1,550 | $1.15 | 45d | 1 | 0.56mi |
| 657 Grand Ave #1655 South San Francisco, CA | 3.0 | 2.0 | 1100 | $4,450 | $4.05 | 45d | 1 | 0.65mi |
| 1111 Mission Rd Unit 09 South San Francisco, CA | 2.0 | 2.0 | 950 | $3,350 | $3.53 | 16d | 1 | 0.85mi |
| 225 Alta Mesa Dr South San Francisco, CA | 3.0 | 1.0 | 1230 | $5,100 | $4.15 | 1d | 1 | 1.03mi |
| 853 Commodore Dr #1398 San Bruno, CA | 1.0–2.0 | 1.0–2.0 | 774 | $4,600 | $5.94 | 0d | 2 | 1.15mi |
| 1099 Admiral Ct San Bruno, CA | 1.0–3.0 | 1.0–3.0 | 1265 | $5,665 | $4.48 | 0d | 1 | 1.17mi |
| 150 Airport Blvd South San Francisco, CA | 1.0–2.0 | 1.0–2.0 | 998 | $5,347 | $5.36 | 0d | 17 | 1.17mi |
| 943 Ridgeview Ct Unit 2A South San Francisco, CA | 2.0 | 1.0 | 930 | $3,480 | $3.74 | 45d | 1 | 1.20mi |
| 400 Cypress Ave South San Francisco, CA | 3.0 | 1.0–2.0 | 944 | $5,375 | $5.69 | 0d | 24 | 1.23mi |
| 2210 Gellert Blvd #5405 South San Francisco, CA | 3.0 | 2.0 | 1290 | $4,250 | $3.29 | 3d | 1 | 1.37mi |
| 833 Linden Ave South San Francisco, CA | 3.0 | 1.0 | 1188 | $4,095 | $3.45 | 45d | 1 | 1.38mi |
| 101 McLellan Dr South San Francisco, CA | 2.0 | 1.0–2.0 | 779 | $3,740 | $4.80 | 0d | 7 | 1.40mi |
Listing history 19 events
-
2026-06-21days on market $1,299,000 Active 53 DOM
-
2026-06-18days on market $1,299,000 Active 50 DOM
-
2026-06-17days on market $1,299,000 Active 49 DOM
-
2026-06-16days on market $1,299,000 Active 48 DOM
-
2026-06-15days on market $1,299,000 Active 47 DOM
-
2026-06-13days on market $1,299,000 Active 45 DOM
-
2026-06-13days on market $1,299,000 Active 44 DOM
-
2026-06-09days on market $1,299,000 Active 41 DOM
-
2026-06-08days on market $1,299,000 Active 40 DOM
-
2026-06-07days on market $1,299,000 Active 39 DOM
-
2026-06-04days on market $1,299,000 Active 36 DOM
-
2026-06-03days on market $1,299,000 Active 35 DOM
-
2026-06-02days on market $1,299,000 Active 34 DOM
-
2026-06-01days on market $1,299,000 Active 33 DOM
-
2026-05-31days on market $1,299,000 Active 32 DOM
-
1986-11-26soldstatus $165,000
-
1986-11-26soldstatus $165,000
-
1986-04-30soldstatus $135,000
-
1986-04-30soldstatus $135,000
ⓘ Source: listings_history table (triggers on properties + properties_extension) + one-shot
backfill from property_details.listing_events for pre-trigger history.
Tax reassessment forecast CA · Resets to sale price
- Current annual tax
- $5,398 · $450/mo
- Projected year-2 tax
- $9,872 · $823/mo
- Expected delta
- +$4,474/yr (+$373/mo · 82.9%)
ⓘ Screening estimate from a state-policy table — verify with the county assessor before closing.
Climate risk First Street
- Flood 1/10 Low FEMA zone X (unshaded) · 0% chance over 30 yrs
- Wildfire 2/10 Low
- Heat 2/10 Low 8 d/yr ≥78°F today · 19 d/yr by 30 yrs out
- Wind 1/10 Low
- Air quality 7/10 Severe 13 unhealthy d/yr today · 13 by 30 yrs out
Nearby sold comps map
Loading sold comps map…
Walkable amenities ~0.75 mi
Loading nearby amenities…
Taxation est. · year 1
- Rental income
- $113,748
- − Mortgage interest
- −$72,764
- − Property taxes
- −$5,398
- − Insurance
- −$6,495
- − Repairs & maintenance
- −$9,100
- − Management
- −$9,100
- − Depreciation
- −$37,789
- Taxable loss
- −$26,898
- Est. tax savings @ 24.0%
- +$6,456
- After-tax cash flow
- $2,678/yr
For passive investors: Depreciation is non-cash, so a rental often shows a tax loss while cash-flowing — sheltering income. Rental losses are passive: they offset passive income freely, and up to $25,000/yr can offset ordinary (W-2) income if you actively participate and your MAGI is under $100k (phasing out to $0 by $150k); unused losses carry forward. On sale, claimed depreciation is recaptured at up to 25%, and gains may owe capital-gains tax (a 1031 exchange can defer both). Figures are a year-1 estimate at your 24.0% rate — not tax advice; consult a CPA.
Schools (NCES district)
- District
- South San Francisco Unified
- NCES district ID
- 0637530
- Math proficiency
- 38% ▼ -6.00%
- Reading proficiency
- 47% ▼ -5.00%
- Median HH income
- $82,986
- Composite
- 39.69/100
- National rank
- #3905
- State rank
- #176 of 517 in CA
Livability — South San Francisco
- Score
- 65/100
- State rank
- #372
- US rank
- #12707
Category grades
Schools grade is shown separately in the Schools card above.
Census & demographics
- Census place
- South San Francisco, CA
- County
- San Mateo County · 733,415 people
- City population
- 64,761
- Metro
- San Francisco-Oakland-Berkeley, CA
- Population (ZIP)
- 64,761
- Household income
- $136,733
- Rent vs Own
- Severe rent burden
- 2470.0
Population outlook (San Mateo County) Hauer SSP2
- Today (2025)
- 864,008 people
- By 2030
- 910,523 · +5.4%
- By 2040
- 997,285 · +15.4%
- By 2050
- 1,071,189 · +24.0%
- By 2075
- 1,197,206 · +38.6%
- By 2100
- 1,192,523 · +38.0%
Race, ethnicity, and origin ACS 2023
- Neighborhood character
- Diverse neighborhood (Simpson 0.68)
- Race & ethnicity
- Asian 42% Hispanic / Latino 31% White 21% Two or more races 13% Black 2% Pacific Islander 1%
- Hispanic origin (detail)
- Mexican 18%
- Common ancestry
- Lithuanian 1% Italian 1% Scotch-Irish 1%
- Foreign-born
- 40% · Canada, China, Vietnam
- Languages at home
- 47% English-only · Spanish 20% Tagalog/Filipino 12% Chinese 11%
Political lean MEDSL · San Mateo
- 2024 margin
- Solid D (+50.3) · D 73.5% · R 23.2% · Other 3.3%
- 2008→2024 swing
- +1.6pp toward D · 2008: 48.7pp · 2024: 50.3pp
- All cycles
- 2024: D+50.3 2020: D+57.7 2016: D+57.7 2012: D+44.8 2008: D+48.7
Not yet ingested
- Civics
- —
Market trends
- HPI YoY
- ▼ -1094.19%
- Current HPI
- 330.5769
- Rent YoY
- ▲ 6.02%
- Metro
- San Francisco-Oakland-Berkeley, CA
- State GDP YoY
- ▲ 3.21%
- F500 in state
- 116
Industry mix (Fortune 500 HQ in CA)
| Industry | F500 HQs | Revenue |
|---|---|---|
| Technology | 27 | $1,492B |
|
||
| Financial Services | 3 | $174B |
|
||
| Retail | 3 | $44B |
|
||
| Insurance | 3 | $26B |
|
||
| Media / Entertainment | 2 | $115B |
|
||
| Pharmaceuticals / Biotech | 2 | $62B |
|
||
Price history
+22.2% since first listed4 events — show timeline
- 1986-11-26 Sold (Public Records) $165,000 Public Records
- 1986-11-26 Sold (Public Records) $165,000 Public Records
- 1986-04-30 Sold (Public Records) $135,000 Public Records
- 1986-04-30 Sold (Public Records) $135,000 Public Records
Property tax history
+2.4%/yrLatest (2025): $5,398 · +1.2% YoY. Source: county tax records.
Cash-flow waterfall
monthlySold comps — $/sqft
last 12 mo · ≤1 miLoading sold comps…