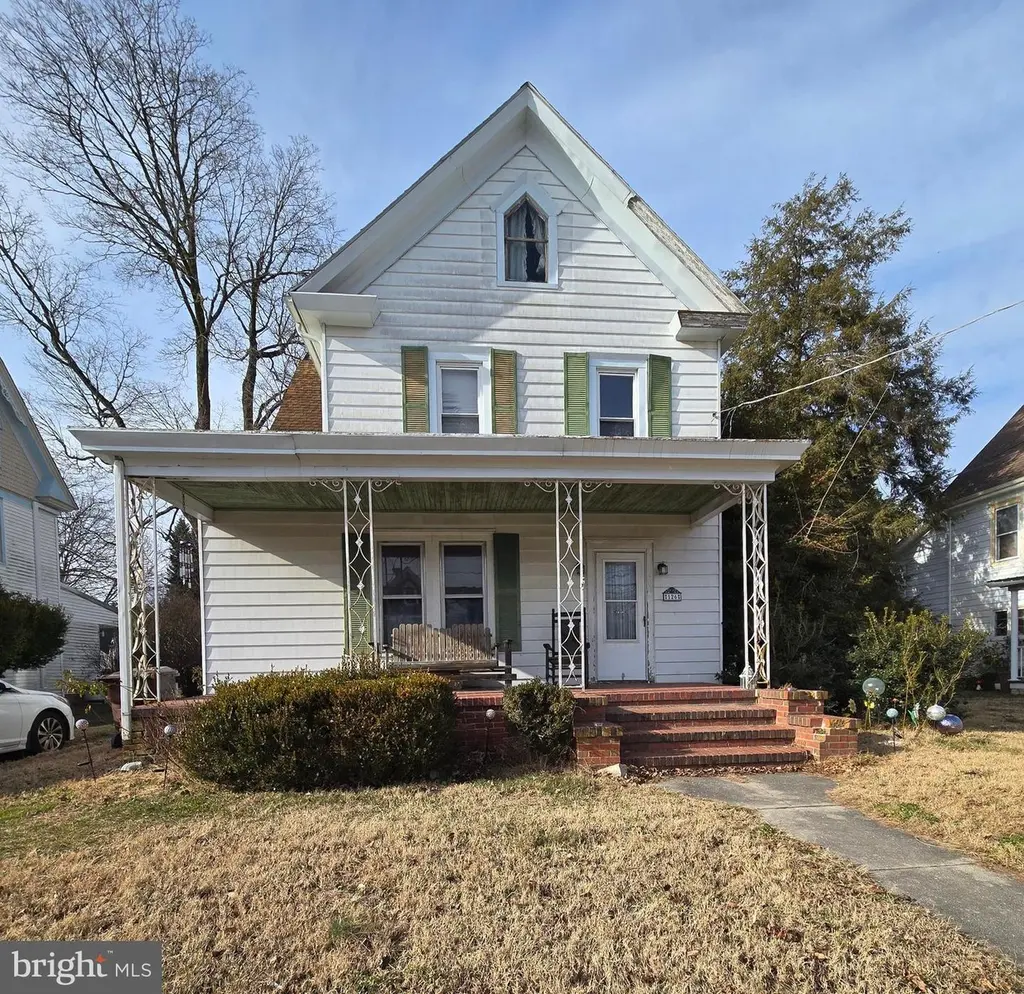
126 Maple Ave · Preston, MD
Flood risk 1/10 · Minimal
- FEMA flood zone
- X (unshaded)
- Chance of flooding over 30 yrs
- 0.0%
- Est. flood insurance / yr
- $473 – $860
Fire risk 3/10 · Minor
- Est. fire insurance / yr
- $755 – $1,403
Heat risk 9/10 · Severe
- Hot days now (above 104°F)
- 7 days/yr
- Hot days in 30 yrs
- 16 days/yr
Wind risk 6/10 · Moderate
- Chance of severe wind over 30 yrs
- 62.0%
Air-quality risk 3/10 · Minor
- Unhealthy air days now
- 2 days/yr
- Unhealthy air days in 30 yrs
- 3 days/yr
Risk factors via First Street. Map © Google.
Why this score? — see what drove the C grade
The composite is a weighted blend of 9 inputs, each scored 0–100. Each bar is that input's sub-score; the figure is the points it added to the 100-point composite (weight × sub-score).
- ARV discount +15.0/15.0
- Cash flow +12.9/30.0
- Appreciation +9.8/10.0
- DSCR +3.9/10.0
- 1% rule +3.4/10.0
- Livability +3.3/5.0
- Rent growth +2.5/5.0
- Condition / age +2.5/5.0
- Schools +1.9/10.0
$224,000
🖨 Deal sheet (PDF) 📄 Offer letter ✓ Due diligence
Listing remarks MLS
Step back in time with this early 1900s home. This home is full of character, from the detail in the trim work to the upper level 'porch. ' This home offers great potential to be returned to the early 1900s with a little TLC and vision. Located in the heart of Preston, it is 15 minutes from historic Easton with all its amenities. Come take a look and see the vision.
Key facts
- Upper level porch
- Early 1900s home
- 9,900 sq ft lot
Tags
Neighborhood map
What this means for you Summary
Snapshot
- This is a 3-bed/1.5-bath single-family listed at $224k.
Deal economics
- At list price, monthly cash flow is $-16 ($-190/yr) — negative.
- To cash-flow at today's rent, offer at most $221k (1.2% below list).
- To meet the 1% rule (rent ≥ 1% of price), the offer needs to be $187k (16.3% below list).
- Recommended offer: $187k (16.3% below list) — sets the bar for 1% rule.
- Cap rate 6.2% vs local median 4.5% in Preston — top-decile yield for the area; either an underpriced asset or a hidden risk that comps aren't pricing in. Stress-test before assuming the spread holds.
Location & tenants
- Location reads 66/100 on livability (#245 in MD) — a middle-class / working-renter tenant base. Strengths: housing A+, health & safety A+, cost of living B+; Watch: crime F, amenities F, commute F.
- Caroline County Public Schools (rural): math 13% / reading 29% proficiency, ranked #17 of 24 in MD (top 71%) — low school quality limits family demand, transient renter base, plan for 1-2y turnover.
- Zoned schools: Preston Elementary School (math 12% / reading 22%, grade F, #408 of 860 statewide, top 50%, 406 students, 60% FRL); Colonel Richardson Middle School (math 3% / reading 28%, grade F, #190 of 225 statewide, top 85%, 374 students, 72% FRL); Colonel Richardson High School (math 52% / reading 77%, grade B-, #55 of 222 statewide, top 26%, 549 students, 66% FRL) — zoned schools average 66% FRL vs 48% district-wide (18 pts higher); higher-poverty schools than district average — tighter screening recommended.
- Market conditions: 36 active listings in the ZIP; 59 units permitted in Caroline County in 2024 (0 in 5+ unit buildings).
Forward outlook
- In year one you build about $23k of equity ($2k loan paydown + $21k appreciation (9.6% local appreciation)).
- Caroline County population projected at -19% by 2050 — secular population decline; favor cash flow + early exit over multi-decade hold.
- At projected returns (9.6% appreciation + 3.0% rent growth), your $63k cash investment doubles in ~3 years — after that, you're playing with house money.
- By year 2, paydown + projected appreciation supports a ~$37k cash-out refi (75% LTV) — recoverable capital for the next deal without selling this one.
Negotiation context
- It's been on market 148 days — a 12% lower offer ($197k) is reasonable based on typical stale-listing flexibility.
- 2 sale attempts since 20y ago with the ask held roughly flat each time — persistent listings suggest the price (not the market) is what's stuck; bring a comps-based counter.
Risks & watch-outs
- Watch-outs: built in 1910 — expect roof / HVAC / electrical / plumbing capex.
- Climate carrying-cost: major wind risk, 62% chance of damaging wind over 30y; extreme-heat days projected 7→16/yr by 2055 (HVAC capex compounding) — expect insurance premiums to compound above CPI over the hold.
Questions for the listing agent
- What do current leases actually rent for vs. the listed asking? Can we see a recent rent roll and the last 12 months of T-12 income?
- It's been on market 148 days. Have you received any prior offers? Is the seller open to a 16% concession, seller financing, or rate buy-down credit?
- Built in 1910 — when were the roof, HVAC, electrical panel, plumbing, and water heater last replaced?
- Why hasn't it sold? Are there any deal-killer items the seller is aware of (foundation, flood, title, zoning, code violations)?
- Is there a deadline driving the sale (1031 exchange, divorce, estate, relocation)? That informs how much negotiation room exists.
- Crime grade is F in this area — have there been break-ins, vandalism, or insurance claims at this property in the last 3 years? What carrier currently insures it and at what premium?
- What's the average days-on-market for RENTAL listings here right now (not sales)? A rising rental-DOM trend means longer vacancies and softer asking-rent achievability than the comps imply.
- What's the recent tenant-quality profile in this submarket — average credit score on applications, eviction rate, late-payment / NSF rate, and stable-employment percentage? A property-management company in the area should have these aggregated.
- How much new for-sale + rental construction is in the pipeline within 1–3 miles? Heavy new supply typically softens prices + rents 12–24 months out; constrained supply supports both.
Investment metrics
- 1% rule
- 0.84% ✗
- Cap rate
- 6.21%
- Cash-on-cash
- -0.30%
- DSCR
- 0.99
- GRM
- 10.0
CMA / ARV
- ARV (median comp)
- $298,639
- List price
- $224,000
- Delta
- -24.99%
- Verdict
- UNDERPRICED
- Comps
- 20 within 1.0 mi
Show comp detail 3 sales within ~0.75 mi
| Address | Dist | Beds/Ba | Sqft | Sold | Price | $/sf | Match |
|---|---|---|---|---|---|---|---|
| 221 Apple Ln | 0.30mi | 4/2.0 (+1) | 1,700 (-7%) | 1mo | $355,000 | $209 | 67 |
| 3622 Choptank Rd | 0.26mi | 2/1.5 (-1) | 1,700 (-7%) | 6mo | $295,900 | $174 | 66 |
| 111 Fooks Ave | 0.42mi | 4/2.0 (+1) | 2,072 (+13%) | 23mo | $335,000 | $162 | 32 |
Match score weights: distance 35% · size 25% · config 20% · recency 20%. Top-matched comps best support the ARV.
Projected returns pro-forma
9.58% appreciation · 3.0% rent growth · sell at horizon
- IRR
- 23.2%
- Equity multiple
- 2.83×
- Total profit
- $114,589
- Equity at exit
- $194,993
- IRR
- 20.7%
- Equity multiple
- 6.37×
- Total profit
- $336,660
- Equity at exit
- $413,473
Cash invested: $62,720 (down + closing). Projections, not guarantees.
Landlord ↔ Tenant lean methodology
- Overall (STATE)
- 27 Tenant-Leaning
- State Maryland
- 27 Tenant-Leaning · D+14
- County
- — inherits STATE
- City
- — inherits STATE
ZIP-level market 21655
- Home prices YoY
- 3.1%
- Active inventory
- 36
- Price-to-rent
- 10.0×
Monthly cashflow live
- Estimated rent
- $1,875 medium interval (Pro) →
- Mortgage (P&I)
- −$1,175
- Tax from tax record
- −$229 /mo · $2,746/yr
- Insurance
- −$93
- HOA
- −$0
- Vacancy / Maint / Mgmt
- −$394
- Net cashflow
- $-16
Break-even live
Sensitivity live
| Price | -10% $111 | -5% $48 | +0% $-16 | +5% $-79 | +10% $-143 |
|---|---|---|---|---|---|
| Rent | -10% $-164 | -5% $-90 | +0% $-16 | +5% $58 | +10% $132 |
| Rate | -1.0pp $97 | -0.5pp $41 | base $-16 | +0.5pp $-74 | +1.0pp $-133 |
UW: 25.0% down · 7.5% · 30yr · 1.5% tax · 5.0% vac · 8.0% maint · 8.0% mgmt
Financing live
Cash to close
- Down payment
- $56,000
- Closing costs
- $6,720
- Reserves months
- —
- Total cash needed
- —
Loan-product check · same deal, 3 products live
Conventional
25% down · 7.5% · 30yr
- Down + closing
- —
- Monthly P&I
- —
- Monthly cashflow
- —
- DSCR
- —
- Eligible?
- —
Personal DTI + credit; lowest rate.
DSCR
20% down · 8.5% · 30yr
- Down + closing
- —
- Monthly P&I
- —
- Monthly cashflow
- —
- DSCR
- —
- Eligible?
- —
No personal income docs; deal must DSCR.
Hard money
10% down · 12.0% · 12mo
- Down + closing
- —
- Monthly P&I
- —
- Monthly cashflow
- —
- DSCR
- —
- Eligible?
- —
Short-term bridge; refi at stabilization.
Listing history 22 events
-
2026-06-21days on market $224,000 Active 148 DOM
-
2026-06-21days on market $224,000 Active 147 DOM
-
2026-06-18days on market $224,000 Active 145 DOM
-
2026-06-17days on market $224,000 Active 144 DOM
-
2026-06-16days on market $224,000 Active 143 DOM
-
2026-06-15days on market $224,000 Active 142 DOM
-
2026-06-13days on market $224,000 Active 140 DOM
-
2026-06-12days on market $224,000 Active 139 DOM
-
2026-06-09days on market $224,000 Active 136 DOM
-
2026-06-08days on market $224,000 Active 135 DOM
-
2026-06-07days on market $224,000 Active 134 DOM
-
2026-06-07days on market $224,000 Active 133 DOM
-
2026-06-04days on market $224,000 Active 130 DOM
-
2026-06-02days on market $224,000 Active 129 DOM
-
2026-06-01days on market $224,000 Active 128 DOM
-
2026-05-31days on market $224,000 Active 127 DOM
-
2026-05-31days on market $224,000 Active 126 DOM
-
2026-05-14price $224,000 369-char remark
Show marketing remark (369 chars)
Step back in time with this early 1900s home. This home is full of character, from the detail in the trim work to the upper level 'porch. ' This home offers great potential to be returned to the early 1900s with a little TLC and vision. Located in the heart of Preston, it is 15 minutes from historic Easton with all its amenities. Come take a look and see the vision.
-
2026-03-25price $227,000 369-char remark
Show marketing remark (369 chars)
Step back in time with this early 1900s home. This home is full of character, from the detail in the trim work to the upper level 'porch. ' This home offers great potential to be returned to the early 1900s with a little TLC and vision. Located in the heart of Preston, it is 15 minutes from historic Easton with all its amenities. Come take a look and see the vision.
-
2026-01-24$230,000 Active 369-char remark
Show marketing remark (369 chars)
Step back in time with this early 1900s home. This home is full of character, from the detail in the trim work to the upper level 'porch. ' This home offers great potential to be returned to the early 1900s with a little TLC and vision. Located in the heart of Preston, it is 15 minutes from historic Easton with all its amenities. Come take a look and see the vision.
-
2007-06-11historical
-
2006-09-12
ⓘ Source: listings_history table (triggers on properties + properties_extension) + one-shot
backfill from property_details.listing_events for pre-trigger history.
Tax reassessment forecast MD · Partial reset (capped growth)
- Current annual tax
- $2,746 · $229/mo
- Projected year-2 tax
- $2,746 · $229/mo
- Expected delta
- $0/yr ($0/mo · 0.0%)
ⓘ Screening estimate from a state-policy table — verify with the county assessor before closing.
Climate risk First Street
- Flood 1/10 Low FEMA zone X (unshaded) · 0% chance over 30 yrs
- Wildfire 3/10 Moderate
- Heat 9/10 Extreme 7 d/yr ≥104°F today · 16 d/yr by 30 yrs out
- Wind 6/10 Major 62% chance of damaging wind over 30 yrs
- Air quality 3/10 Moderate 2 unhealthy d/yr today · 3 by 30 yrs out
Nearby sold comps map
Loading sold comps map…
Walkable amenities ~0.75 mi
Loading nearby amenities…
Taxation est. · year 1
- Rental income
- $22,496
- − Mortgage interest
- −$12,547
- − Property taxes
- −$2,746
- − Insurance
- −$1,120
- − Repairs & maintenance
- −$1,800
- − Management
- −$1,800
- − Depreciation
- −$6,516
- Taxable loss
- −$4,033
- Est. tax savings @ 24.0%
- +$968
- After-tax cash flow
- $778/yr
For passive investors: Depreciation is non-cash, so a rental often shows a tax loss while cash-flowing — sheltering income. Rental losses are passive: they offset passive income freely, and up to $25,000/yr can offset ordinary (W-2) income if you actively participate and your MAGI is under $100k (phasing out to $0 by $150k); unused losses carry forward. On sale, claimed depreciation is recaptured at up to 25%, and gains may owe capital-gains tax (a 1031 exchange can defer both). Figures are a year-1 estimate at your 24.0% rate — not tax advice; consult a CPA.
Schools (NCES district)
- District
- Caroline County Public Schools
- NCES district ID
- 2400180
- Math proficiency
- 13% ▼ -22.00%
- Reading proficiency
- 29% ▼ -14.00%
- Median HH income
- $55,076
- Composite
- 19.16/100
- National rank
- #8823
- State rank
- #17 of 24 in MD
Livability — Preston
- Score
- 66/100
- State rank
- #245
- US rank
- #12172
Category grades
Schools grade is shown separately in the Schools card above.
Census & demographics
- Census place
- Preston, MD
- Population (ZIP)
- 4,995
Population outlook (Caroline County) Hauer SSP2
- Today (2025)
- 31,205 people
- By 2030
- 30,204 · -3.2%
- By 2040
- 27,866 · -10.7%
- By 2050
- 25,342 · -18.8%
- By 2075
- 20,554 · -34.1%
- By 2100
- 17,415 · -44.2%
Race, ethnicity, and origin ACS 2023
- Neighborhood character
- Predominantly White (79%)
- Race & ethnicity
- White 79% Black 10% Two or more races 7% Hispanic / Latino 2%
- Common ancestry
- Slovak 2% Italian 1% Romanian 1%
- Foreign-born
- 1%
- Languages at home
- 98% English-only · Other Indo-European 1%
Political lean MEDSL · Caroline
- 2024 margin
- Solid R (+38.0) · D 29.9% · R 67.9% · Other 2.2%
- 2008→2024 swing
- -15.0pp toward R · 2008: -23.0pp · 2024: -38.0pp
- All cycles
- 2024: R+38.0 2020: R+32.9 2016: R+39.5 2012: R+24.4 2008: R+23.0
Not yet ingested
- Civics
- —
Market trends
- HPI YoY
- ▲ 9.58%
- Current HPI
- 319.9345
- Rent YoY
- —
- Metro
- —
- State GDP YoY
- ▲ 2.97%
- F500 in state
- 12
Industry mix (Fortune 500 HQ in MD)
| Industry | F500 HQs | Revenue |
|---|---|---|
| Aerospace / Defense | 1 | $71B |
|
||
| Utilities | 1 | $25B |
|
||
| Hotels | 1 | $24B |
|
||
| Consumer Goods | 1 | $7B |
|
||
| Real Estate | 1 | $6B |
|
||
| Chemicals | 1 | $2B |
|
||
Price history
-2.6% since first listed5 events — show timeline
- 2026-05-14 Price Changed $224,000 BRIGHT MLS
- 2026-03-25 Price Changed $227,000 BRIGHT MLS
- 2026-01-24 Listed $230,000 BRIGHT MLS
- 2007-06-11 Delisted — MRIS
- 2006-09-12 Listed — MRIS
Property tax history
+4.9%/yrLatest (2025): $2,746 · +5.4% YoY. Source: county tax records.
Cash-flow waterfall
monthlySold comps — $/sqft
last 12 mo · ≤1 miLoading sold comps…