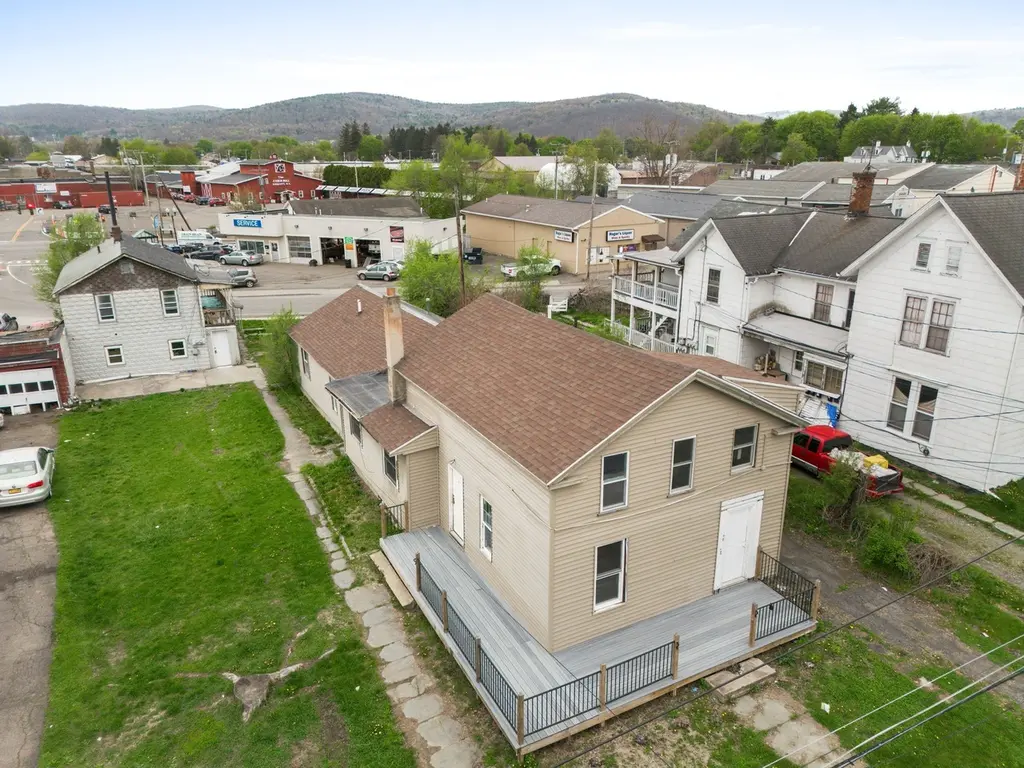
8 S Liberty Ave · Endicott, NY
Flood risk 5/10 · Moderate
- FEMA flood zone
- X (shaded)
- Chance of flooding over 30 yrs
- 0.27%
- Est. flood insurance / yr
- $473 – $860
Fire risk 1/10 · Minimal
- Est. fire insurance / yr
- $691 – $1,283
Heat risk 3/10 · Minor
- Hot days now (above 93°F)
- 8 days/yr
- Hot days in 30 yrs
- 17 days/yr
Wind risk 2/10 · Minimal
- Chance of severe wind over 30 yrs
- 1.0%
Air-quality risk 2/10 · Minimal
- Unhealthy air days now
- 0 days/yr
- Unhealthy air days in 30 yrs
- 1 days/yr
Risk factors via First Street. Map © Google.
Why this score? — see what drove the D grade
The composite is a weighted blend of 9 inputs, each scored 0–100. Each bar is that input's sub-score; the figure is the points it added to the 100-point composite (weight × sub-score).
- Cash flow +12.0/30.0
- ARV discount +7.5/15.0
- Rent growth +4.3/5.0
- Schools +4.3/10.0
- 1% rule +3.9/10.0
- DSCR +3.5/10.0
- Livability +3.5/5.0
- Condition / age +2.5/5.0
- Appreciation +0.0/10.0
$180,000
🖨 Deal sheet (PDF) 📄 Offer letter ✓ Due diligence
Listing remarks
Value-add 3+2 (5)-unit investment opportunity in Endicott! This multi-family property features multiple refreshed interiors with bright white walls, updated wood-look flooring, some newer kitchen cabinetry, and a modern tiled shower in one unit. Several areas have been improved, while additional unfinished spaces allow the next owner to complete renovations and maximize rental potential. Exterior highlights include vinyl siding, a large front deck, yard space, and a convenient in-town location close to services and amenities. A great opportunity for investors looking to build equity and generate cash flow.
Key facts
- Large front deck
- Refreshed interiors
- Modern tiled shower
Tags
Property features AI
Exterior
- Parking: Attached garage with driveway (1 garage space)
- Utilities: Public water; Public sewer; Cable available
- Home design: Residential income property (apartment); Above-grade finished area about 2,903
- Construction: Vinyl siding; Stone foundation
- Exterior features: Level lot; Lot dimensions approximately 66 x 151
Interior
- Kitchen: Gas water heater (appliance)
- Bedrooms: Unit mix includes two 1-bedroom units and three 2-bedroom units
- Flooring: Vinyl flooring
- Bathrooms: Five full bathrooms total
- Heating & cooling: Forced air heating; No central cooling
- Interior features: High speed internet; Partial basement
- Laundry & utility: Gas water heater
Neighborhood map
What this means for you Summary
Snapshot
- This is a 4-bed/3.0-bath other listed at $180k.
Deal economics
- At list price, monthly cash flow is $-43 ($-521/yr) — negative.
- To cash-flow at today's rent, offer at most $172k (4.3% below list).
- To meet the 1% rule (rent ≥ 1% of price), the offer needs to be $161k (10.6% below list).
- Recommended offer: $161k (10.6% below list) — sets the bar for 1% rule.
Location & tenants
- Location reads 70/100 on livability (#438 in NY) — a middle-class / working-renter tenant base. Strengths: cost of living A+, health & safety A+, housing A; Watch: amenities D, crime F, commute F.
- Union-Endicott Central School District (suburban): math 43% / reading 57% proficiency, ranked #387 of 590 in NY (top 66%) — acceptable for families but not a draw, mixed tenant base, ~2y average lease.
- Zoned schools: Charles F Johnson Jr Elementary School (math 17% / reading 27%, grade F, #1,923 of 2,108 statewide, top 92%, 387 students, 66% FRL); Jennie F Snapp Middle School (math 31% / reading 51%, grade F, #402 of 729 statewide, top 56%, 822 students, 65% FRL); Union-Endicott High School (math 91% / reading 90%, grade A+, #231 of 1,100 statewide, top 21%, 999 students, 41% FRL) — zoned schools average 57% FRL vs 42% district-wide (15 pts higher); higher-poverty schools than district average — tighter screening recommended.
- Market conditions: Rents rising fast (+7.1%/yr); 217 active listings in the ZIP; 7 comparable units currently listed for rent nearby; rentals lingering (median 45d on market — plan ~5-8 weeks vacancy on turnover, expect pricing pressure); 57% of comp listings sitting > 30 days — soft ceiling on asking rent; 340 units permitted in Broome County in 2024 (269 in 5+ unit buildings).
Forward outlook
- Local home prices are declining (-3.0%/yr); year-one equity from $1k of loan paydown is wiped out by about $5k of value loss. Plan a longer hold.
- Broome County population projected at -13% by 2050 — secular population decline; favor cash flow + early exit over multi-decade hold.
Negotiation context
- It's been on market 31 days — a 3% lower offer ($175k) is reasonable based on typical stale-listing flexibility.
- Current owner paid $110k; list at $180k implies a 64% gain — meaningful room to come down on a strong offer.
Risks & watch-outs
- Watch-outs: built in 1900 — expect roof / HVAC / electrical / plumbing capex.
- Climate carrying-cost: moderate flood risk — expect insurance premiums to compound above CPI over the hold.
Questions for the listing agent
- What do current leases actually rent for vs. the listed asking? Can we see a recent rent roll and the last 12 months of T-12 income?
- It's been on market 31 days. Have you received any prior offers? Is the seller open to a 11% concession, seller financing, or rate buy-down credit?
- Built in 1900 — when were the roof, HVAC, electrical panel, plumbing, and water heater last replaced?
- Is there a deadline driving the sale (1031 exchange, divorce, estate, relocation)? That informs how much negotiation room exists.
- Schools are D-rated, which usually means shorter tenancies and higher turnover. Who's the typical renter profile here, and what's been the actual vacancy rate?
- Crime grade is F in this area — have there been break-ins, vandalism, or insurance claims at this property in the last 3 years? What carrier currently insures it and at what premium?
- The area grade is low — what's the realistic commute time and amenity access for the typical tenant pool here? Any planned neighborhood developments (good or bad) we should know about?
- What's the average days-on-market for RENTAL listings here right now (not sales)? A rising rental-DOM trend means longer vacancies and softer asking-rent achievability than the comps imply.
- What's the recent tenant-quality profile in this submarket — average credit score on applications, eviction rate, late-payment / NSF rate, and stable-employment percentage? A property-management company in the area should have these aggregated.
- How much new for-sale + rental construction is in the pipeline within 1–3 miles? Heavy new supply typically softens prices + rents 12–24 months out; constrained supply supports both.
Investment metrics
- 1% rule
- 0.89% ✗
- Cap rate
- 6.00%
- Cash-on-cash
- -1.03%
- DSCR
- 0.95
- GRM
- 9.3
CMA / ARV
No comps found within radius.
Projected returns pro-forma
-3.0% appreciation · 7.09% rent growth · sell at horizon
- IRR
- -13.2%
- Equity multiple
- 0.50×
- Total profit
- $-24,974
- Equity at exit
- $26,839
- IRR
- 1.4%
- Equity multiple
- 1.11×
- Total profit
- $5,738
- Equity at exit
- $15,563
Cash invested: $50,400 (down + closing). Projections, not guarantees.
Landlord ↔ Tenant lean methodology
- Overall (STATE)
- 15 Strongly Tenant-Friendly
- State New York
- 15 Strongly Tenant-Friendly · D+10
- County
- — inherits STATE
- City
- — inherits STATE
ZIP-level market 13760
- Home prices YoY
- -32.7%
- Rents YoY
- 7.1%
- Active inventory
- 217
- Price-to-rent
- 9.3×
Monthly cashflow live
- Estimated rent
- $1,609 high interval (Pro) →
- Mortgage (P&I)
- −$944
- Tax from tax record
- −$295 /mo · $3,544/yr
- Insurance
- −$75
- HOA
- −$0
- Vacancy / Maint / Mgmt
- −$338
- Net cashflow
- $-43
Break-even live
Sensitivity live
| Price | -10% $58 | -5% $8 | +0% $-43 | +5% $-94 | +10% $-145 |
|---|---|---|---|---|---|
| Rent | -10% $-171 | -5% $-107 | +0% $-43 | +5% $20 | +10% $84 |
| Rate | -1.0pp $47 | -0.5pp $2 | base $-43 | +0.5pp $-90 | +1.0pp $-138 |
UW: 25.0% down · 7.5% · 30yr · 1.5% tax · 5.0% vac · 8.0% maint · 8.0% mgmt
Financing live
Cash to close
- Down payment
- $45,000
- Closing costs
- $5,400
- Reserves months
- —
- Total cash needed
- —
Loan-product check · same deal, 3 products live
Conventional
25% down · 7.5% · 30yr
- Down + closing
- —
- Monthly P&I
- —
- Monthly cashflow
- —
- DSCR
- —
- Eligible?
- —
Personal DTI + credit; lowest rate.
DSCR
20% down · 8.5% · 30yr
- Down + closing
- —
- Monthly P&I
- —
- Monthly cashflow
- —
- DSCR
- —
- Eligible?
- —
No personal income docs; deal must DSCR.
Hard money
10% down · 12.0% · 12mo
- Down + closing
- —
- Monthly P&I
- —
- Monthly cashflow
- —
- DSCR
- —
- Eligible?
- —
Short-term bridge; refi at stabilization.
Rent comps 7 comps
| Address | Beds | Baths | Sqft | Rent | $/sqft | DOM | Units | Dist |
|---|---|---|---|---|---|---|---|---|
| 804 Broad St Unit 2 Endicott, NY | 3.0 | 1.0 | 975 | $1,500 | $1.54 | 45d | 1 | 0.57mi |
| 106 Madison Ave Unit 1 Endicott, NY | 3.0 | 1.0 | 1050 | $1,500 | $1.43 | 45d | 1 | 0.79mi |
| 1 Jane Lacey Dr Endicott, NY | 1.0–3.0 | 1.0–1.5 | 900 | $1,305 | $1.45 | 22d | 1 | 1.09mi |
| 1807 Riverview Dr #1 Endicott, NY | 3.0 | 1.5 | 1266 | $1,800 | $1.42 | 22d | 1 | 1.28mi |
| 112 N Roosevelt Ave Endicott, NY | 3.0 | 2.0 | 1299 | $1,850 | $1.42 | 45d | 1 | 1.35mi |
| 317 Rogers Ave Unit 2 Endicott, NY | 3.0 | 1.0 | 1000 | $1,300 | $1.30 | 22d | 1 | 1.42mi |
| 1211 Pine St #1 Endicott, NY | 3.0 | 1.0 | 952 | $1,400 | $1.47 | 45d | 1 | 1.43mi |
Listing history 20 events
-
2026-06-22days on market $180,000 Active 31 DOM
-
2026-06-19days on market $180,000 Active 29 DOM
-
2026-06-18days on market $180,000 Active 28 DOM
-
2026-06-17days on market $180,000 Active 27 DOM
-
2026-06-16days on market $180,000 Active 26 DOM
-
2026-06-15days on market $180,000 Active 25 DOM
-
2026-06-14days on market $180,000 Active 23 DOM
-
2026-06-13days on market $180,000 Active 22 DOM
-
2026-06-10days on market $180,000 Active 20 DOM
-
2026-06-09days on market $180,000 Active 19 DOM
-
2026-06-08days on market $180,000 Active 18 DOM
-
2026-06-07days on market $180,000 Active 17 DOM
-
2026-06-05days on market $180,000 Active 14 DOM
-
2026-06-03days on market $180,000 Active 13 DOM
-
2026-06-02days on market $180,000 Active 12 DOM
-
2026-06-01days on market $180,000 Active 11 DOM
-
2026-05-31days on market $180,000 Active 10 DOM
-
2026-05-30days on market $180,000 Active 9 DOM
-
2026-05-21$180,000 Active
-
2024-09-20soldstatus $110,000
ⓘ Source: listings_history table (triggers on properties + properties_extension) + one-shot
backfill from property_details.listing_events for pre-trigger history.
Tax reassessment forecast NY · Partial reset (capped growth)
- Current annual tax
- $3,544 · $295/mo
- Projected year-2 tax
- $3,544 · $295/mo
- Expected delta
- $0/yr ($0/mo · 0.0%)
ⓘ Screening estimate from a state-policy table — verify with the county assessor before closing.
Climate risk First Street
- Flood 5/10 Major FEMA zone X (shaded) · 27% chance over 30 yrs
- Wildfire 1/10 Low
- Heat 3/10 Moderate 8 d/yr ≥93°F today · 17 d/yr by 30 yrs out
- Wind 2/10 Low 100% chance of damaging wind over 30 yrs
- Air quality 2/10 Low 0 unhealthy d/yr today · 1 by 30 yrs out
Nearby sold comps map
Loading sold comps map…
Walkable amenities ~0.75 mi
Loading nearby amenities…
Taxation est. · year 1
- Rental income
- $19,304
- − Mortgage interest
- −$10,083
- − Property taxes
- −$3,544
- − Insurance
- −$900
- − Repairs & maintenance
- −$1,544
- − Management
- −$1,544
- − Depreciation
- −$5,236
- Taxable loss
- −$3,548
- Est. tax savings @ 24.0%
- +$851
- After-tax cash flow
- $330/yr
For passive investors: Depreciation is non-cash, so a rental often shows a tax loss while cash-flowing — sheltering income. Rental losses are passive: they offset passive income freely, and up to $25,000/yr can offset ordinary (W-2) income if you actively participate and your MAGI is under $100k (phasing out to $0 by $150k); unused losses carry forward. On sale, claimed depreciation is recaptured at up to 25%, and gains may owe capital-gains tax (a 1031 exchange can defer both). Figures are a year-1 estimate at your 24.0% rate — not tax advice; consult a CPA.
Schools (NCES district)
- District
- Union-Endicott Central School District
- NCES district ID
- 3610710
- Math proficiency
- 43% ▼ -9.00%
- Reading proficiency
- 57% ▲ 11.00%
- Median HH income
- $49,265
- Composite
- 42.66/100
- National rank
- #3176
- State rank
- #387 of 590 in NY
Livability — Endicott
- Score
- 70/100
- State rank
- #438
- US rank
- #7657
Category grades
Schools grade is shown separately in the Schools card above.
Census & demographics
- Census place
- Endicott, NY
- County
- Broome County · 126,805 people
- City population
- 42,896
- Metro
- Binghamton, NY
- Population (ZIP)
- 42,896
- Household income
- $66,095
- Rent vs Own
- Severe rent burden
- 1480.0
Population outlook (Broome County) Hauer SSP2
- Today (2025)
- 187,989 people
- By 2030
- 183,066 · -2.6%
- By 2040
- 172,228 · -8.4%
- By 2050
- 163,161 · -13.2%
- By 2075
- 153,641 · -18.3%
- By 2100
- 140,851 · -25.1%
Race, ethnicity, and origin ACS 2023
- Neighborhood character
- Predominantly White (84%)
- Race & ethnicity
- White 84% Two or more races 7% Hispanic / Latino 6% Black 4% Asian 2%
- Hispanic origin (detail)
- Puerto Rican 2%
- Common ancestry
- Romanian 6% Lithuanian 2% Slovak 2%
- Foreign-born
- 5% · Canada, China
- Languages at home
- 94% English-only · Spanish 2% Other Indo-European 1% Russian/Polish/Slavic 1%
Political lean MEDSL · Broome
- 2024 margin
- Toss-up / Even · D 50.2% · R 49.8%
- 2008→2024 swing
- -7.6pp toward R · 2008: 8.0pp · 2024: 0.4pp
- All cycles
- 2024: D+0.4 2020: D+3.5 2016: R+3.7 2012: D+4.6 2008: D+8.0
Not yet ingested
- Civics
- —
Market trends
- HPI YoY
- ▼ -131.29%
- Current HPI
- 270.2661
- Rent YoY
- ▲ 7.09%
- Metro
- Binghamton, NY
- State GDP YoY
- ▲ 2.60%
- F500 in state
- 92
Industry mix (Fortune 500 HQ in NY)
| Industry | F500 HQs | Revenue |
|---|---|---|
| Financial Services | 10 | $950B |
|
||
| Consumer Goods | 9 | $162B |
|
||
| Insurance | 4 | $225B |
|
||
| Telecommunications | 2 | $144B |
|
||
| Pharmaceuticals | 2 | $112B |
|
||
| Media / Entertainment | 2 | $69B |
|
||
Price history
+63.6% since first listed2 events — show timeline
- 2026-05-21 Listed $180,000 GBAOR
- 2024-09-20 Sold (Public Records) $110,000 Public Records
Property tax history
-0.2%/yrLatest (2025): $3,544 · +6.3% YoY. Source: county tax records.
Cash-flow waterfall
monthlySold comps — $/sqft
last 12 mo · ≤1 miLoading sold comps…