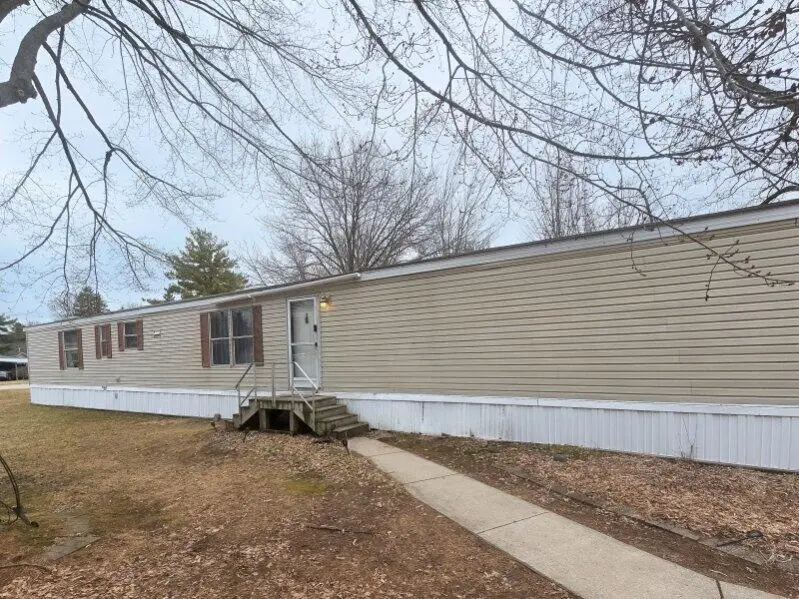
3408 Aster Ct · Midland, MI
Flood risk No data
- FEMA flood zone
- —
- Chance of flooding over 30 yrs
- —
- Est. flood insurance / yr
- —
Fire risk No data
- Est. fire insurance / yr
- —
Heat risk No data
- Hot days now (above threshold)
- —
- Hot days in 30 yrs
- —
Wind risk No data
- Chance of severe wind over 30 yrs
- —
Air-quality risk No data
- Unhealthy air days now
- —
- Unhealthy air days in 30 yrs
- —
Risk factors via First Street. Map © Google.
Why this score? — see what drove the D+ grade
The composite is a weighted blend of 9 inputs, each scored 0–100. Each bar is that input's sub-score; the figure is the points it added to the 100-point composite (weight × sub-score).
- Cash flow +15.0/30.0
- ARV discount +7.5/15.0
- 1% rule +5.0/10.0
- DSCR +5.0/10.0
- Schools +4.9/10.0
- Livability +4.2/5.0
- Rent growth +2.7/5.0
- Condition / age +2.5/5.0
- Appreciation +0.0/10.0
$39,900
🖨 Deal sheet 📄 Offer letter ✓ Due diligence
Listing remarks MLS
Take advantage of 2 full months of FREE lot rent -- a huge savings for the next owner right from day one. Well-maintained 3-bedroom, 2-bath mobile home located in the desirable Alpine Village community. This home features a functional layout with a spacious living area, private primary suite, and two additional bedrooms perfect for family, guests, or office space. Located in a clean, quiet park with professional management, this home offers affordable, low-maintenance living in a welcoming neighborhood setting. Owner must relocate for work, creating a motivated opportunity for buyers looking for value, space, and comfort in a well-kept community.
Key facts
- Built 1999
- Listed 88 days
Neighborhood map
What this means for you Summary
Snapshot
- This is a 3-bed/2.0-bath other listed at $40k.
Deal economics
- At list price, monthly cash flow is $1k ($14k/yr) — positive.
- The deal already cash-flows at list — no discount required.
- Meets the 1% rule at list price ($2k rent vs $40k).
- Recommended offer: $38k (6.0% below list) — sets the bar for market timing.
- Cap rate 40.5% vs local median 4.4% in Midland — top-decile yield for the area; either an underpriced asset or a hidden risk that comps aren't pricing in. Stress-test before assuming the spread holds.
Location & tenants
- Location reads 85/100 on livability (#28 in MI, #578 nationally) — a professional / high-income tenant draw. Strengths: crime A+, cost of living A+, housing A+; Watch: commute F.
- Midland Public Schools (urban): math 49% / reading 64% proficiency, ranked #62 of 540 in MI (top 12%) — acceptable for families but not a draw, mixed tenant base, ~2y average lease.
- Market conditions: Rents flat; 95 active listings in the ZIP; solid renter incomes; 320 units permitted in Midland County in 2024 (204 in 5+ unit buildings).
Forward outlook
- Local home prices are declining (-3.0%/yr); year-one equity from $276 of loan paydown is wiped out by about $1k of value loss. Plan a longer hold.
- Midland County population projected to shrink 9% by 2050 — rents likely to lag national; underwrite the cash flow, not the appreciation.
- At projected returns (-3.0% appreciation + 0.6% rent growth), your $11k cash investment doubles in ~1 year — after that, you're playing with house money.
Negotiation context
- It's been on market 89 days — a 6% lower offer ($38k) is reasonable based on typical stale-listing flexibility.
- 3 sale attempts with the ask held roughly flat each time — persistent listings suggest the price (not the market) is what's stuck; bring a comps-based counter.
Questions for the listing agent
- It's been on market 89 days. Have you received any prior offers? Is the seller open to a 6% concession, seller financing, or rate buy-down credit?
- Why hasn't it sold? Are there any deal-killer items the seller is aware of (foundation, flood, title, zoning, code violations)?
- Is there a deadline driving the sale (1031 exchange, divorce, estate, relocation)? That informs how much negotiation room exists.
- Schools are A-rated — typically a magnet for longer-tenancy family renters. What's the average tenant stay here, and is there a school-zone premium baked into asking?
- The area grade is low — what's the realistic commute time and amenity access for the typical tenant pool here? Any planned neighborhood developments (good or bad) we should know about?
- What's the average days-on-market for RENTAL listings here right now (not sales)? A rising rental-DOM trend means longer vacancies and softer asking-rent achievability than the comps imply.
- What's the recent tenant-quality profile in this submarket — average credit score on applications, eviction rate, late-payment / NSF rate, and stable-employment percentage? A property-management company in the area should have these aggregated.
- How much new for-sale + rental construction is in the pipeline within 1–3 miles? Heavy new supply typically softens prices + rents 12–24 months out; constrained supply supports both.
Investment metrics
- 1% rule
- 4.49% ✓
- Cap rate
- 40.53%
- Cash-on-cash
- 122.26%
- DSCR
- 6.44
- GRM
- 1.9
CMA / ARV
No comps found within radius.
Projected returns pro-forma
-3.0% appreciation · 0.6% rent growth · sell at horizon
- IRR
- —
- Equity multiple
- 6.54×
- Total profit
- $61,838
- Equity at exit
- $5,949
- IRR
- —
- Equity multiple
- 12.71×
- Total profit
- $130,801
- Equity at exit
- $3,450
Cash invested: $11,172 (down + closing). Projections, not guarantees.
Landlord ↔ Tenant lean methodology
- Overall (STATE)
- 62 Landlord-Friendly
- State Michigan
- 62 Landlord-Friendly · EVEN
- County
- — inherits STATE
- City
- — inherits STATE
ZIP-level market 48642
- Home prices YoY
- -31.4%
- Rents YoY
- 0.6%
- Active inventory
- 95
- Price-to-rent
- 1.9×
Monthly cashflow live
- Estimated rent
- $1,790 medium interval (Pro) →
- Mortgage (P&I)
- −$209
- Tax est. 1.5%
- −$50 /mo · $598/yr
- Insurance
- −$17
- HOA
- −$0
- Vacancy / Maint / Mgmt
- −$376
- Net cashflow
- $1,138
Break-even live
UW: 25.0% down · 7.5% · 30yr · 1.5% tax · 5.0% vac · 8.0% maint · 8.0% mgmt
Financing live
Cash to close
- Down payment
- $9,975
- Closing costs
- $1,197
- Reserves months
- —
- Total cash needed
- —
Loan-product check · same deal, 3 products live
Conventional
25% down · 7.5% · 30yr
- Down + closing
- —
- Monthly P&I
- —
- Monthly cashflow
- —
- DSCR
- —
- Eligible?
- —
Personal DTI + credit; lowest rate.
DSCR
20% down · 8.5% · 30yr
- Down + closing
- —
- Monthly P&I
- —
- Monthly cashflow
- —
- DSCR
- —
- Eligible?
- —
No personal income docs; deal must DSCR.
Hard money
10% down · 12.0% · 12mo
- Down + closing
- —
- Monthly P&I
- —
- Monthly cashflow
- —
- DSCR
- —
- Eligible?
- —
Short-term bridge; refi at stabilization.
Listing history 18 events
-
2026-06-19days on market $39,900 Active 89 DOM
-
2026-06-18days on market $39,900 Active 88 DOM
-
2026-06-17days on market $39,900 Active 87 DOM
-
2026-06-16days on market $39,900 Active 86 DOM
-
2026-06-15days on market $39,900 Active 85 DOM
-
2026-06-14days on market $39,900 Active 83 DOM
-
2026-06-13days on market $39,900 Active 82 DOM
-
2026-06-10days on market $39,900 Active 80 DOM
-
2026-06-09days on market $39,900 Active 79 DOM
-
2026-06-08days on market $39,900 Active 78 DOM
-
2026-06-07days on market $39,900 Active 77 DOM
-
2026-06-02days on market $39,900 Active 72 DOM
-
2026-06-01days on market $39,900 Active 71 DOM
-
2026-05-31days on market $39,900 Active 70 DOM
-
2026-05-30days on market $39,900 Active 69 DOM
-
2026-03-22$39,900 Active 654-char remark
Show marketing remark (655 chars)
Take advantage of 2 full months of FREE lot rent -- a huge savings for the next owner right from day one. Well-maintained 3-bedroom, 2-bath mobile home located in the desirable Alpine Village community. This home features a functional layout with a spacious living area, private primary suite, and two additional bedrooms perfect for family, guests, or office space. Located in a clean, quiet park with professional management, this home offers affordable, low-maintenance living in a welcoming neighborhood setting. Owner must relocate for work, creating a motivated opportunity for buyers looking for value, space, and comfort in a well-kept community.
-
2026-03-22$39,900 Active 655-char remark
Show marketing remark (655 chars)
Take advantage of 2 full months of FREE lot rent -- a huge savings for the next owner right from day one. Well-maintained 3-bedroom, 2-bath mobile home located in the desirable Alpine Village community. This home features a functional layout with a spacious living area, private primary suite, and two additional bedrooms perfect for family, guests, or office space. Located in a clean, quiet park with professional management, this home offers affordable, low-maintenance living in a welcoming neighborhood setting. Owner must relocate for work, creating a motivated opportunity for buyers looking for value, space, and comfort in a well-kept community.
-
2026-03-22$39,900 Active
Show marketing remark (655 chars)
Take advantage of 2 full months of FREE lot rent -- a huge savings for the next owner right from day one. Well-maintained 3-bedroom, 2-bath mobile home located in the desirable Alpine Village community. This home features a functional layout with a spacious living area, private primary suite, and two additional bedrooms perfect for family, guests, or office space. Located in a clean, quiet park with professional management, this home offers affordable, low-maintenance living in a welcoming neighborhood setting. Owner must relocate for work, creating a motivated opportunity for buyers looking for value, space, and comfort in a well-kept community.
ⓘ Source: listings_history table (triggers on properties + properties_extension) + one-shot
backfill from property_details.listing_events for pre-trigger history.
Nearby sold comps map
Loading sold comps map…
Walkable amenities ~0.75 mi
Loading nearby amenities…
Taxation est. · year 1
- Rental income
- $21,479
- − Mortgage interest
- −$2,235
- − Property taxes
- −$598
- − Insurance
- −$200
- − Repairs & maintenance
- −$1,718
- − Management
- −$1,718
- − Depreciation
- −$1,161
- Taxable income
- $13,848
- Est. tax owed @ 24.0%
- −$3,324
- After-tax cash flow
- $10,336/yr
For passive investors: Depreciation is non-cash, so a rental often shows a tax loss while cash-flowing — sheltering income. Rental losses are passive: they offset passive income freely, and up to $25,000/yr can offset ordinary (W-2) income if you actively participate and your MAGI is under $100k (phasing out to $0 by $150k); unused losses carry forward. On sale, claimed depreciation is recaptured at up to 25%, and gains may owe capital-gains tax (a 1031 exchange can defer both). Figures are a year-1 estimate at your 24.0% rate — not tax advice; consult a CPA.
Schools (NCES district)
- District
- Midland Public Schools
- NCES district ID
- 2623820
- Math proficiency
- 49% ▼ -6.00%
- Reading proficiency
- 64% ▼ -3.00%
- Median HH income
- $55,844
- Composite
- 48.67/100
- National rank
- #2105
- State rank
- #62 of 540 in MI
Livability — Midland
- Score
- 85/100
- State rank
- #28
- US rank
- #578
Category grades
Schools grade is shown separately in the Schools card above.
Census & demographics
- Census place
- Midland, MI
- County
- Midland County · 66,531 people
- City population
- 66,531
- Metro
- Midland, MI
- Population (ZIP)
- 34,039
- Household income
- $77,847
- Rent vs Own
- Severe rent burden
- 935.0
Population outlook (Midland County) Hauer SSP2
- Today (2025)
- 83,968 people
- By 2030
- 83,368 · -0.7%
- By 2040
- 80,713 · -3.9%
- By 2050
- 76,698 · -8.7%
- By 2075
- 67,617 · -19.5%
- By 2100
- 57,529 · -31.5%
Race, ethnicity, and origin ACS 2023
- Neighborhood character
- Predominantly White (88%)
- Race & ethnicity
- White 88% Hispanic / Latino 4% Asian 4% Two or more races 3% Black 2%
- Common ancestry
- Romanian 8% Lithuanian 5% Italian 3%
- Foreign-born
- 5% · Canada, China, Vietnam
- Languages at home
- 95% English-only · Other Indo-European 1% Spanish 1% Chinese 1%
Political lean MEDSL · Midland
- 2024 margin
- R (+15.2) · D 41.6% · R 56.8% · Other 1.6%
- 2008→2024 swing
- -11.6pp toward R · 2008: -3.6pp · 2024: -15.2pp
- All cycles
- 2024: R+15.2 2020: R+14.6 2016: R+19.4 2012: R+15.5 2008: R+3.6
Not yet ingested
- Civics
- —
Market trends
- HPI YoY
- ▼ -87.89%
- Current HPI
- 192.0812
- Rent YoY
- ▲ 0.60%
- Metro
- Midland, MI
- State GDP YoY
- ▲ 1.37%
- F500 in state
- 28
Industry mix (Fortune 500 HQ in MI)
| Industry | F500 HQs | Revenue |
|---|---|---|
| Automotive Parts | 3 | $48B |
|
||
| Automotive | 2 | $372B |
|
||
| Chemicals | 1 | $45B |
|
||
| Automotive Retail | 1 | $29B |
|
||
| Healthcare / Medical Devices | 1 | $23B |
|
||
| Automotive Technology | 1 | $20B |
|
||
Price history
+0.0% since first listed3 events — show timeline
- 2026-03-22 Listed $39,900 REALCOMP
- 2026-03-22 Listed $39,900 MiRealSource-MiMLS
- 2026-03-22 Listed $39,900 SW Michigan MLS
Cash-flow waterfall
monthlySold comps — $/sqft
last 12 mo · ≤1 miLoading sold comps…