 Duplex
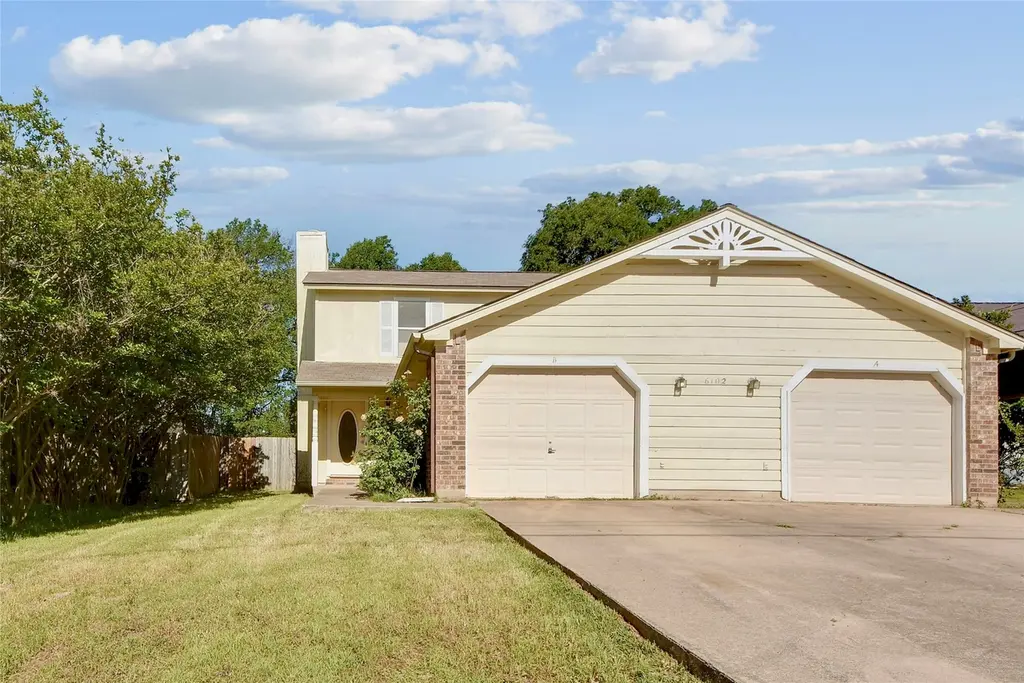
6102 Parkwood Dr · Austin, TX
Flood risk 1/10 · Minimal
- FEMA flood zone
- X (unshaded)
- Chance of flooding over 30 yrs
- 0.0%
- Est. flood insurance / yr
- $507 – $1,088
Fire risk 4/10 · Minor
- Est. fire insurance / yr
- $1,222 – $2,270
Heat risk 8/10 · Major
- Hot days now (above 108°F)
- 7 days/yr
- Hot days in 30 yrs
- 22 days/yr
Wind risk 6/10 · Moderate
- Chance of severe wind over 30 yrs
- 76.0%
Air-quality risk 2/10 · Minimal
- Unhealthy air days now
- 0 days/yr
- Unhealthy air days in 30 yrs
- 1 days/yr
Risk factors via First Street. Map © Google.
Why this score? — see what drove the D grade
The composite is a weighted blend of 9 inputs, each scored 0–100. Each bar is that input's sub-score; the figure is the points it added to the 100-point composite (weight × sub-score).
- ARV discount +12.0/15.0
- Appreciation +10.0/10.0
- Cash flow +6.2/30.0
- Livability +4.1/5.0
- Schools +3.4/10.0
- Condition / age +2.5/5.0
- 1% rule +2.0/10.0
- Rent growth +1.4/5.0
- DSCR +0.5/10.0
$525,000
🖨 Deal sheet (PDF) 📄 Offer letter ✓ Due diligence
Multi-family units
County records classify this as Multi-Family (2-4 Unit). Listing-text estimate: 2 units. confirmed
Listing remarks MLS
Bring your investors! Great opportunity to own a Duplex in the growing Oak Hill area. Unit A & B are mirrored floor plans with 2 bedrooms and 2 full baths upstairs, perfect for roommates & large living with1/2 bath downstairs. Tile and laminate wood flooring throughout, fireplace, garage, washer & dryer hookups and large separated fenced backyard/property line extends beyond back fence and backs to greenspace. Unit A updates include: HVAC (2025), quartz counters, fixtures, newer appliances, blinds and windows. Unit B include HVAC (2023), paint, dishwasher, microwave and new fence.
Key facts
- Large living
- Newer appliances
- Duplex
Tags
Neighborhood map
What this means for you Summary
Snapshot
- This is a 2 × 2-bed/2.5-bath units multifamily listed at $525k.
Deal economics
- At list price, monthly cash flow is $-959 ($-12k/yr) — negative. Per door: $-480/mo.
- To cash-flow at today's rent, offer at most $356k (32.3% below list).
- To meet the 1% rule (rent ≥ 1% of price), the offer needs to be $366k (30.2% below list).
- Recommended offer: $356k (32.3% below list) — sets the bar for cash-flow.
- Cap rate 4.1% vs local median 1.8% in Austin — top-decile yield for the area; either an underpriced asset or a hidden risk that comps aren't pricing in. Stress-test before assuming the spread holds.
Location & tenants
- Location reads 82/100 on livability (#16 in TX, #1,208 nationally) — a professional / high-income tenant draw. Strengths: amenities A+, commute A+, employment A+; Watch: cost of living D, crime F.
- Austin ISD (urban): math 33% / reading 44% proficiency, ranked #431 of 826 in TX (top 52%) — families likely to look elsewhere, expect single-tenant / working-renter base with shorter leases.
- Market conditions: Rents falling (-4.4%/yr); 83 active listings in the ZIP; 13 comparable units currently listed for rent nearby; rentals at typical pace (median 20d on market — plan ~3-4 weeks tenant-placement turnaround); high-income renter base; 17,121 units permitted in Travis County in 2024 (11,963 in 5+ unit buildings).
- This rent runs 32% of the median local income ($139k/yr) — at the standard rent-burdened threshold; future hikes will face affordability resistance.
Forward outlook
- In year one you build about $56k of equity ($4k loan paydown + $52k appreciation (10.0% local appreciation)).
- Travis County population projected at +60% by 2050 — long-run rental-demand tailwind backs the buy-and-hold thesis.
- By year 2, paydown + projected appreciation supports a ~$90k cash-out refi (75% LTV) — recoverable capital for the next deal without selling this one.
Negotiation context
- It's been on market 47 days — a 3% lower offer ($509k) is reasonable based on typical stale-listing flexibility.
- 6 sale attempts since 19y ago with the ask held roughly flat each time — persistent listings suggest the price (not the market) is what's stuck; bring a comps-based counter.
- Current owner paid $64k; list at $525k implies a 714% gain — meaningful room to come down on a strong offer.
Risks & watch-outs
- Climate carrying-cost: major wind risk, 76% chance of damaging wind over 30y; extreme-heat days projected 7→22/yr by 2055 (HVAC capex compounding) — expect insurance premiums to compound above CPI over the hold.
Questions for the listing agent
- What do current leases actually rent for vs. the listed asking? Can we see a recent rent roll and the last 12 months of T-12 income?
- It's been on market 47 days. Have you received any prior offers? Is the seller open to a 32% concession, seller financing, or rate buy-down credit?
- Can we see the unit-by-unit rent roll, current vacancy, and any below-market leases? What's the average tenancy length?
- What capital expenditures (roof, boiler, parking lot, exteriors) have been made in the last 5 years, and what's planned in the next 2?
- Is there a deadline driving the sale (1031 exchange, divorce, estate, relocation)? That informs how much negotiation room exists.
- Crime grade is F in this area — have there been break-ins, vandalism, or insurance claims at this property in the last 3 years? What carrier currently insures it and at what premium?
- The area grade is low — what's the realistic commute time and amenity access for the typical tenant pool here? Any planned neighborhood developments (good or bad) we should know about?
- What's the average days-on-market for RENTAL listings here right now (not sales)? A rising rental-DOM trend means longer vacancies and softer asking-rent achievability than the comps imply.
- What's the recent tenant-quality profile in this submarket — average credit score on applications, eviction rate, late-payment / NSF rate, and stable-employment percentage? A property-management company in the area should have these aggregated.
- How much new apartment / multifamily construction is in the pipeline within 1–3 miles? Heavy new supply (>2% of stock underway) typically softens rents 12–24 months out; light construction supports rent growth.
Investment metrics
- 1% rule
- 0.70% ✗
- Cap rate
- 4.10%
- Cash-on-cash
- -7.83%
- DSCR
- 0.65
- GRM
- 11.9
CMA / ARV
- ARV (median comp)
- $583,566
- List price
- $525,000
- Delta
- -10.04%
- Verdict
- UNDERPRICED
- Comps
- 11 within 1.0 mi
Projected returns pro-forma
10.0% appreciation · 0.0% rent growth · sell at horizon
- IRR
- 18.0%
- Equity multiple
- 2.46×
- Total profit
- $214,278
- Equity at exit
- $472,962
- IRR
- 16.3%
- Equity multiple
- 5.49×
- Total profit
- $660,227
- Equity at exit
- $1,019,960
Cash invested: $147,000 (down + closing). Projections, not guarantees.
Landlord ↔ Tenant lean methodology
- Overall (STATE)
- 87 Strongly Landlord-Friendly
- State Texas
- 87 Strongly Landlord-Friendly · R+5
- County
- — inherits STATE
- City
- — inherits STATE
ZIP-level market 78735
- Home prices YoY
- 26.7%
- Rents YoY
- -4.4%
- Active inventory
- 83
- Price-to-rent
- 23.9×
Monthly cashflow live
- Estimated rent
- $3,664 high interval (Pro) →
- Mortgage (P&I)
- −$2,753
- Tax from tax record
- −$882 /mo · $10,585/yr
- Insurance
- −$219
- HOA
- −$0
- Vacancy / Maint / Mgmt
- −$769
- Net cashflow
- $-959
Break-even live
Sensitivity live
| Price | -10% $-662 | -5% $-811 | +0% $-959 | +5% $-1,108 | +10% $-1,257 |
|---|---|---|---|---|---|
| Rent | -10% $-1,249 | -5% $-1,104 | +0% $-959 | +5% $-815 | +10% $-670 |
| Rate | -1.0pp $-695 | -0.5pp $-826 | base $-959 | +0.5pp $-1,095 | +1.0pp $-1,234 |
2-unit breakdown (identical units grouped — click to expand)
| Units | Beds | Baths | Est. rent |
|---|---|---|---|
| 2× units | 2 | 2.5 | $3,664 |
| #1 | 2 | 2.5 | $1,832 |
| #2 | 2 | 2.5 | $1,832 |
| Total (2 units) | $3,664 | ||
UW: 25.0% down · 7.5% · 30yr · 1.5% tax · 5.0% vac · 8.0% maint · 8.0% mgmt
Financing live
Cash to close
- Down payment
- $131,250
- Closing costs
- $15,750
- Reserves months
- —
- Total cash needed
- —
Loan-product check · same deal, 3 products live
Conventional
25% down · 7.5% · 30yr
- Down + closing
- —
- Monthly P&I
- —
- Monthly cashflow
- —
- DSCR
- —
- Eligible?
- —
Personal DTI + credit; lowest rate.
DSCR
20% down · 8.5% · 30yr
- Down + closing
- —
- Monthly P&I
- —
- Monthly cashflow
- —
- DSCR
- —
- Eligible?
- —
No personal income docs; deal must DSCR.
Hard money
10% down · 12.0% · 12mo
- Down + closing
- —
- Monthly P&I
- —
- Monthly cashflow
- —
- DSCR
- —
- Eligible?
- —
Short-term bridge; refi at stabilization.
Rent comps 13 comps
| Address | Beds | Baths | Sqft | Rent | $/sqft | DOM | Units | Dist |
|---|---|---|---|---|---|---|---|---|
| 6200 School Rd Austin, TX | 3.0 | 1.0–3.5 | 1284 | $3,488 | $2.72 | 0d | 119 | 0.12mi |
| 5711 Vega Ave Unit 711 Austin, TX | 3.0 | 2.0 | 1940 | $2,757 | $1.42 | 14d | 1 | 0.18mi |
| 5711 Vega Ave Unit 5744 Austin, TX | 3.0 | 2.0 | 1940 | $2,757 | $1.42 | 0d | 1 | 0.25mi |
| 6401 Rialto Blvd Austin, TX | 1.0–3.0 | 1.0–2.0 | 1118 | $2,686 | $2.40 | 4d | 20 | 0.68mi |
| 6407 Rialto Blvd Austin, TX | 3.0 | 2.0 | 1576 | $2,567 | $1.63 | 45d | 1 | 0.77mi |
| 7016 Bending Oak Rd Unit a Austin, TX | 3.0 | 2.5 | 2100 | $3,950 | $1.88 | 45d | 1 | 0.99mi |
| 7172 Ridge Oak Rd Austin, TX | 3.0 | 2.0 | 1915 | $3,100 | $1.62 | 19d | 1 | 1.04mi |
| 4901 Wing Rd Austin, TX | 4.0 | 2.0 | 1940 | $2,550 | $1.31 | 45d | 1 | 1.05mi |
| 6703 Hill Oaks Dr Unit A Austin, TX | 3.0 | 2.5 | 2599 | $1,975 | $0.76 | 25d | 1 | 1.06mi |
| 6211 Sunkist Ln Unit 6211 Austin, TX | 4.0 | 2.0 | 1627 | $2,700 | $1.66 | 45d | 1 | 1.08mi |
| 6304 Steep Cactus Trl Austin, TX | 3.0 | 2.5 | 1628 | $2,861 | $1.76 | 6d | 1 | 1.26mi |
| 6121 Oliver Loving Trl Austin, TX | 3.0 | 2.5 | 2460 | $3,500 | $1.42 | 0d | 1 | 1.29mi |
| 7808 Meloncon Cv Austin, TX | 4.0 | 3.5 | 3182 | $3,199 | $1.01 | 45d | 1 | 1.50mi |
Listing history 33 events
-
2026-06-21days on market $525,000 Active 47 DOM
-
2026-06-18days on market $525,000 Active 44 DOM
-
2026-06-17days on market $525,000 Active 43 DOM
-
2026-06-16days on market $525,000 Active 42 DOM
-
2026-06-15days on market $525,000 Active 41 DOM
-
2026-06-13days on market $525,000 Active 39 DOM
-
2026-06-09days on market $525,000 Active 35 DOM
-
2026-06-08days on market $525,000 Active 34 DOM
-
2026-06-07days on market $525,000 Active 33 DOM
-
2026-06-05days on market $525,000 Active 30 DOM
-
2026-06-03days on market $525,000 Active 29 DOM
-
2026-06-02days on market $525,000 Active 28 DOM
-
2026-06-01days on market $525,000 Active 27 DOM
-
2026-05-31days on market $525,000 Active 26 DOM
-
2026-05-05price $540,000 605-char remark
Show marketing remark (605 chars)
Bring your investors! Great opportunity to own a Duplex in the growing Oak Hill area. Unit A & B are mirrored floor plans with 2 bedrooms and 2 full baths upstairs, perfect for roommates & large living with1/2 bath downstairs. Tile and laminate wood flooring throughout, fireplace, garage, washer & dryer hookups and large separated fenced backyard/property line extends beyond back fence and backs to greenspace. Unit A updates include: HVAC (2025), quartz counters, fixtures, newer appliances, blinds and windows. Unit B include HVAC (2023), paint, dishwasher, microwave and new fence.
-
2026-02-23$550,000 Active 605-char remark
Show marketing remark (605 chars)
Bring your investors! Great opportunity to own a Duplex in the growing Oak Hill area. Unit A & B are mirrored floor plans with 2 bedrooms and 2 full baths upstairs, perfect for roommates & large living with1/2 bath downstairs. Tile and laminate wood flooring throughout, fireplace, garage, washer & dryer hookups and large separated fenced backyard/property line extends beyond back fence and backs to greenspace. Unit A updates include: HVAC (2025), quartz counters, fixtures, newer appliances, blinds and windows. Unit B include HVAC (2023), paint, dishwasher, microwave and new fence.
-
2025-06-29historical $1,250
-
2025-06-16price
-
2025-05-13$1,250
-
2025-04-15Active
-
2021-02-09soldstatus
-
2021-02-05soldstatus Closed
-
2021-01-21status Pending
-
2021-01-09historical Active Under Contract
-
2021-01-06status Active
-
2021-01-03historical Active Under Contract
-
2021-01-01$459,900 Active
-
2012-04-26soldstatus
-
2007-07-06soldstatus
-
2007-05-22historical
-
2007-04-12$219,900
-
1990-11-02soldstatus $64,500
-
1985-10-09soldstatus
ⓘ Source: listings_history table (triggers on properties + properties_extension) + one-shot
backfill from property_details.listing_events for pre-trigger history.
Tax reassessment forecast TX · Resets to sale price
- Current annual tax
- $10,585 · $882/mo
- Projected year-2 tax
- $10,585 · $882/mo
- Expected delta
- $0/yr ($0/mo · 0.0%)
ⓘ Screening estimate from a state-policy table — verify with the county assessor before closing.
Climate risk First Street
- Flood 1/10 Low FEMA zone X (unshaded) · 0% chance over 30 yrs
- Wildfire 4/10 Moderate
- Heat 8/10 Severe 7 d/yr ≥108°F today · 22 d/yr by 30 yrs out
- Wind 6/10 Major 76% chance of damaging wind over 30 yrs
- Air quality 2/10 Low 0 unhealthy d/yr today · 1 by 30 yrs out
Nearby sold comps map
Loading sold comps map…
Walkable amenities ~0.75 mi
Loading nearby amenities…
Taxation est. · year 1
- Rental income
- $43,968
- − Mortgage interest
- −$29,408
- − Property taxes
- −$10,585
- − Insurance
- −$2,625
- − Repairs & maintenance
- −$3,517
- − Management
- −$3,517
- − Depreciation
- −$15,273
- Taxable loss
- −$20,958
- Est. tax savings @ 24.0%
- +$5,030
- After-tax cash flow
- $-6,483/yr
For passive investors: Depreciation is non-cash, so a rental often shows a tax loss while cash-flowing — sheltering income. Rental losses are passive: they offset passive income freely, and up to $25,000/yr can offset ordinary (W-2) income if you actively participate and your MAGI is under $100k (phasing out to $0 by $150k); unused losses carry forward. On sale, claimed depreciation is recaptured at up to 25%, and gains may owe capital-gains tax (a 1031 exchange can defer both). Figures are a year-1 estimate at your 24.0% rate — not tax advice; consult a CPA.
Schools (NCES district)
- District
- Austin ISD
- NCES district ID
- 4808940
- Math proficiency
- 33% ▼ -19.00%
- Reading proficiency
- 44% ▼ -7.00%
- Median HH income
- $54,627
- Composite
- 33.65/100
- National rank
- #5397
- State rank
- #431 of 826 in TX
Livability — Austin
- Score
- 82/100
- State rank
- #16
- US rank
- #1208
Category grades
Schools grade is shown separately in the Schools card above.
Census & demographics
- Census place
- Austin, TX
- County
- Travis County · 1,299,254 people
- City population
- 1,066,854
- Metro
- Austin-Round Rock-Georgetown, TX
- Population (ZIP)
- 20,996
- Household income
- $139,191
- Rent vs Own
- Severe rent burden
- 884.0
Population outlook (Travis County) Hauer SSP2
- Today (2025)
- 1,545,133 people
- By 2030
- 1,729,269 · +11.9%
- By 2040
- 2,097,596 · +35.8%
- By 2050
- 2,463,890 · +59.5%
- By 2075
- 3,249,374 · +110.3%
- By 2100
- 3,801,868 · +146.1%
Race, ethnicity, and origin ACS 2023
- Neighborhood character
- Predominantly White (66%)
- Race & ethnicity
- White 66% Hispanic / Latino 18% Two or more races 11% Asian 8% Black 2%
- Hispanic origin (detail)
- Mexican 12%
- Common ancestry
- Italian 6% Lithuanian 4% Slovak 2%
- Foreign-born
- 15% · Canada, China, South Korea
- Languages at home
- 80% English-only · Spanish 13% Other Asian/Pacific 2% Other Indo-European 2%
Political lean MEDSL · Travis
- 2024 margin
- Solid D (+39.3) · D 68.8% · R 29.4% · Other 1.8%
- 2008→2024 swing
- +9.9pp toward D · 2008: 29.4pp · 2024: 39.3pp
- All cycles
- 2024: D+39.3 2020: D+45.0 2016: D+38.9 2012: D+23.9 2008: D+29.4
Not yet ingested
- Civics
- —
Market trends
- HPI YoY
- ▲ 113.90%
- Current HPI
- 540.22
- Rent YoY
- ▼ -4.41%
- Metro
- Austin-Round Rock-Georgetown, TX
- State GDP YoY
- ▲ 3.95%
- F500 in state
- 110
Industry mix (Fortune 500 HQ in TX)
| Industry | F500 HQs | Revenue |
|---|---|---|
| Energy | 16 | $1,198B |
|
||
| Technology | 5 | $198B |
|
||
| Engineering / Construction | 4 | $72B |
|
||
| Energy Services | 3 | $60B |
|
||
| Utilities | 3 | $41B |
|
||
| Healthcare | 2 | $330B |
|
||
Price history
+737.2% since first listed19 events — show timeline
- 2026-05-05 Price Changed $540,000 Unlock MLS
- 2026-02-23 Listed $550,000 Unlock MLS
- 2025-06-29 Rental Removed $1,250 SHOWMOJO
- 2025-06-16 Price Changed — Unlock MLS
- 2025-05-13 Listed for Rent $1,250 SHOWMOJO
- 2025-04-15 Listed — Unlock MLS
- 2021-02-09 Sold (Public Records) — Public Records
- 2021-02-05 Sold (MLS) — Unlock MLS
- 2021-01-21 Pending — Unlock MLS
- 2021-01-09 Contingent — Unlock MLS
- 2021-01-06 Relisted — Unlock MLS
- 2021-01-03 Contingent — Unlock MLS
- 2021-01-01 Listed $459,900 Unlock MLS
- 2012-04-26 Sold (Public Records) — Public Records
- 2007-07-06 Sold (MLS) — Unlock MLS
- 2007-05-22 Delisted — Unlock MLS
- 2007-04-12 Listed $219,900 Unlock MLS
- 1990-11-02 Sold (Public Records) $64,500 Public Records
- 1985-10-09 Sold (Public Records) — Public Records
Property tax history
+5.2%/yrLatest (2026): $10,585 · -6.5% YoY. Source: county tax records.
Cash-flow waterfall
monthlySold comps — $/sqft
last 12 mo · ≤1 miLoading sold comps…