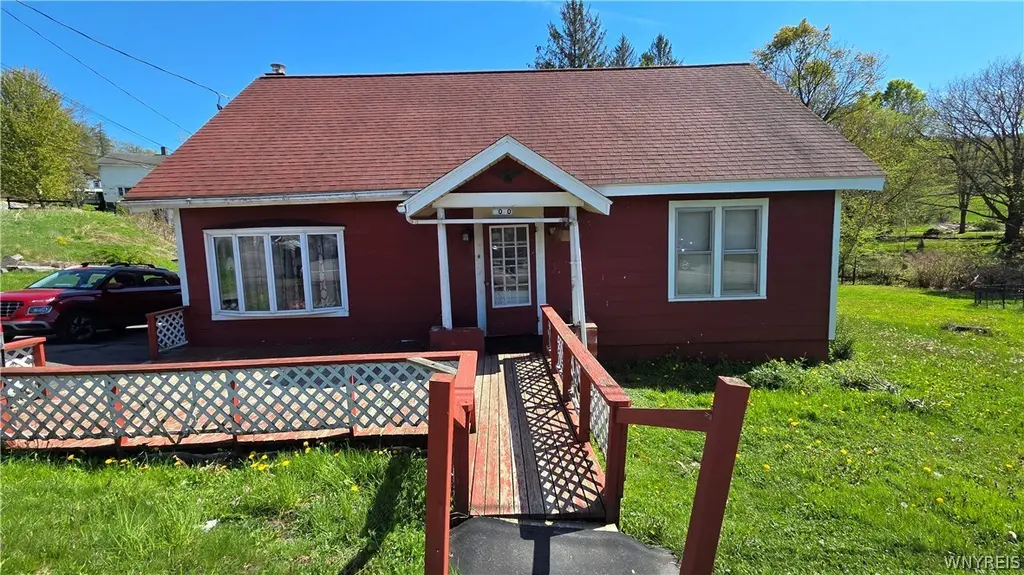
2070 State Highway 206 · Sidney, NY
Flood risk 9/10 · Severe
- FEMA flood zone
- X (unshaded)
- Chance of flooding over 30 yrs
- 0.99%
- Est. flood insurance / yr
- $473 – $860
Fire risk 3/10 · Minor
- Est. fire insurance / yr
- $691 – $1,283
Heat risk 2/10 · Minimal
- Hot days now (above 90°F)
- 7 days/yr
- Hot days in 30 yrs
- 18 days/yr
Wind risk 2/10 · Minimal
- Chance of severe wind over 30 yrs
- 1.0%
Air-quality risk 2/10 · Minimal
- Unhealthy air days now
- 0 days/yr
- Unhealthy air days in 30 yrs
- 1 days/yr
Risk factors via First Street. Map © Google.
Why this score? — see what drove the B+ grade
The composite is a weighted blend of 9 inputs, each scored 0–100. Each bar is that input's sub-score; the figure is the points it added to the 100-point composite (weight × sub-score).
- Cash flow +30.0/30.0
- 1% rule +10.0/10.0
- DSCR +10.0/10.0
- Appreciation +8.9/10.0
- ARV discount +7.5/15.0
- Schools +3.8/10.0
- Livability +3.5/5.0
- Rent growth +2.5/5.0
- Condition / age +2.5/5.0
$73,000
🖨 Deal sheet (PDF) 📄 Offer letter ✓ Due diligence
Listing remarks MLS
Endless potential at an AMAZING PRICE! Conveniently located just minutes from Sidney and easy access to I-88, outside features include a good-sized yard, attached garage w/ workshop space, and a front porch. Inside you will find 4 good-sized bedrooms, a full bath, kitchen w/ natural light, laundry room, formal dining room and living room. NEW ROOF (2013), NEW FURNACE (2010), NEW HOT WATER HEATER (2010), & NEW ELECTRIC PANEL (2010)! With a GREAT LAYOUT and major work done, just bring your updates and the possibilities are endless.
Key facts
- Peaceful location
- Functional layout
- 0.4 acre lot
Tags
Property features AI
Exterior
- Parking: Detached garage; Two-car garage
- Utilities: Well water; Septic tank
- Home design: Single-story (1 story); Resale property
- Construction: Frame construction with wood siding; Shingle roof; Existing (previously built)
- Exterior features: Blacktop driveway; Rectangular residential lot; Road frontage on city street / main thoroughfare; Lot dimensions approximately 140 x 115
Interior
- Kitchen: Water heater listed with appliances (see remarks)
- Bedrooms: Four main-level bedrooms
- Flooring: Carpet; Hardwood; Varied flooring
- Bathrooms: One full bathroom (main level)
- Heating & cooling: Baseboard heating; Heating present (see remarks)
- Interior features: Eat-in kitchen; Main level primary bedroom; Partial basement
Neighborhood map
What this means for you Summary
Snapshot
- This is a 3-bed/1.0-bath single-family listed at $73k.
Deal economics
- At list price, monthly cash flow is $521 ($6k/yr) — positive.
- The deal already cash-flows at list — no discount required.
- Meets the 1% rule at list price ($1k rent vs $73k).
- Recommended offer: $72k (1.5% below list) — sets the bar for market timing.
Location & tenants
- Location reads 69/100 on livability (#476 in NY) — a middle-class / working-renter tenant base. Strengths: cost of living A+, health & safety A+, housing A; Watch: employment D, amenities F, commute F.
- Sidney Central School District (town): math 44% / reading 47% proficiency, ranked #462 of 590 in NY (top 78%) — families likely to look elsewhere, expect single-tenant / working-renter base with shorter leases.
- Zoned schools: Sidney Elementary School (math 41% / reading 50%, grade D-, #1,271 of 2,108 statewide, top 60%, 527 students, 52% FRL); Sidney Middle School (math 32% / reading 42%, grade F, #448 of 729 statewide, top 63%, 171 students, 53% FRL); Sidney High School (math 92% / reading 75%, grade A, #409 of 1,100 statewide, top 39%, 336 students, 48% FRL).
- Market conditions: 7 active listings in the ZIP; 66 units permitted in Delaware County in 2024 (0 in 5+ unit buildings).
Forward outlook
- In year one you build about $6k of equity ($505 loan paydown + $6k appreciation (7.9% local appreciation)).
- Delaware County population projected at -27% by 2050 — secular population decline; favor cash flow + early exit over multi-decade hold.
- At projected returns (7.9% appreciation + 3.0% rent growth), your $20k cash investment doubles in ~2 years — after that, you're playing with house money.
- By year 6, paydown + projected appreciation supports a ~$35k cash-out refi (75% LTV) — recoverable capital for the next deal without selling this one.
Negotiation context
- It's been on market 19 days — a 2% lower offer ($72k) is reasonable based on typical stale-listing flexibility.
- 5 sale attempts since 10y ago; this cycle's ask has dropped $6k (8%) from the opening price — seller is motivated, your offer sets the floor, not the list.
- Current owner paid $50k; 46% above their basis — modest negotiation headroom, anchor on the comps not their cost.
Risks & watch-outs
- Watch-outs: property tax is 2.7% of price; flood insurance adds $56/mo; built in 1948 — expect roof / HVAC / electrical / plumbing capex.
- Climate carrying-cost: severe flood risk — expect insurance premiums to compound above CPI over the hold.
Questions for the listing agent
- Built in 1948 — when were the roof, HVAC, electrical panel, plumbing, and water heater last replaced?
- Property tax is high relative to price — has the assessment been appealed recently, and will the sale trigger a re-assessment?
- What's the actual annual flood-insurance premium (NFIP or private), and is the property in a SFHA with mandatory coverage?
- Is there a deadline driving the sale (1031 exchange, divorce, estate, relocation)? That informs how much negotiation room exists.
- Schools are D-rated, which usually means shorter tenancies and higher turnover. Who's the typical renter profile here, and what's been the actual vacancy rate?
- What's the average days-on-market for RENTAL listings here right now (not sales)? A rising rental-DOM trend means longer vacancies and softer asking-rent achievability than the comps imply.
- What's the recent tenant-quality profile in this submarket — average credit score on applications, eviction rate, late-payment / NSF rate, and stable-employment percentage? A property-management company in the area should have these aggregated.
- How much new for-sale + rental construction is in the pipeline within 1–3 miles? Heavy new supply typically softens prices + rents 12–24 months out; constrained supply supports both.
Investment metrics
- 1% rule
- 2.01% ✓
- Cap rate
- 15.78%
- Cash-on-cash
- 33.87%
- DSCR
- 2.51
- GRM
- 4.2
CMA / ARV
No comps found within radius.
Projected returns pro-forma
7.86% appreciation · 3.0% rent growth · sell at horizon
- IRR
- 44.3%
- Equity multiple
- 4.07×
- Total profit
- $62,722
- Equity at exit
- $54,764
- IRR
- 39.9%
- Equity multiple
- 8.71×
- Total profit
- $157,502
- Equity at exit
- $108,047
Cash invested: $20,440 (down + closing). Projections, not guarantees.
Landlord ↔ Tenant lean methodology
- Overall (STATE)
- 15 Strongly Tenant-Friendly
- State New York
- 15 Strongly Tenant-Friendly · D+10
- County
- — inherits STATE
- City
- — inherits STATE
ZIP-level market 13804
- Home prices YoY
- 2.4%
- Active inventory
- 7
- Price-to-rent
- 4.2×
Monthly cashflow live
- Estimated rent
- $1,464 medium interval (Pro) →
- Mortgage (P&I)
- −$383
- Tax from tax record
- −$166 /mo · $1,996/yr
- Insurance
- −$30
- Flood insurance flood zone
- −$56 /mo · $666/yr
- HOA
- −$0
- Vacancy / Maint / Mgmt
- −$307
- Net cashflow
- $521
Break-even live
Sensitivity live
| Price | -10% $563 | -5% $542 | +0% $521 | +5% $501 | +10% $480 |
|---|---|---|---|---|---|
| Rent | -10% $406 | -5% $463 | +0% $521 | +5% $579 | +10% $637 |
| Rate | -1.0pp $558 | -0.5pp $540 | base $521 | +0.5pp $502 | +1.0pp $483 |
UW: 25.0% down · 7.5% · 30yr · 1.5% tax · 5.0% vac · 8.0% maint · 8.0% mgmt
Financing live
Cash to close
- Down payment
- $18,250
- Closing costs
- $2,190
- Reserves months
- —
- Total cash needed
- —
Loan-product check · same deal, 3 products live
Conventional
25% down · 7.5% · 30yr
- Down + closing
- —
- Monthly P&I
- —
- Monthly cashflow
- —
- DSCR
- —
- Eligible?
- —
Personal DTI + credit; lowest rate.
DSCR
20% down · 8.5% · 30yr
- Down + closing
- —
- Monthly P&I
- —
- Monthly cashflow
- —
- DSCR
- —
- Eligible?
- —
No personal income docs; deal must DSCR.
Hard money
10% down · 12.0% · 12mo
- Down + closing
- —
- Monthly P&I
- —
- Monthly cashflow
- —
- DSCR
- —
- Eligible?
- —
Short-term bridge; refi at stabilization.
Listing history 14 events
-
2026-06-21days on market $73,000 Active 19 DOM
-
2026-06-21days on market $73,000 Active 18 DOM
-
2026-06-18days on market $73,000 Active 16 DOM
-
2026-06-17days on market $73,000 Active 15 DOM
-
2026-06-16days on market $73,000 Active 14 DOM
-
2026-06-15pricedays on market $73,000 Active 13 DOM
-
2026-06-13days on market $79,000 Active 11 DOM
-
2026-06-12days on market $79,000 Active 10 DOM
-
2026-06-09days on market $79,000 Active 7 DOM
-
2026-06-08days on market $79,000 Active 6 DOM
-
2026-06-07days on market $79,000 Active 5 DOM
-
2026-06-07days on market $79,000 Active 4 DOM
-
2026-06-03remarks 367-char remark
-
2026-06-03$79,000 Active 1 DOM
ⓘ Source: listings_history table (triggers on properties + properties_extension) + one-shot
backfill from property_details.listing_events for pre-trigger history.
Tax reassessment forecast NY · Partial reset (capped growth)
- Current annual tax
- $1,996 · $166/mo
- Projected year-2 tax
- $1,996 · $166/mo
- Expected delta
- $0/yr ($0/mo · 0.0%)
ⓘ Screening estimate from a state-policy table — verify with the county assessor before closing.
Climate risk First Street
- Flood 9/10 Extreme FEMA zone X (unshaded) · 99% chance over 30 yrs
- Wildfire 3/10 Moderate
- Heat 2/10 Low 7 d/yr ≥90°F today · 18 d/yr by 30 yrs out
- Wind 2/10 Low 100% chance of damaging wind over 30 yrs
- Air quality 2/10 Low 0 unhealthy d/yr today · 1 by 30 yrs out
Nearby sold comps map
Loading sold comps map…
Walkable amenities ~0.75 mi
Loading nearby amenities…
Taxation est. · year 1
- Rental income
- $17,565
- − Mortgage interest
- −$4,089
- − Property taxes
- −$1,996
- − Insurance
- −$1,032
- − Repairs & maintenance
- −$1,405
- − Management
- −$1,405
- − Depreciation
- −$2,124
- Taxable income
- $5,515
- Est. tax owed @ 24.0%
- −$1,324
- After-tax cash flow
- $4,932/yr
For passive investors: Depreciation is non-cash, so a rental often shows a tax loss while cash-flowing — sheltering income. Rental losses are passive: they offset passive income freely, and up to $25,000/yr can offset ordinary (W-2) income if you actively participate and your MAGI is under $100k (phasing out to $0 by $150k); unused losses carry forward. On sale, claimed depreciation is recaptured at up to 25%, and gains may owe capital-gains tax (a 1031 exchange can defer both). Figures are a year-1 estimate at your 24.0% rate — not tax advice; consult a CPA.
Schools (NCES district)
- District
- Sidney Central School District
- NCES district ID
- 3626850
- Math proficiency
- 44% ▼ -2.00%
- Reading proficiency
- 47% ▲ 5.00%
- Median HH income
- $42,110
- Composite
- 38.29/100
- National rank
- #4232
- State rank
- #462 of 590 in NY
Livability — Sidney
- Score
- 69/100
- State rank
- #476
- US rank
- #8397
Category grades
Schools grade is shown separately in the Schools card above.
Census & demographics
- Population (ZIP)
- 266
Population outlook (Delaware County) Hauer SSP2
- Today (2025)
- 42,668 people
- By 2030
- 40,337 · -5.5%
- By 2040
- 35,514 · -16.8%
- By 2050
- 31,265 · -26.7%
- By 2075
- 24,455 · -42.7%
- By 2100
- 19,529 · -54.2%
Race, ethnicity, and origin ACS 2023
- Neighborhood character
- Predominantly White (100%)
- Race & ethnicity
- White 100%
- Common ancestry
- Portuguese 2% Romanian 1% Slovak 1%
Political lean MEDSL · Delaware
- 2024 margin
- R (+19.8) · D 40.1% · R 59.9%
- 2008→2024 swing
- -14.6pp toward R · 2008: -5.2pp · 2024: -19.8pp
- All cycles
- 2024: R+19.8 2020: R+18.4 2016: R+29.2 2012: R+9.6 2008: R+5.2
Not yet ingested
- Civics
- —
Market trends
- HPI YoY
- ▲ 7.86%
- Current HPI
- 335.3024
- Rent YoY
- —
- Metro
- —
- State GDP YoY
- ▲ 2.60%
- F500 in state
- 92
Industry mix (Fortune 500 HQ in NY)
| Industry | F500 HQs | Revenue |
|---|---|---|
| Financial Services | 10 | $950B |
|
||
| Consumer Goods | 9 | $162B |
|
||
| Insurance | 4 | $225B |
|
||
| Telecommunications | 2 | $144B |
|
||
| Pharmaceuticals | 2 | $112B |
|
||
| Media / Entertainment | 2 | $69B |
|
||
Price history
+13.7% since first listed7 events — show timeline
- 2026-06-02 Listed $79,000 WNYREIS
- 2018-07-05 Sold (Public Records) $50,000 Public Records
- 2018-07-03 Sold (MLS) $50,000 UNYREIS
- 2018-04-18 Listed $64,500 UNYREIS
- 2017-12-27 Listed $64,500 UNYREIS
- 2017-04-10 Listed $64,500 UNYREIS
- 2016-05-19 Listed $69,500 UNYREIS
Property tax history
+8.6%/yrLatest (2025): $1,996 · +0.2% YoY. Source: county tax records.
Cash-flow waterfall
monthlySold comps — $/sqft
last 12 mo · ≤1 miLoading sold comps…