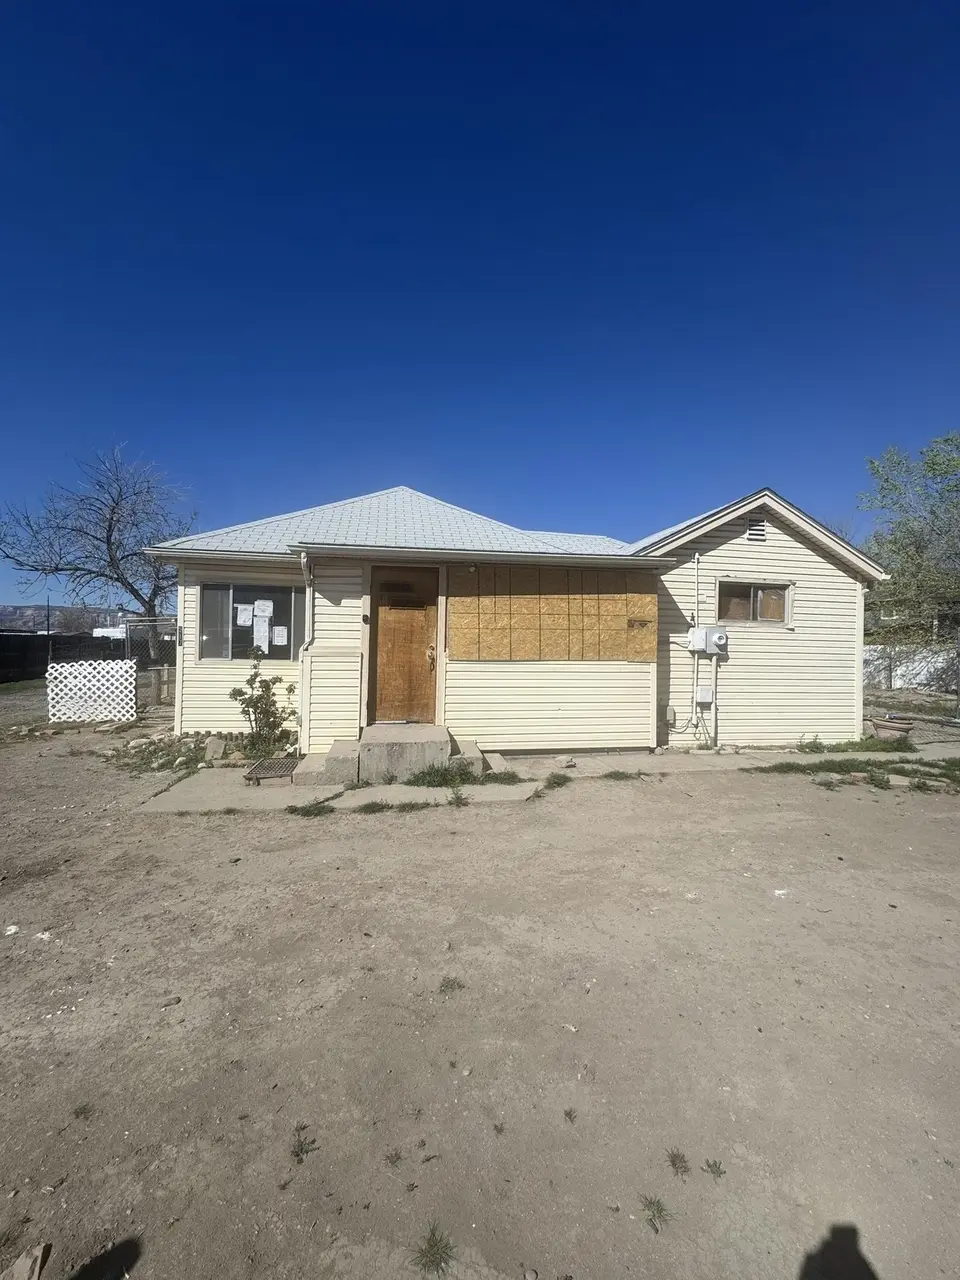
517 28 1/4 Rd · Grand Junction, CO
Flood risk 1/10 · Minimal
- FEMA flood zone
- X (unshaded)
- Chance of flooding over 30 yrs
- 0.0%
- Est. flood insurance / yr
- $507 – $1,088
Fire risk 1/10 · Minimal
- Est. fire insurance / yr
- $939 – $1,743
Heat risk 5/10 · Moderate
- Hot days now (above 96°F)
- 7 days/yr
- Hot days in 30 yrs
- 19 days/yr
Wind risk 1/10 · Minimal
- Chance of severe wind over 30 yrs
- —
Air-quality risk 2/10 · Minimal
- Unhealthy air days now
- 1 days/yr
- Unhealthy air days in 30 yrs
- 1 days/yr
Risk factors via First Street. Map © Google.
Why this score? — see what drove the F grade
The composite is a weighted blend of 9 inputs, each scored 0–100. Each bar is that input's sub-score; the figure is the points it added to the 100-point composite (weight × sub-score).
- ARV discount +7.5/15.0
- Cash flow +6.1/30.0
- Rent growth +4.2/5.0
- Livability +4.0/5.0
- Schools +2.8/10.0
- Condition / age +2.5/5.0
- 1% rule +1.0/10.0
- DSCR +0.5/10.0
- Appreciation +0.0/10.0
$199,000
🖨 Deal sheet (PDF) 📄 Offer letter ✓ Due diligence
Listing remarks
This . 61-acre RM-8 zoned property offers a rare opportunity in a prime Grand Junction location. The main home, originally built in 1915, features 1,016 sq ft of living space and classic character that adds to the property’s overall appeal. A second home on the property provides additional flexibility, creating multiple avenues for future use. With its generous lot size, versatile zoning, and strong location, this property presents an excellent opportunity to create value in a variety of ways.
Key facts
- Versatile zoning
- Rm-8 zoned
- Generous lot size
Tags
Property features AI
Exterior
- Parking: RV access/parking
- Utilities: Public water; Sewer connected
- Home design: Single-family residence; Residential property; East-facing; Single-story
- Construction: Vinyl siding; Asphalt/composition roof; Crawl space foundation; Built with standard residential construction
- Exterior features: Covered patio/porch; Deck; Chain link and privacy fencing; Water-smart landscaping; Outbuilding and shed
Interior
- Flooring: Carpet; Hardwood
- Heating & cooling: Forced air heating; Ceiling fans (cooling); Evaporative cooling
- Interior features: Ceiling fans
Neighborhood map
What this means for you Summary
Snapshot
- This is a 1-bed/1.0-bath single-family listed at $199k.
Deal economics
- At list price, monthly cash flow is $-370 ($-4k/yr) — negative.
- To cash-flow at today's rent, offer at most $134k (32.9% below list).
- To meet the 1% rule (rent ≥ 1% of price), the offer needs to be $119k (40.4% below list).
- Recommended offer: $119k (40.4% below list) — sets the bar for 1% rule.
- Cap rate 4.1% vs local median 3.1% in Grand Junction — top-decile yield for the area; either an underpriced asset or a hidden risk that comps aren't pricing in. Stress-test before assuming the spread holds.
Location & tenants
- Location reads 79/100 on livability (#15 in CO, #2,222 nationally) — a middle-class / working-renter tenant base. Strengths: commute A+, health & safety A+, housing A; Watch: employment D+, crime F.
- Mesa County Valley School District No. 51 (suburban): math 26% / reading 38% proficiency, ranked #43 of 86 in CO (top 50%) — families likely to look elsewhere, expect single-tenant / working-renter base with shorter leases.
- Zoned schools: Orchard Avenue Elementary School (math 15% / reading 52%, grade F, #454 of 966 statewide, top 47%, 337 students, 54% FRL); Bookcliff Middle School (math 18% / reading 26%, grade F, #188 of 270 statewide, top 72%, 449 students, 59% FRL); Central High School (math 19% / reading 43%, grade F, #229 of 381 statewide, top 60%, 1,613 students, 45% FRL).
- Market conditions: Rents rising fast (+6.9%/yr); 166 active listings in the ZIP; 17 comparable units currently listed for rent nearby; rentals at typical pace (median 15d on market — plan ~3-4 weeks tenant-placement turnaround); 1,014 units permitted in Mesa County in 2024 (240 in 5+ unit buildings).
Forward outlook
- Local home prices are declining (-3.0%/yr); year-one equity from $1k of loan paydown is wiped out by about $6k of value loss. Plan a longer hold.
Negotiation context
- It's been on market 56 days — a 3% lower offer ($193k) is reasonable based on typical stale-listing flexibility.
- 2 sale attempts; this cycle's ask has dropped $36k (15%) from the opening price — seller is motivated, your offer sets the floor, not the list.
Risks & watch-outs
- Watch-outs: built in 1915 — expect roof / HVAC / electrical / plumbing capex.
- Climate carrying-cost: extreme-heat days projected 7→19/yr by 2055 (HVAC capex compounding) — expect insurance premiums to compound above CPI over the hold.
Questions for the listing agent
- What do current leases actually rent for vs. the listed asking? Can we see a recent rent roll and the last 12 months of T-12 income?
- It's been on market 56 days. Have you received any prior offers? Is the seller open to a 40% concession, seller financing, or rate buy-down credit?
- Built in 1915 — when were the roof, HVAC, electrical panel, plumbing, and water heater last replaced?
- Is there a deadline driving the sale (1031 exchange, divorce, estate, relocation)? That informs how much negotiation room exists.
- Schools are D-rated, which usually means shorter tenancies and higher turnover. Who's the typical renter profile here, and what's been the actual vacancy rate?
- Crime grade is F in this area — have there been break-ins, vandalism, or insurance claims at this property in the last 3 years? What carrier currently insures it and at what premium?
- The area grade is low — what's the realistic commute time and amenity access for the typical tenant pool here? Any planned neighborhood developments (good or bad) we should know about?
- What's the average days-on-market for RENTAL listings here right now (not sales)? A rising rental-DOM trend means longer vacancies and softer asking-rent achievability than the comps imply.
- What's the recent tenant-quality profile in this submarket — average credit score on applications, eviction rate, late-payment / NSF rate, and stable-employment percentage? A property-management company in the area should have these aggregated.
- How much new for-sale + rental construction is in the pipeline within 1–3 miles? Heavy new supply typically softens prices + rents 12–24 months out; constrained supply supports both.
Investment metrics
- 1% rule
- 0.60% ✗
- Cap rate
- 4.06%
- Cash-on-cash
- -7.97%
- DSCR
- 0.65
- GRM
- 14.0
CMA / ARV
No comps found within radius.
Projected returns pro-forma
-3.0% appreciation · 6.92% rent growth · sell at horizon
- IRR
- -26.4%
- Equity multiple
- 0.09×
- Total profit
- $-50,982
- Equity at exit
- $29,672
- IRR
- -14.5%
- Equity multiple
- 0.05×
- Total profit
- $-53,202
- Equity at exit
- $17,206
Cash invested: $55,720 (down + closing). Projections, not guarantees.
Landlord ↔ Tenant lean methodology
- Overall (STATE)
- 38 Tenant-Leaning
- State Colorado
- 38 Tenant-Leaning · D+4
- County
- — inherits STATE
- City
- — inherits STATE
ZIP-level market 81501
- Rents YoY
- 6.9%
- Active inventory
- 166
- Price-to-rent
- 14.0×
Monthly cashflow live
- Estimated rent
- $1,187 high interval (Pro) →
- Mortgage (P&I)
- −$1,044
- Tax from tax record
- −$181 /mo · $2,175/yr
- Insurance
- −$83
- HOA
- −$0
- Vacancy / Maint / Mgmt
- −$249
- Net cashflow
- $-370
Break-even live
Sensitivity live
| Price | -10% $-258 | -5% $-314 | +0% $-370 | +5% $-427 | +10% $-483 |
|---|---|---|---|---|---|
| Rent | -10% $-464 | -5% $-417 | +0% $-370 | +5% $-323 | +10% $-276 |
| Rate | -1.0pp $-270 | -0.5pp $-320 | base $-370 | +0.5pp $-422 | +1.0pp $-474 |
UW: 25.0% down · 7.5% · 30yr · 1.5% tax · 5.0% vac · 8.0% maint · 8.0% mgmt
Financing live
Cash to close
- Down payment
- $49,750
- Closing costs
- $5,970
- Reserves months
- —
- Total cash needed
- —
Loan-product check · same deal, 3 products live
Conventional
25% down · 7.5% · 30yr
- Down + closing
- —
- Monthly P&I
- —
- Monthly cashflow
- —
- DSCR
- —
- Eligible?
- —
Personal DTI + credit; lowest rate.
DSCR
20% down · 8.5% · 30yr
- Down + closing
- —
- Monthly P&I
- —
- Monthly cashflow
- —
- DSCR
- —
- Eligible?
- —
No personal income docs; deal must DSCR.
Hard money
10% down · 12.0% · 12mo
- Down + closing
- —
- Monthly P&I
- —
- Monthly cashflow
- —
- DSCR
- —
- Eligible?
- —
Short-term bridge; refi at stabilization.
Rent comps 17 comps
| Address | Beds | Baths | Sqft | Rent | $/sqft | DOM | Units | Dist |
|---|---|---|---|---|---|---|---|---|
| 1231 N 23rd St Unit 205 Grand Junction, CO | — | 1.0 | 680 | $1,345 | $1.98 | 15d | 1 | 0.53mi |
| 1229 N 23rd St Ste 201 Grand Junction, CO | 1.0 | 1.0 | 500 | $1,160 | $2.32 | 22d | 1 | 0.56mi |
| 1615 N 20th St Unit A Grand Junction, CO | 1.0 | 1.0 | 700 | $1,550 | $2.21 | 15d | 1 | 0.72mi |
| 446 N 22nd St Apt 4 Grand Junction, CO | 2.0 | 1.0 | 700 | $1,300 | $1.86 | 15d | 1 | 0.83mi |
| 1600 North Ave Unit 217 Grand Junction, CO | 1.0 | 1.0 | 360 | $595 | $1.65 | 15d | 1 | 0.92mi |
| 1600 North Ave Unit 134 Grand Junction, CO | 1.0 | 1.0 | 360 | $795 | $2.21 | 22d | 1 | 0.92mi |
| 1510 Glenwood Ave Unit 202 Grand Junction, CO | 1.0 | 1.0 | 555 | $860 | $1.55 | 15d | 1 | 1.00mi |
| 1510 Glenwood Ave Unit 100 Grand Junction, CO | 1.0 | 1.0 | 555 | $860 | $1.55 | 15d | 1 | 1.00mi |
| 1425 Bunting Ave Grand Junction, CO | 1.0 | 1.0 | 636 | $1,295 | $2.04 | 22d | 1 | 1.06mi |
| 1368 Elm Ave Grand Junction, CO | 2.0 | 1.0 | 750 | $1,100 | $1.47 | 15d | 1 | 1.09mi |
| 1302 Glenwood Ave Unit 104 Grand Junction, CO | 2.0 | 1.0 | 654 | $1,200 | $1.83 | 15d | 1 | 1.15mi |
| 1302 Glenwood Ave Unit 104 Grand Junction, CO | 2.0 | 1.0 | 654 | $1,200 | $1.83 | 22d | 1 | 1.15mi |
| 541-529 E 1/2 Rd Grand Junction, CO | 1.0–2.0 | 1.0 | 687 | $1,310 | $1.91 | 15d | 1 | 1.19mi |
| 1260 Bookcliff Ave Grand Junction, CO | 2.0 | 1.0–2.0 | 681 | $1,625 | $2.39 | 22d | 1 | 1.30mi |
| 923 N 12th St Unit 19 Grand Junction, CO | — | 1.0 | 500 | $1,000 | $2.00 | 22d | 1 | 1.35mi |
| 923 N 12th St Unit 26 Grand Junction, CO | 1.0 | 1.0 | 600 | $1,100 | $1.83 | 22d | 1 | 1.35mi |
| 2961 1/2 Cedar Pl Grand Junction, CO | 2.0 | 1.0 | 720 | $1,250 | $1.74 | 22d | 1 | 1.44mi |
Listing history 5 events
-
2026-05-15status Pending
-
2026-05-01price $199,000
-
2026-04-20price $223,250
-
2026-03-19$235,000 Active
-
2025-09-20$260,000 Active
ⓘ Source: listings_history table (triggers on properties + properties_extension) + one-shot
backfill from property_details.listing_events for pre-trigger history.
Tax reassessment forecast CO · Resets to sale price
- Current annual tax
- $2,175 · $181/mo
- Projected year-2 tax
- $2,175 · $181/mo
- Expected delta
- $0/yr ($0/mo · 0.0%)
ⓘ Screening estimate from a state-policy table — verify with the county assessor before closing.
Climate risk First Street
- Flood 1/10 Low FEMA zone X (unshaded) · 0% chance over 30 yrs
- Wildfire 1/10 Low
- Heat 5/10 Major 7 d/yr ≥96°F today · 19 d/yr by 30 yrs out
- Wind 1/10 Low
- Air quality 2/10 Low 1 unhealthy d/yr today · 1 by 30 yrs out
Nearby sold comps map
Loading sold comps map…
Walkable amenities ~0.75 mi
Loading nearby amenities…
Taxation est. · year 1
- Rental income
- $14,242
- − Mortgage interest
- −$11,147
- − Property taxes
- −$2,175
- − Insurance
- −$995
- − Repairs & maintenance
- −$1,139
- − Management
- −$1,139
- − Depreciation
- −$5,789
- Taxable loss
- −$8,143
- Est. tax savings @ 24.0%
- +$1,954
- After-tax cash flow
- $-2,488/yr
For passive investors: Depreciation is non-cash, so a rental often shows a tax loss while cash-flowing — sheltering income. Rental losses are passive: they offset passive income freely, and up to $25,000/yr can offset ordinary (W-2) income if you actively participate and your MAGI is under $100k (phasing out to $0 by $150k); unused losses carry forward. On sale, claimed depreciation is recaptured at up to 25%, and gains may owe capital-gains tax (a 1031 exchange can defer both). Figures are a year-1 estimate at your 24.0% rate — not tax advice; consult a CPA.
Schools (NCES district)
- District
- Mesa County Valley School District No. 51
- NCES district ID
- 0804350
- Math proficiency
- 26% ▲ 1.00%
- Reading proficiency
- 38% ▬ 0.00%
- Median HH income
- $50,189
- Composite
- 27.83/100
- National rank
- #6884
- State rank
- #43 of 86 in CO
Livability — Grand Junction
- Score
- 79/100
- State rank
- #15
- US rank
- #2222
Category grades
Schools grade is shown separately in the Schools card above.
Census & demographics
- Census place
- Grand Junction, CO
- County
- Mesa County · 143,088 people
- City population
- 113,583
- Metro
- Grand Junction, CO
- Population (ZIP)
- 24,011
- Household income
- $53,666
- Rent vs Own
- Severe rent burden
- 1317.0
Population outlook (Mesa County) Hauer SSP2
- Today (2025)
- 153,000 people
- By 2030
- 154,479 · +1.0%
- By 2040
- 155,257 · +1.5%
- By 2050
- 153,384 · +0.3%
- By 2075
- 144,735 · -5.4%
- By 2100
- 123,825 · -19.1%
Race, ethnicity, and origin ACS 2023
- Neighborhood character
- Predominantly White (76%)
- Race & ethnicity
- White 76% Hispanic / Latino 17% Two or more races 9% Native American 1% Asian 1% Black 1%
- Hispanic origin (detail)
- Mexican 9%
- Common ancestry
- Slovak 3% Lithuanian 3% Italian 3%
- Foreign-born
- 5% · Canada
- Languages at home
- 93% English-only · Spanish 5% Russian/Polish/Slavic 1% Other Asian/Pacific 1%
Political lean MEDSL · Mesa
- 2024 margin
- Strong R (+24.3) · D 36.6% · R 61.0% · Other 2.4%
- 2008→2024 swing
- +5.2pp toward D · 2008: -29.5pp · 2024: -24.3pp
- All cycles
- 2024: R+24.3 2020: R+28.0 2016: R+36.3 2012: R+32.8 2008: R+29.5
Not yet ingested
- Civics
- —
Market trends
- HPI YoY
- ▼ -385.18%
- Current HPI
- 331.3836
- Rent YoY
- ▲ 6.92%
- Metro
- Grand Junction, CO
- State GDP YoY
- ▲ 1.95%
- F500 in state
- 14
Industry mix (Fortune 500 HQ in CO)
| Industry | F500 HQs | Revenue |
|---|---|---|
| Technology Distribution | 1 | $31B |
|
||
| Food / Agriculture | 1 | $18B |
|
||
| Packaging | 1 | $14B |
|
||
| Healthcare | 1 | $13B |
|
||
| Energy | 1 | $10B |
|
||
| Technology | 1 | $4B |
|
||
Price history
-23.5% since first listed5 events — show timeline
- 2026-05-15 Pending — GJARA
- 2026-05-01 Price Changed $199,000 GJARA
- 2026-04-20 Price Changed $223,250 GJARA
- 2026-03-19 Listed $235,000 GJARA
- 2025-09-20 Listed $260,000 GJARA
Property tax history
+6.3%/yrLatest (2025): $2,175 · +125.5% YoY. Source: county tax records.
Cash-flow waterfall
monthlySold comps — $/sqft
last 12 mo · ≤1 miLoading sold comps…