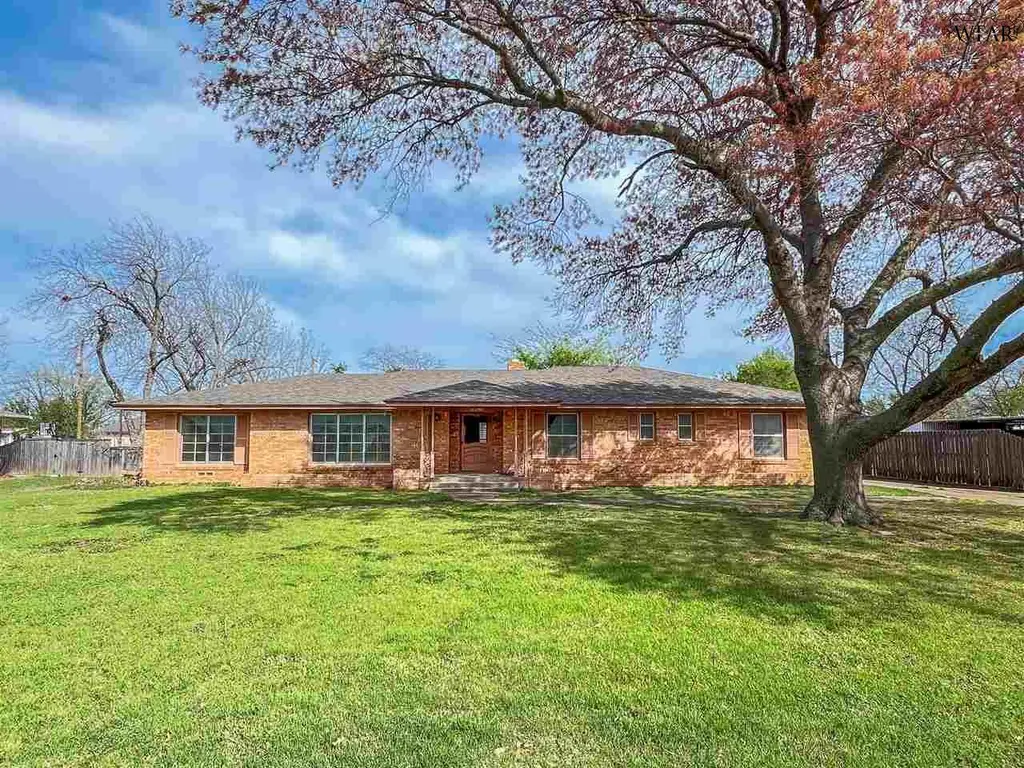
812 S Ash St · Archer City, TX
Flood risk 1/10 · Minimal
- FEMA flood zone
- X (unshaded)
- Chance of flooding over 30 yrs
- 0.0%
- Est. flood insurance / yr
- $507 – $1,088
Fire risk 8/10 · Major
- Est. fire insurance / yr
- $1,222 – $2,270
Heat risk 7/10 · Major
- Hot days now (above 109°F)
- 7 days/yr
- Hot days in 30 yrs
- 19 days/yr
Wind risk 4/10 · Minor
- Chance of severe wind over 30 yrs
- 11.0%
Air-quality risk 1/10 · Minimal
- Unhealthy air days now
- 0 days/yr
- Unhealthy air days in 30 yrs
- 0 days/yr
Risk factors via First Street. Map © Google.
Why this score? — see what drove the D grade
The composite is a weighted blend of 9 inputs, each scored 0–100. Each bar is that input's sub-score; the figure is the points it added to the 100-point composite (weight × sub-score).
- ARV discount +15.0/15.0
- Appreciation +8.5/10.0
- Schools +5.0/10.0
- Cash flow +4.3/30.0
- Livability +3.7/5.0
- Rent growth +2.5/5.0
- Condition / age +2.5/5.0
- 1% rule +2.0/10.0
- DSCR +0.0/10.0
$189,900
🖨 Deal sheet (PDF) 📄 Offer letter ✓ Due diligence
Listing remarks MLS
Stately home just 1/2 block from ACISD. Spacious throughout this home provides a formal living room and dining room with great natural light from pane windows. The large kitchen with metal cabinets, walk-in pantry and desk area leave plenty of room for your dream kitchen. The inviting family room has wood beams, wood paneling and a fireplace w large windows overlooking the patio. A hall bath connects to the primary suite. A Jack & Jill bath serves the front 2 bedrooms. Conditioned storage leads to garage.
Key facts
- Inviting family room
- Large kitchen
- Dining room
Tags
Neighborhood map
What this means for you Summary
Snapshot
- This is a 3-bed/0.5-bath single-family listed at $190k.
Deal economics
- At list price, monthly cash flow is $-505 ($-6k/yr) — negative.
- To cash-flow at today's rent, offer at most $114k (40.0% below list).
- To meet the 1% rule (rent ≥ 1% of price), the offer needs to be $132k (30.3% below list).
- Recommended offer: $114k (40.0% below list) — sets the bar for cash-flow.
Location & tenants
- Location reads 73/100 on livability (#220 in TX) — a middle-class / working-renter tenant base. Strengths: crime A+, cost of living A+, housing A+; Watch: health & safety C-, employment D+, amenities F.
- Archer City ISD (rural): math 56% / reading 63% proficiency, ranked #79 of 826 in TX (top 10%) — acceptable for families but not a draw, mixed tenant base, ~2y average lease.
- Zoned schools: Archer City El (math 62% / reading 62%, grade B, #321 of 4,322 statewide, top 8%, 287 students, 54% FRL); Archer City H S (math 47% / reading 62%, grade C-, #379 of 1,632 statewide, top 26%, 206 students, 48% FRL) — zoned schools average 51% FRL vs 34% district-wide (17 pts higher); higher-poverty schools than district average — tighter screening recommended.
- Market conditions: 8 active listings in the ZIP; 25 units permitted in Archer County in 2024 (0 in 5+ unit buildings).
Forward outlook
- In year one you build about $15k of equity ($1k loan paydown + $13k appreciation (7.1% local appreciation)).
- Archer County population projected at -22% by 2050 — secular population decline; favor cash flow + early exit over multi-decade hold.
- By year 3, paydown + projected appreciation supports a ~$37k cash-out refi (75% LTV) — recoverable capital for the next deal without selling this one.
Negotiation context
- It's been on market 447 days — a 12% lower offer ($167k) is reasonable based on typical stale-listing flexibility.
- 4 sale attempts; this cycle's ask has dropped $75k (28%) from the opening price — seller is motivated, your offer sets the floor, not the list.
Risks & watch-outs
- Watch-outs: property tax is 3.0% of price; built in 1954 — expect roof / HVAC / electrical / plumbing capex.
- Climate carrying-cost: severe wildfire risk; extreme-heat days projected 7→19/yr by 2055 (HVAC capex compounding) — expect insurance premiums to compound above CPI over the hold.
Questions for the listing agent
- What do current leases actually rent for vs. the listed asking? Can we see a recent rent roll and the last 12 months of T-12 income?
- It's been on market 447 days. Have you received any prior offers? Is the seller open to a 40% concession, seller financing, or rate buy-down credit?
- Built in 1954 — when were the roof, HVAC, electrical panel, plumbing, and water heater last replaced?
- Property tax is high relative to price — has the assessment been appealed recently, and will the sale trigger a re-assessment?
- Why hasn't it sold? Are there any deal-killer items the seller is aware of (foundation, flood, title, zoning, code violations)?
- Is there a deadline driving the sale (1031 exchange, divorce, estate, relocation)? That informs how much negotiation room exists.
- Schools are B-rated — typically a magnet for longer-tenancy family renters. What's the average tenant stay here, and is there a school-zone premium baked into asking?
- The area grade is low — what's the realistic commute time and amenity access for the typical tenant pool here? Any planned neighborhood developments (good or bad) we should know about?
- What's the average days-on-market for RENTAL listings here right now (not sales)? A rising rental-DOM trend means longer vacancies and softer asking-rent achievability than the comps imply.
- What's the recent tenant-quality profile in this submarket — average credit score on applications, eviction rate, late-payment / NSF rate, and stable-employment percentage? A property-management company in the area should have these aggregated.
- How much new for-sale + rental construction is in the pipeline within 1–3 miles? Heavy new supply typically softens prices + rents 12–24 months out; constrained supply supports both.
Investment metrics
- 1% rule
- 0.70% ✗
- Cap rate
- 3.10%
- Cash-on-cash
- -11.39%
- DSCR
- 0.49
- GRM
- 12.0
CMA / ARV
- ARV (median comp)
- $361,774
- List price
- $189,900
- Delta
- -47.51%
- Verdict
- UNDERPRICED
- Comps
- 3 within 1.0 mi
Projected returns pro-forma
7.06% appreciation · 3.0% rent growth · sell at horizon
- IRR
- 9.1%
- Equity multiple
- 1.66×
- Total profit
- $34,981
- Equity at exit
- $132,283
- IRR
- 10.5%
- Equity multiple
- 3.37×
- Total profit
- $125,998
- Equity at exit
- $251,904
Cash invested: $53,172 (down + closing). Projections, not guarantees.
Landlord ↔ Tenant lean methodology
- Overall (STATE)
- 87 Strongly Landlord-Friendly
- State Texas
- 87 Strongly Landlord-Friendly · R+5
- County
- — inherits STATE
- City
- — inherits STATE
ZIP-level market 76351
- Home prices YoY
- 7.0%
- Active inventory
- 8
- Price-to-rent
- 12.0×
Monthly cashflow live
- Estimated rent
- $1,323 medium interval (Pro) →
- Mortgage (P&I)
- −$996
- Tax from tax record
- −$475 /mo · $5,696/yr
- Insurance
- −$79
- HOA
- −$0
- Vacancy / Maint / Mgmt
- −$278
- Net cashflow
- $-505
Break-even live
Sensitivity live
| Price | -10% $-397 | -5% $-451 | +0% $-505 | +5% $-558 | +10% $-612 |
|---|---|---|---|---|---|
| Rent | -10% $-609 | -5% $-557 | +0% $-505 | +5% $-452 | +10% $-400 |
| Rate | -1.0pp $-409 | -0.5pp $-456 | base $-505 | +0.5pp $-554 | +1.0pp $-604 |
UW: 25.0% down · 7.5% · 30yr · 1.5% tax · 5.0% vac · 8.0% maint · 8.0% mgmt
Financing live
Cash to close
- Down payment
- $47,475
- Closing costs
- $5,697
- Reserves months
- —
- Total cash needed
- —
Loan-product check · same deal, 3 products live
Conventional
25% down · 7.5% · 30yr
- Down + closing
- —
- Monthly P&I
- —
- Monthly cashflow
- —
- DSCR
- —
- Eligible?
- —
Personal DTI + credit; lowest rate.
DSCR
20% down · 8.5% · 30yr
- Down + closing
- —
- Monthly P&I
- —
- Monthly cashflow
- —
- DSCR
- —
- Eligible?
- —
No personal income docs; deal must DSCR.
Hard money
10% down · 12.0% · 12mo
- Down + closing
- —
- Monthly P&I
- —
- Monthly cashflow
- —
- DSCR
- —
- Eligible?
- —
Short-term bridge; refi at stabilization.
Listing history 30 events
-
2026-06-22days on market $189,900 Active 447 DOM
-
2026-06-19days on market $189,900 Active 445 DOM
-
2026-06-18days on market $189,900 Active 444 DOM
-
2026-06-17days on market $189,900 Active 443 DOM
-
2026-06-16days on market $189,900 Active 442 DOM
-
2026-06-15days on market $189,900 Active 441 DOM
-
2026-06-14days on market $189,900 Active 439 DOM
-
2026-06-13days on market $189,900 Active 438 DOM
-
2026-06-10days on market $189,900 Active 436 DOM
-
2026-06-09days on market $189,900 Active 435 DOM
-
2026-06-08days on market $189,900 Active 434 DOM
-
2026-06-07days on market $189,900 Active 433 DOM
-
2026-06-05days on market $189,900 Active 430 DOM
-
2026-06-03days on market $189,900 Active 429 DOM
-
2026-06-02days on market $189,900 Active 428 DOM
-
2026-06-01days on market $189,900 Active 427 DOM
-
2026-05-31days on market $189,900 Active 426 DOM
-
2026-05-30days on market $189,900 Active 425 DOM
-
2026-04-01historical
-
2026-03-13price $189,900 516-char remark
Show marketing remark (516 chars)
Stately home just 1/2 block from ACISD. Spacious throughout this home provides a formal living room and dining room with great natural light from pane windows. The large kitchen with metal cabinets, walk-in pantry and desk area leave plenty of room for your dream kitchen. The inviting family room has wood beams, wood paneling and a fireplace w large windows overlooking the patio. A hall bath connects to the primary suite. A Jack & Jill bath serves the front 2 bedrooms. Conditioned storage leads to garage.
-
2026-03-10price $189,900
-
2025-10-23price $224,500 516-char remark
Show marketing remark (516 chars)
Stately home just 1/2 block from ACISD. Spacious throughout this home provides a formal living room and dining room with great natural light from pane windows. The large kitchen with metal cabinets, walk-in pantry and desk area leave plenty of room for your dream kitchen. The inviting family room has wood beams, wood paneling and a fireplace w large windows overlooking the patio. A hall bath connects to the primary suite. A Jack & Jill bath serves the front 2 bedrooms. Conditioned storage leads to garage.
-
2025-10-22price $224,500
-
2025-10-13$265,000 Active
-
2025-10-01historical
-
2025-08-18status Active
-
2025-08-08historical Active Option Contract
-
2025-04-26$265,000 Active
-
2025-03-31$265,000 Active 516-char remark
Show marketing remark (516 chars)
Stately home just 1/2 block from ACISD. Spacious throughout this home provides a formal living room and dining room with great natural light from pane windows. The large kitchen with metal cabinets, walk-in pantry and desk area leave plenty of room for your dream kitchen. The inviting family room has wood beams, wood paneling and a fireplace w large windows overlooking the patio. A hall bath connects to the primary suite. A Jack & Jill bath serves the front 2 bedrooms. Conditioned storage leads to garage.
-
1992-11-10soldstatus
ⓘ Source: listings_history table (triggers on properties + properties_extension) + one-shot
backfill from property_details.listing_events for pre-trigger history.
Tax reassessment forecast TX · Resets to sale price
- Current annual tax
- $5,696 · $475/mo
- Projected year-2 tax
- $5,696 · $475/mo
- Expected delta
- $0/yr ($0/mo · 0.0%)
ⓘ Screening estimate from a state-policy table — verify with the county assessor before closing.
Climate risk First Street
- Flood 1/10 Low FEMA zone X (unshaded) · 0% chance over 30 yrs
- Wildfire 8/10 Severe
- Heat 7/10 Severe 7 d/yr ≥109°F today · 19 d/yr by 30 yrs out
- Wind 4/10 Moderate 11% chance of damaging wind over 30 yrs
- Air quality 1/10 Low 0 unhealthy d/yr today · 0 by 30 yrs out
Nearby sold comps map
Loading sold comps map…
Walkable amenities ~0.75 mi
Loading nearby amenities…
Taxation est. · year 1
- Rental income
- $15,873
- − Mortgage interest
- −$10,637
- − Property taxes
- −$5,696
- − Insurance
- −$950
- − Repairs & maintenance
- −$1,270
- − Management
- −$1,270
- − Depreciation
- −$5,524
- Taxable loss
- −$9,474
- Est. tax savings @ 24.0%
- +$2,274
- After-tax cash flow
- $-3,782/yr
For passive investors: Depreciation is non-cash, so a rental often shows a tax loss while cash-flowing — sheltering income. Rental losses are passive: they offset passive income freely, and up to $25,000/yr can offset ordinary (W-2) income if you actively participate and your MAGI is under $100k (phasing out to $0 by $150k); unused losses carry forward. On sale, claimed depreciation is recaptured at up to 25%, and gains may owe capital-gains tax (a 1031 exchange can defer both). Figures are a year-1 estimate at your 24.0% rate — not tax advice; consult a CPA.
Schools (NCES district)
- District
- Archer City ISD
- NCES district ID
- 4808610
- Math proficiency
- 56% ▼ -10.00%
- Reading proficiency
- 63% ▼ -2.00%
- Median HH income
- $43,782
- Composite
- 50.04/100
- National rank
- #1917
- State rank
- #79 of 826 in TX
Livability — Archer City
- Score
- 73/100
- State rank
- #220
- US rank
- #5417
Category grades
Schools grade is shown separately in the Schools card above.
Census & demographics
- Census place
- Archer City, TX
- Population (ZIP)
- 1,481
Population outlook (Archer County) Hauer SSP2
- Today (2025)
- 8,158 people
- By 2030
- 7,855 · -3.7%
- By 2040
- 7,120 · -12.7%
- By 2050
- 6,320 · -22.5%
- By 2075
- 4,842 · -40.6%
- By 2100
- 3,527 · -56.8%
Race, ethnicity, and origin ACS 2023
- Neighborhood character
- Predominantly White (83%)
- Race & ethnicity
- White 83% Two or more races 10% Hispanic / Latino 6%
- Hispanic origin (detail)
- Mexican 6%
- Common ancestry
- Slovak 3%
- Foreign-born
- 6% · Canada
- Languages at home
- 94% English-only · Spanish 6%
Political lean MEDSL · Archer
- 2024 margin
- Solid R (+79.3) · D 10.1% · R 89.5%
- 2008→2024 swing
- -13.9pp toward R · 2008: -65.4pp · 2024: -79.3pp
- All cycles
- 2024: R+79.3 2020: R+80.4 2016: R+79.4 2012: R+73.8 2008: R+65.4
Not yet ingested
- Civics
- —
Market trends
- HPI YoY
- ▲ 7.06%
- Current HPI
- 107.3175
- Rent YoY
- —
- Metro
- —
- State GDP YoY
- ▲ 3.95%
- F500 in state
- 110
Industry mix (Fortune 500 HQ in TX)
| Industry | F500 HQs | Revenue |
|---|---|---|
| Energy | 16 | $1,198B |
|
||
| Technology | 5 | $198B |
|
||
| Engineering / Construction | 4 | $72B |
|
||
| Energy Services | 3 | $60B |
|
||
| Utilities | 3 | $41B |
|
||
| Healthcare | 2 | $330B |
|
||
Price history
-28.3% since first listed12 events — show timeline
- 2026-04-01 Listing Removed — NTREIS
- 2026-03-13 Price Changed $189,900 WFAOR
- 2026-03-10 Price Changed $189,900 NTREIS
- 2025-10-23 Price Changed $224,500 WFAOR
- 2025-10-22 Price Changed $224,500 NTREIS
- 2025-10-13 Listed $265,000 NTREIS
- 2025-10-01 Listing Removed — NTREIS
- 2025-08-18 Relisted — NTREIS
- 2025-08-08 Contingent — NTREIS
- 2025-04-26 Listed $265,000 NTREIS
- 2025-03-31 Listed $265,000 WFAOR
- 1992-11-10 Sold (Public Records) — Public Records
Property tax history
+5.3%/yrLatest (2025): $5,696 · -27.0% YoY. Source: county tax records.
Cash-flow waterfall
monthlySold comps — $/sqft
last 12 mo · ≤1 miLoading sold comps…