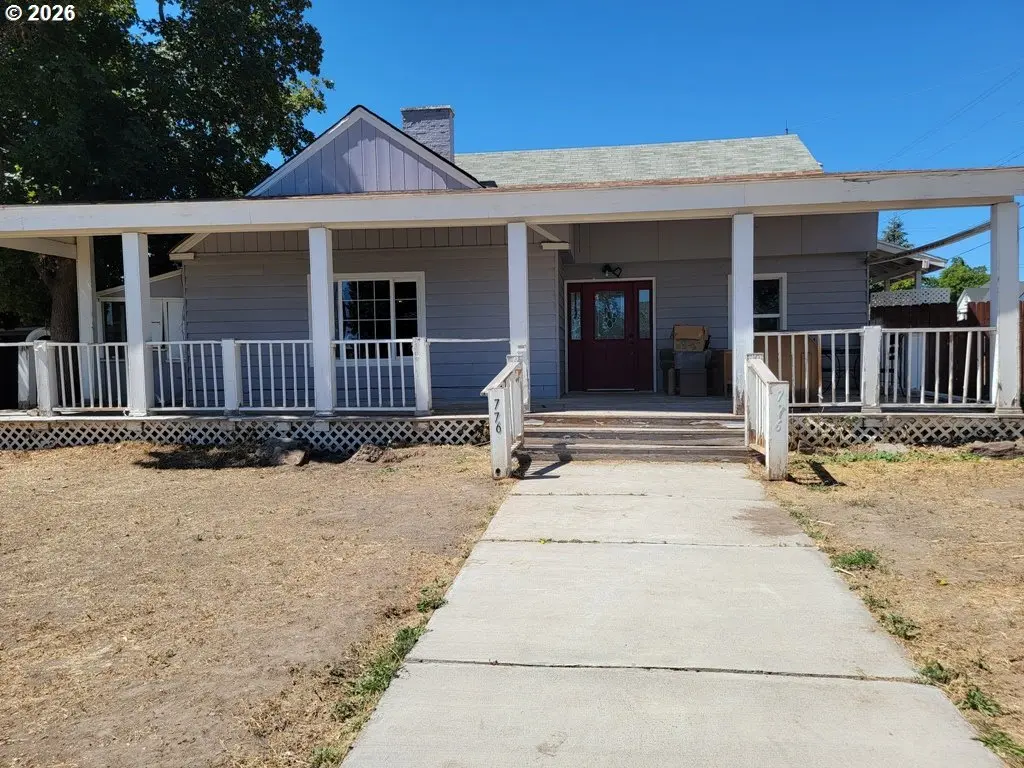
776 N Alvord Ave · Burns, OR
Flood risk 1/10 · Minimal
- FEMA flood zone
- X (unshaded)
- Chance of flooding over 30 yrs
- 0.0%
- Est. flood insurance / yr
- $507 – $1,088
Fire risk 7/10 · Major
- Est. fire insurance / yr
- $498 – $926
Heat risk 3/10 · Minor
- Hot days now (above 91°F)
- 7 days/yr
- Hot days in 30 yrs
- 17 days/yr
Wind risk 1/10 · Minimal
- Chance of severe wind over 30 yrs
- —
Air-quality risk 7/10 · Major
- Unhealthy air days now
- 10 days/yr
- Unhealthy air days in 30 yrs
- 10 days/yr
Risk factors via First Street. Map © Google.
Why this score? — see what drove the D grade
The composite is a weighted blend of 9 inputs, each scored 0–100. Each bar is that input's sub-score; the figure is the points it added to the 100-point composite (weight × sub-score).
- ARV discount +15.0/15.0
- Cash flow +11.3/30.0
- Livability +3.4/5.0
- DSCR +3.3/10.0
- 1% rule +2.7/10.0
- Schools +2.6/10.0
- Rent growth +2.5/5.0
- Condition / age +2.5/5.0
- Appreciation +0.0/10.0
$194,700
🖨 Deal sheet (PDF) 📄 Offer letter ✓ Due diligence
Listing remarks MLS
Full of character, charm, and opportunity! This 3-bedroom, 2-bath Craftsman-style home offers 1,660 sq ft of living space and sits on a spacious corner lot in a convenient location. With classic architectural details and renovations already underway, this home is ready for someone to bring their vision and finish creating something truly special.Step inside and you’ll immediately notice the original hardwood floors, vintage glass door knobs, and beautiful knotty pine tongue-and-groove walls upstairs that give the home its timeless character. Large windows throughout fill the home with natural light, creating a warm and inviting feel. The classic covered front porch is the perfect place to relax with a cup of coffee and enjoy the neighborhood.Updates have already been completed, including an updated kitchen and downstairs bathroom, along with fresh interior paint throughout much of the home. While some finishing work remains, the seller is including all purchased renovation materials, giving the next owner a valuable head start on completing the project.Outside, the property features a garage, breezeway, storage shed, and back deck, offering plenty of space for storage, hobbies, and outdoor living.Conveniently located across from the library and outside the floodplain, this property offers both charm and peace of mind.Motivated seller — bring your ideas and unlock the full potential of this classic Craftsman. Opportunities like this don’t come along often!Don’t miss the chance to bring this classic Craftsman back to life—schedule your private showing today.
Key facts
- Large windows
- Updated kitchen
- Updated bathroom
Tags
Neighborhood map
What this means for you Summary
Snapshot
- This is a 4-bed/3.0-bath single-family listed at $195k.
Deal economics
- At list price, monthly cash flow is $-72 ($-861/yr) — negative.
- To cash-flow at today's rent, offer at most $182k (6.5% below list).
- To meet the 1% rule (rent ≥ 1% of price), the offer needs to be $150k (23.0% below list).
- Recommended offer: $150k (23.0% below list) — sets the bar for 1% rule.
Location & tenants
- Location reads 67/100 on livability (#181 in OR) — a middle-class / working-renter tenant base. Strengths: cost of living A+, housing A+, crime B+; Watch: health & safety C-, amenities F, commute F.
- Harney County SD 3 (town): math 26% / reading 37% proficiency, ranked #41 of 58 in OR (top 71%) — families likely to look elsewhere, expect single-tenant / working-renter base with shorter leases.
- Zoned schools: Henry L Slater Elementary School (math 32% / reading 37%, grade F, #218 of 412 statewide, top 58%, 352 students, 59% FRL); Hines Middle School (math 22% / reading 37%, grade F, #86 of 128 statewide, top 72%, 164 students, 49% FRL); Burns High School (math 24% / reading 75%, grade D+, #32 of 143 statewide, top 34%, 219 students, 42% FRL) — zoned schools at 50% FRL track the district average.
- Market conditions: 9 active listings in the ZIP; 1 comparable units currently listed for rent nearby; 22 units permitted in Harney County in 2024 (0 in 5+ unit buildings).
Forward outlook
- Local home prices are declining (-3.0%/yr); year-one equity from $1k of loan paydown is wiped out by about $6k of value loss. Plan a longer hold.
- Harney County population projected at -25% by 2050 — secular population decline; favor cash flow + early exit over multi-decade hold.
Negotiation context
- It's been on market 101 days — a 9% lower offer ($177k) is reasonable based on typical stale-listing flexibility.
- Current owner paid $130k; 50% above their basis — modest negotiation headroom, anchor on the comps not their cost.
Risks & watch-outs
- Watch-outs: built in 1940 — expect roof / HVAC / electrical / plumbing capex.
- Climate carrying-cost: major wildfire risk — expect insurance premiums to compound above CPI over the hold.
Questions for the listing agent
- What do current leases actually rent for vs. the listed asking? Can we see a recent rent roll and the last 12 months of T-12 income?
- It's been on market 101 days. Have you received any prior offers? Is the seller open to a 23% concession, seller financing, or rate buy-down credit?
- Built in 1940 — when were the roof, HVAC, electrical panel, plumbing, and water heater last replaced?
- Why hasn't it sold? Are there any deal-killer items the seller is aware of (foundation, flood, title, zoning, code violations)?
- Is there a deadline driving the sale (1031 exchange, divorce, estate, relocation)? That informs how much negotiation room exists.
- Schools are D-rated, which usually means shorter tenancies and higher turnover. Who's the typical renter profile here, and what's been the actual vacancy rate?
- The area grade is low — what's the realistic commute time and amenity access for the typical tenant pool here? Any planned neighborhood developments (good or bad) we should know about?
- What's the average days-on-market for RENTAL listings here right now (not sales)? A rising rental-DOM trend means longer vacancies and softer asking-rent achievability than the comps imply.
- What's the recent tenant-quality profile in this submarket — average credit score on applications, eviction rate, late-payment / NSF rate, and stable-employment percentage? A property-management company in the area should have these aggregated.
- How much new for-sale + rental construction is in the pipeline within 1–3 miles? Heavy new supply typically softens prices + rents 12–24 months out; constrained supply supports both.
Investment metrics
- 1% rule
- 0.77% ✗
- Cap rate
- 5.85%
- Cash-on-cash
- -1.58%
- DSCR
- 0.93
- GRM
- 10.8
CMA / ARV
- ARV (median comp)
- $262,750
- List price
- $194,700
- Delta
- -25.90%
- Verdict
- UNDERPRICED
- Comps
- 3 within 1.0 mi
Show comp detail 1 sale within ~0.75 mi
| Address | Dist | Beds/Ba | Sqft | Sold | Price | $/sf | Match |
|---|---|---|---|---|---|---|---|
| 542 N Cedar Ave | 0.24mi | 3/2.0 (-1) | 1,528 (-8%) | 20mo | $263,000 | $172 | 50 |
Match score weights: distance 35% · size 25% · config 20% · recency 20%. Top-matched comps best support the ARV.
Projected returns pro-forma
-3.0% appreciation · 3.0% rent growth · sell at horizon
- IRR
- -18.9%
- Equity multiple
- 0.34×
- Total profit
- $-36,152
- Equity at exit
- $29,030
- IRR
- -11.5%
- Equity multiple
- 0.31×
- Total profit
- $-37,494
- Equity at exit
- $16,834
Cash invested: $54,516 (down + closing). Projections, not guarantees.
Landlord ↔ Tenant lean methodology
- Overall (STATE)
- 28 Tenant-Leaning
- State Oregon
- 28 Tenant-Leaning · D+6
- County
- — inherits STATE
- City
- — inherits STATE
ZIP-level market 97720
- Home prices YoY
- -5.9%
- Active inventory
- 9
- Price-to-rent
- 10.8×
Monthly cashflow live
- Estimated rent
- $1,500 medium interval (Pro) →
- Mortgage (P&I)
- −$1,021
- Tax from tax record
- −$155 /mo · $1,855/yr
- Insurance
- −$81
- HOA
- −$0
- Vacancy / Maint / Mgmt
- −$315
- Net cashflow
- $-72
Break-even live
Sensitivity live
| Price | -10% $38 | -5% $-17 | +0% $-72 | +5% $-127 | +10% $-182 |
|---|---|---|---|---|---|
| Rent | -10% $-190 | -5% $-131 | +0% $-72 | +5% $-13 | +10% $47 |
| Rate | -1.0pp $26 | -0.5pp $-22 | base $-72 | +0.5pp $-122 | +1.0pp $-174 |
UW: 25.0% down · 7.5% · 30yr · 1.5% tax · 5.0% vac · 8.0% maint · 8.0% mgmt
Financing live
Cash to close
- Down payment
- $48,675
- Closing costs
- $5,841
- Reserves months
- —
- Total cash needed
- —
Loan-product check · same deal, 3 products live
Conventional
25% down · 7.5% · 30yr
- Down + closing
- —
- Monthly P&I
- —
- Monthly cashflow
- —
- DSCR
- —
- Eligible?
- —
Personal DTI + credit; lowest rate.
DSCR
20% down · 8.5% · 30yr
- Down + closing
- —
- Monthly P&I
- —
- Monthly cashflow
- —
- DSCR
- —
- Eligible?
- —
No personal income docs; deal must DSCR.
Hard money
10% down · 12.0% · 12mo
- Down + closing
- —
- Monthly P&I
- —
- Monthly cashflow
- —
- DSCR
- —
- Eligible?
- —
Short-term bridge; refi at stabilization.
Rent comps 1 comps
| Address | Beds | Baths | Sqft | Rent | $/sqft | DOM | Units | Dist |
|---|---|---|---|---|---|---|---|---|
| 436 S Diamond Ave Burns, OR | 3.0 | 3.0 | 1803 | $1,500 | $0.83 | 45d | 1 | 0.69mi |
Listing history 19 events
-
2026-06-21days on market $194,700 Active 101 DOM
-
2026-06-21days on market $194,700 Active 100 DOM
-
2026-06-18days on market $194,700 Active 98 DOM
-
2026-06-17days on market $194,700 Active 97 DOM
-
2026-06-16days on market $194,700 Active 96 DOM
-
2026-06-15days on market $194,700 Active 95 DOM
-
2026-06-13days on market $194,700 Active 93 DOM
-
2026-06-12days on market $194,700 Active 92 DOM
-
2026-06-09days on market $194,700 Active 89 DOM
-
2026-06-08days on market $194,700 Active 88 DOM
-
2026-06-08days on market $194,700 Active 87 DOM
-
2026-06-05days on market $194,700 Active 85 DOM
-
2026-06-04days on market $194,700 Active 83 DOM
-
2026-06-02days on market $194,700 Active 82 DOM
-
2026-06-01days on market $194,700 Active 81 DOM
-
2026-05-31days on market $194,700 Active 80 DOM
-
2026-03-12$194,700 Active 1612-char remark
Show marketing remark (1612 chars)
Full of character, charm, and opportunity! This 3-bedroom, 2-bath Craftsman-style home offers 1,660 sq ft of living space and sits on a spacious corner lot in a convenient location. With classic architectural details and renovations already underway, this home is ready for someone to bring their vision and finish creating something truly special.Step inside and you’ll immediately notice the original hardwood floors, vintage glass door knobs, and beautiful knotty pine tongue-and-groove walls upstairs that give the home its timeless character. Large windows throughout fill the home with natural light, creating a warm and inviting feel. The classic covered front porch is the perfect place to relax with a cup of coffee and enjoy the neighborhood.Updates have already been completed, including an updated kitchen and downstairs bathroom, along with fresh interior paint throughout much of the home. While some finishing work remains, the seller is including all purchased renovation materials, giving the next owner a valuable head start on completing the project.Outside, the property features a garage, breezeway, storage shed, and back deck, offering plenty of space for storage, hobbies, and outdoor living.Conveniently located across from the library and outside the floodplain, this property offers both charm and peace of mind.Motivated seller — bring your ideas and unlock the full potential of this classic Craftsman. Opportunities like this don’t come along often!Don’t miss the chance to bring this classic Craftsman back to life—schedule your private showing today.
-
2022-05-10soldstatus $130,000
-
2015-09-16soldstatus $72,500
ⓘ Source: listings_history table (triggers on properties + properties_extension) + one-shot
backfill from property_details.listing_events for pre-trigger history.
Tax reassessment forecast OR · Resets to sale price
- Current annual tax
- $1,855 · $155/mo
- Projected year-2 tax
- $1,889 · $157/mo
- Expected delta
- +$33/yr (+$3/mo · 1.8%)
ⓘ Screening estimate from a state-policy table — verify with the county assessor before closing.
Climate risk First Street
- Flood 1/10 Low FEMA zone X (unshaded) · 0% chance over 30 yrs
- Wildfire 7/10 Severe
- Heat 3/10 Moderate 7 d/yr ≥91°F today · 17 d/yr by 30 yrs out
- Wind 1/10 Low
- Air quality 7/10 Severe 10 unhealthy d/yr today · 10 by 30 yrs out
Nearby sold comps map
Loading sold comps map…
Walkable amenities ~0.75 mi
Loading nearby amenities…
Taxation est. · year 1
- Rental income
- $18,000
- − Mortgage interest
- −$10,906
- − Property taxes
- −$1,855
- − Insurance
- −$974
- − Repairs & maintenance
- −$1,440
- − Management
- −$1,440
- − Depreciation
- −$5,664
- Taxable loss
- −$4,279
- Est. tax savings @ 24.0%
- +$1,027
- After-tax cash flow
- $166/yr
For passive investors: Depreciation is non-cash, so a rental often shows a tax loss while cash-flowing — sheltering income. Rental losses are passive: they offset passive income freely, and up to $25,000/yr can offset ordinary (W-2) income if you actively participate and your MAGI is under $100k (phasing out to $0 by $150k); unused losses carry forward. On sale, claimed depreciation is recaptured at up to 25%, and gains may owe capital-gains tax (a 1031 exchange can defer both). Figures are a year-1 estimate at your 24.0% rate — not tax advice; consult a CPA.
Schools (NCES district)
- District
- Harney County SD 3
- NCES district ID
- 4102490
- Math proficiency
- 26% ▼ -2.00%
- Reading proficiency
- 37% ▼ -4.00%
- Median HH income
- $37,892
- Composite
- 26.25/100
- National rank
- #7256
- State rank
- #41 of 58 in OR
Livability — Burns
- Score
- 67/100
- State rank
- #181
- US rank
- #11110
Category grades
Schools grade is shown separately in the Schools card above.
Census & demographics
- Census place
- Burns, OR
- Population (ZIP)
- 4,456
Population outlook (Harney County) Hauer SSP2
- Today (2025)
- 6,663 people
- By 2030
- 6,311 · -5.3%
- By 2040
- 5,611 · -15.8%
- By 2050
- 4,991 · -25.1%
- By 2075
- 3,796 · -43.0%
- By 2100
- 2,769 · -58.4%
Race, ethnicity, and origin ACS 2023
- Neighborhood character
- Predominantly White (81%)
- Race & ethnicity
- White 81% Two or more races 12% Hispanic / Latino 6% Native American 2%
- Hispanic origin (detail)
- Mexican 5%
- Common ancestry
- Lithuanian 3% Slovak 3% Romanian 3%
- Foreign-born
- 3% · Canada
- Languages at home
- 94% English-only · Spanish 4% Other Asian/Pacific 1%
Political lean MEDSL · Harney
- 2024 margin
- Solid R (+59.4) · D 18.8% · R 78.2% · Other 3.0%
- 2008→2024 swing
- -14.7pp toward R · 2008: -44.7pp · 2024: -59.4pp
- All cycles
- 2024: R+59.4 2020: R+57.6 2016: R+57.7 2012: R+50.1 2008: R+44.7
Not yet ingested
- Civics
- —
Market trends
- HPI YoY
- ▼ -15.06%
- Current HPI
- 240.1575
- Rent YoY
- —
- Metro
- —
- State GDP YoY
- ▲ 2.05%
- F500 in state
- 2
Industry mix (Fortune 500 HQ in OR)
| Industry | F500 HQs | Revenue |
|---|---|---|
| Consumer Goods | 1 | $51B |
|
||
Price history
+168.6% since first listed3 events — show timeline
- 2026-03-12 Listed $194,700 RMLS
- 2022-05-10 Sold (Public Records) $130,000 Public Records
- 2015-09-16 Sold (Public Records) $72,500 Public Records
Property tax history
+3.9%/yrLatest (2025): $1,855 · +1.6% YoY. Source: county tax records.
Cash-flow waterfall
monthlySold comps — $/sqft
last 12 mo · ≤1 miLoading sold comps…