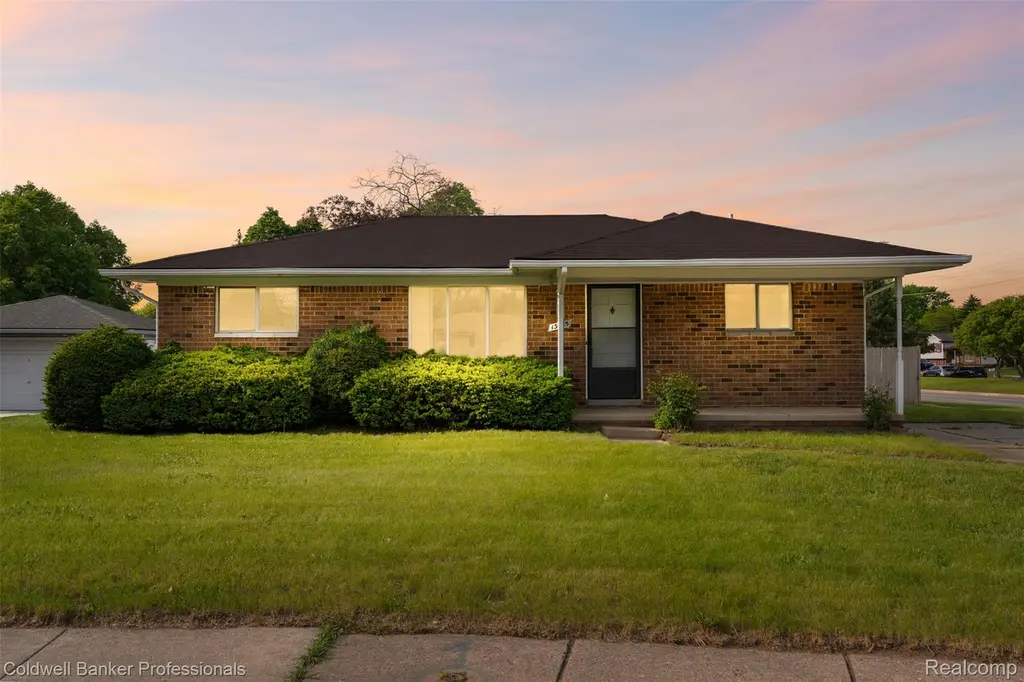
13485 Bernadette Ct · Sterling Heights, MI
Flood risk 1/10 · Minimal
- FEMA flood zone
- X (unshaded)
- Chance of flooding over 30 yrs
- 0.0%
- Est. flood insurance / yr
- $473 – $860
Fire risk 1/10 · Minimal
- Est. fire insurance / yr
- $784 – $1,456
Heat risk 3/10 · Minor
- Hot days now (above 96°F)
- 7 days/yr
- Hot days in 30 yrs
- 15 days/yr
Wind risk 1/10 · Minimal
- Chance of severe wind over 30 yrs
- —
Air-quality risk 3/10 · Minor
- Unhealthy air days now
- 3 days/yr
- Unhealthy air days in 30 yrs
- 5 days/yr
Risk factors via First Street. Map © Google.
Why this score? — see what drove the D- grade
The composite is a weighted blend of 9 inputs, each scored 0–100. Each bar is that input's sub-score; the figure is the points it added to the 100-point composite (weight × sub-score).
- ARV discount +12.7/15.0
- Cash flow +7.0/30.0
- Schools +4.1/10.0
- Livability +3.7/5.0
- Rent growth +3.3/5.0
- Condition / age +2.5/5.0
- 1% rule +2.2/10.0
- DSCR +1.2/10.0
- Appreciation +0.0/10.0
$229,000
🖨 Deal sheet (PDF) 📄 Offer letter ✓ Due diligence
Listing remarks MLS
* * * BACK ON MARKET DUE TO BUYER FINANCING * * * Tucked away on a cul-de-sac in Sterling Heights, this charming ranch offers 3 bedrooms, 1 full bath, and endless potential to make it your own. Perfectly situated in Sterling Heights, this home provides the convenience of nearby parks, shopping, and dining, all within a well-maintained community. This home is located within the highly regarded Utica Community Schools district. A wonderful opportunity for buyers looking to add their personal touch and create the perfect place to call home. New Hot Water Tank - June 2026
Key facts
- Nearby parks
- Cul-de-sac
- 9,148 sq ft lot
Tags
Property features AI
Exterior
- Parking: No garage
- Utilities: Public water; Public sewer; Circuit breaker electrical service; Underground utilities
- Home design: Single-family residence; One story; Ground-level entry; Brick construction
- Construction: Brick exterior; Asphalt roof
- Exterior features: Covered porch; Patio/porch; Back yard fencing; Cul-de-sac lot; Paved road
Interior
- Kitchen: Gas cooktop; Range hood; Free-standing refrigerator
- Bedrooms: 6 total rooms
- Bathrooms: 1 full bathroom
- Heating & cooling: Forced air heating (natural gas); Central air conditioning
- Interior features: Unfurnished; Unfinished basement
- Laundry & utility: Washer; Dryer; Gas water heater
Neighborhood map
What this means for you Summary
Snapshot
- This is a 3-bed/1.0-bath single-family listed at $229k.
Deal economics
- At list price, monthly cash flow is $-335 ($-4k/yr) — negative.
- To cash-flow at today's rent, offer at most $170k (25.9% below list).
- To meet the 1% rule (rent ≥ 1% of price), the offer needs to be $165k (28.2% below list).
- Recommended offer: $165k (28.2% below list) — sets the bar for 1% rule.
- Cap rate 4.5% vs local median 3.8% in Sterling Heights — meaningfully above typical; check what's discounted (condition, days-on-market, listing class) to confirm the premium yield is real.
Location & tenants
- Location reads 74/100 on livability (#173 in MI, #4,545 nationally) — a middle-class / working-renter tenant base. Strengths: commute A+, cost of living A+, housing A+; Watch: health & safety D+, amenities F.
- Utica Community Schools (suburban): math 38% / reading 53% proficiency, ranked #126 of 540 in MI (top 23%) — families likely to look elsewhere, expect single-tenant / working-renter base with shorter leases.
- Zoned schools: Havel Elementary School (math 33% / reading 47%, grade F, #596 of 1,397 statewide, top 43%, 586 students, 51% FRL); Bemis Junior High School (math 41% / reading 63%, grade C+, #95 of 493 statewide, top 20%, 805 students, 44% FRL); Henry Ford Ii High School (math 33% / reading 57%, grade D-, #211 of 713 statewide, top 30%, 1,717 students, 37% FRL) — zoned schools average 44% FRL vs 26% district-wide (18 pts higher); higher-poverty schools than district average — tighter screening recommended.
- Market conditions: Rents rising (+3.2%/yr); 113 active listings in the ZIP; 7 comparable units currently listed for rent nearby; rentals leasing fast (median 4d on market — plan ~1-2 weeks tenant-placement turnaround); solid renter incomes; 1,321 units permitted in Macomb County in 2024 (86 in 5+ unit buildings).
Forward outlook
- Local home prices are declining (-3.0%/yr); year-one equity from $2k of loan paydown is wiped out by about $7k of value loss. Plan a longer hold.
- Macomb County population projected at +9% by 2050 — modest demand growth; plan on rents tracking national, not racing it.
Negotiation context
- Only 6 days on market — expect competitive offers; lowballing is unlikely to land.
- 4 sale attempts with the ask held roughly flat each time — persistent listings suggest the price (not the market) is what's stuck; bring a comps-based counter.
- Current owner paid $115k; list at $229k implies a 99% gain — meaningful room to come down on a strong offer.
Questions for the listing agent
- What do current leases actually rent for vs. the listed asking? Can we see a recent rent roll and the last 12 months of T-12 income?
- Built in 1962 — when were the roof, HVAC, electrical panel, plumbing, and water heater last replaced?
- Is there a deadline driving the sale (1031 exchange, divorce, estate, relocation)? That informs how much negotiation room exists.
- The area grade is low — what's the realistic commute time and amenity access for the typical tenant pool here? Any planned neighborhood developments (good or bad) we should know about?
- What's the average days-on-market for RENTAL listings here right now (not sales)? A rising rental-DOM trend means longer vacancies and softer asking-rent achievability than the comps imply.
- What's the recent tenant-quality profile in this submarket — average credit score on applications, eviction rate, late-payment / NSF rate, and stable-employment percentage? A property-management company in the area should have these aggregated.
- How much new for-sale + rental construction is in the pipeline within 1–3 miles? Heavy new supply typically softens prices + rents 12–24 months out; constrained supply supports both.
Investment metrics
- 1% rule
- 0.72% ✗
- Cap rate
- 4.54%
- Cash-on-cash
- -6.28%
- DSCR
- 0.72
- GRM
- 11.6
CMA / ARV
- ARV (on-the-fly)
- $259,074
- Comps found
- 9
Show comp detail 9 sales within ~0.75 mi
| Address | Dist | Beds/Ba | Sqft | Sold | Price | $/sf | Match |
|---|---|---|---|---|---|---|---|
| 41316 Paign Dr | 0.25mi | 3/2.0 | 1,084 (-7%) | 4mo | $263,000 | $243 | 69 |
| 13498 Butler Dr | 0.12mi | 2/1.0 (-1) | 1,018 (-13%) | 4mo | $185,000 | $182 | 65 |
| 14178 Hillsdale Dr | 0.38mi | 3/1.0 | 1,142 (-2%) | 19mo | $263,000 | $230 | 63 |
| 41627 Saal Rd | 0.51mi | 3/1.5 | 1,204 (+3%) | 10mo | $275,000 | $228 | 60 |
| 41641 Saal Rd | 0.52mi | 3/1.0 | 1,204 (+3%) | 23mo | $255,000 | $212 | 52 |
| 14532 Debbie Dr | 0.66mi | 3/1.0 | 1,204 (+3%) | 18mo | $250,000 | $208 | 49 |
| 13104 Carnaby Ct | 0.65mi | 3/2.0 | 1,260 (+8%) | 7mo | $280,000 | $222 | 46 |
| 41718 Mae Wood Dr | 0.69mi | 3/1.0 | 1,317 (+13%) | 1mo | $324,900 | $247 | 46 |
| 41210 Paign Dr | 0.27mi | 3/1.5 | 1,334 (+14%) | 22mo | $260,000 | $195 | 43 |
Match score weights: distance 35% · size 25% · config 20% · recency 20%. Top-matched comps best support the ARV.
Projected returns pro-forma
-3.0% appreciation · 3.23% rent growth · sell at horizon
- IRR
- -26.8%
- Equity multiple
- 0.09×
- Total profit
- $-58,032
- Equity at exit
- $34,145
- IRR
- -23.4%
- Equity multiple
- -0.19×
- Total profit
- $-76,235
- Equity at exit
- $19,800
Cash invested: $64,120 (down + closing). Projections, not guarantees.
Landlord ↔ Tenant lean methodology
- Overall (STATE)
- 62 Landlord-Friendly
- State Michigan
- 62 Landlord-Friendly · EVEN
- County
- — inherits STATE
- City
- — inherits STATE
ZIP-level market 48313
- Rents YoY
- 3.2%
- Active inventory
- 113
- Price-to-rent
- 11.6×
Monthly cashflow live
- Estimated rent
- $1,645 high interval (Pro) →
- Mortgage (P&I)
- −$1,201
- Tax from tax record
- −$339 /mo · $4,066/yr
- Insurance
- −$95
- HOA
- −$0
- Vacancy / Maint / Mgmt
- −$346
- Net cashflow
- $-335
Break-even live
Sensitivity live
| Price | -10% $-206 | -5% $-271 | +0% $-335 | +5% $-400 | +10% $-465 |
|---|---|---|---|---|---|
| Rent | -10% $-465 | -5% $-400 | +0% $-335 | +5% $-270 | +10% $-205 |
| Rate | -1.0pp $-220 | -0.5pp $-277 | base $-335 | +0.5pp $-395 | +1.0pp $-455 |
UW: 25.0% down · 7.5% · 30yr · 1.5% tax · 5.0% vac · 8.0% maint · 8.0% mgmt
Financing live
Cash to close
- Down payment
- $57,250
- Closing costs
- $6,870
- Reserves months
- —
- Total cash needed
- —
Loan-product check · same deal, 3 products live
Conventional
25% down · 7.5% · 30yr
- Down + closing
- —
- Monthly P&I
- —
- Monthly cashflow
- —
- DSCR
- —
- Eligible?
- —
Personal DTI + credit; lowest rate.
DSCR
20% down · 8.5% · 30yr
- Down + closing
- —
- Monthly P&I
- —
- Monthly cashflow
- —
- DSCR
- —
- Eligible?
- —
No personal income docs; deal must DSCR.
Hard money
10% down · 12.0% · 12mo
- Down + closing
- —
- Monthly P&I
- —
- Monthly cashflow
- —
- DSCR
- —
- Eligible?
- —
Short-term bridge; refi at stabilization.
Rent comps 7 comps
| Address | Beds | Baths | Sqft | Rent | $/sqft | DOM | Units | Dist |
|---|---|---|---|---|---|---|---|---|
| 14520 Vauxhall Dr Sterling Heights, MI | 2.0 | 2.0 | 1244 | $2,000 | $1.61 | 0d | 1 | 0.98mi |
| 15010 Ashgrove Dr Sterling Heights, MI | 1.0–2.0 | 1.0–2.0 | 720 | $1,250 | $1.74 | 3d | 12 | 1.12mi |
| 42480 Green Valley Dr Clinton Twp, MI | 1.0–2.0 | 1.0 | 771 | $1,293 | $1.68 | 1d | 32 | 1.25mi |
| 13367 Forest Ridge Blvd #7 Sterling Heights, MI | 2.0 | 2.0 | 1250 | $1,700 | $1.36 | 45d | 1 | 1.25mi |
| 43237 Cape Dr Sterling Heights, MI | 2.0 | 2.0 | 1068 | $1,275 | $1.19 | 45d | 1 | 1.30mi |
| 15140 Seagull Dr Sterling Heights, MI | 2.0 | 1.5 | 1068 | $1,500 | $1.40 | 12d | 1 | 1.39mi |
| 15187 Olivewood Dr Sterling Heights, MI | 1.0–2.0 | 1.0–2.0 | 720 | $1,400 | $1.94 | 1d | 9 | 1.50mi |
Listing history 5 events
-
2026-05-22$229,000 Active
Show marketing remark (580 chars)
* * * BACK ON MARKET DUE TO BUYER FINANCING * * * Tucked away on a cul-de-sac in Sterling Heights, this charming ranch offers 3 bedrooms, 1 full bath, and endless potential to make it your own. Perfectly situated in Sterling Heights, this home provides the convenience of nearby parks, shopping, and dining, all within a well-maintained community. This home is located within the highly regarded Utica Community Schools district. A wonderful opportunity for buyers looking to add their personal touch and create the perfect place to call home. New Hot Water Tank - June 2026
-
2026-05-22$229,000 Active 493-char remark
Show marketing remark (580 chars)
* * * BACK ON MARKET DUE TO BUYER FINANCING * * * Tucked away on a cul-de-sac in Sterling Heights, this charming ranch offers 3 bedrooms, 1 full bath, and endless potential to make it your own. Perfectly situated in Sterling Heights, this home provides the convenience of nearby parks, shopping, and dining, all within a well-maintained community. This home is located within the highly regarded Utica Community Schools district. A wonderful opportunity for buyers looking to add their personal touch and create the perfect place to call home. New Hot Water Tank - June 2026
-
2000-04-05soldstatus $115,000
-
1993-03-10soldstatus $91,000
-
1989-06-14soldstatus $84,000
ⓘ Source: listings_history table (triggers on properties + properties_extension) + one-shot
backfill from property_details.listing_events for pre-trigger history.
Tax reassessment forecast MI · Partial reset (capped growth)
- Current annual tax
- $4,066 · $339/mo
- Projected year-2 tax
- $4,066 · $339/mo
- Expected delta
- $0/yr ($0/mo · 0.0%)
ⓘ Screening estimate from a state-policy table — verify with the county assessor before closing.
Climate risk First Street
- Flood 1/10 Low FEMA zone X (unshaded) · 0% chance over 30 yrs
- Wildfire 1/10 Low
- Heat 3/10 Moderate 7 d/yr ≥96°F today · 15 d/yr by 30 yrs out
- Wind 1/10 Low
- Air quality 3/10 Moderate 3 unhealthy d/yr today · 5 by 30 yrs out
Nearby sold comps map
Loading sold comps map…
Walkable amenities ~0.75 mi
Loading nearby amenities…
Taxation est. · year 1
- Rental income
- $19,743
- − Mortgage interest
- −$12,828
- − Property taxes
- −$4,066
- − Insurance
- −$1,145
- − Repairs & maintenance
- −$1,579
- − Management
- −$1,579
- − Depreciation
- −$6,662
- Taxable loss
- −$8,116
- Est. tax savings @ 24.0%
- +$1,948
- After-tax cash flow
- $-2,077/yr
For passive investors: Depreciation is non-cash, so a rental often shows a tax loss while cash-flowing — sheltering income. Rental losses are passive: they offset passive income freely, and up to $25,000/yr can offset ordinary (W-2) income if you actively participate and your MAGI is under $100k (phasing out to $0 by $150k); unused losses carry forward. On sale, claimed depreciation is recaptured at up to 25%, and gains may owe capital-gains tax (a 1031 exchange can defer both). Figures are a year-1 estimate at your 24.0% rate — not tax advice; consult a CPA.
Schools (NCES district)
- District
- Utica Community Schools
- NCES district ID
- 2634470
- Math proficiency
- 38% ▼ -13.00%
- Reading proficiency
- 53% ▼ -7.00%
- Median HH income
- $65,953
- Composite
- 40.52/100
- National rank
- #3709
- State rank
- #126 of 540 in MI
Livability — Sterling Heights
- Score
- 74/100
- State rank
- #173
- US rank
- #4545
Category grades
Schools grade is shown separately in the Schools card above.
Census & demographics
- Census place
- Sterling Heights, MI
- County
- Macomb County · 638,552 people
- City population
- 133,573
- Metro
- Detroit-Warren-Dearborn, MI
- Population (ZIP)
- 34,015
- Household income
- $88,065
- Rent vs Own
- Severe rent burden
- 1055.0
Population outlook (Macomb County) Hauer SSP2
- Today (2025)
- 925,296 people
- By 2030
- 948,226 · +2.5%
- By 2040
- 983,961 · +6.3%
- By 2050
- 1,010,200 · +9.2%
- By 2075
- 1,076,222 · +16.3%
- By 2100
- 1,077,065 · +16.4%
Race, ethnicity, and origin ACS 2023
- Neighborhood character
- Predominantly White (85%)
- Race & ethnicity
- White 85% Black 7% Two or more races 4% Asian 3% Hispanic / Latino 2%
- Common ancestry
- Romanian 14% Arab 3% Lithuanian 3%
- Foreign-born
- 17% · Canada
- Languages at home
- 80% English-only · Other Indo-European 6% Arabic 4% Russian/Polish/Slavic 2%
Political lean MEDSL · Macomb
- 2024 margin
- R (+13.7) · D 42.2% · R 55.9% · Other 1.9%
- 2008→2024 swing
- -22.3pp toward R · 2008: 8.6pp · 2024: -13.7pp
- All cycles
- 2024: R+13.7 2020: R+8.1 2016: R+11.6 2012: D+4.0 2008: D+8.6
Not yet ingested
- Civics
- —
Market trends
- HPI YoY
- ▼ -273.18%
- Current HPI
- 184.9033
- Rent YoY
- ▲ 3.23%
- Metro
- Detroit-Warren-Dearborn, MI
- State GDP YoY
- ▲ 1.37%
- F500 in state
- 28
Industry mix (Fortune 500 HQ in MI)
| Industry | F500 HQs | Revenue |
|---|---|---|
| Automotive Parts | 3 | $48B |
|
||
| Automotive | 2 | $372B |
|
||
| Chemicals | 1 | $45B |
|
||
| Automotive Retail | 1 | $29B |
|
||
| Healthcare / Medical Devices | 1 | $23B |
|
||
| Automotive Technology | 1 | $20B |
|
||
Price history
+172.6% since first listed11 events — show timeline
- 2026-06-22 Relisted — MiRealSource-MiMLS
- 2026-06-22 Relisted — REALCOMP
- 2026-05-28 Pending — MiRealSource-MiMLS
- 2026-05-28 Pending — REALCOMP
- 2026-05-27 Contingent — MiRealSource-MiMLS
- 2026-05-27 Contingent — REALCOMP
- 2026-05-22 Listed $229,000 REALCOMP
- 2026-05-22 Listed $229,000 MiRealSource-MiMLS
- 2000-04-05 Sold (Public Records) $115,000 Public Records
- 1993-03-10 Sold (Public Records) $91,000 Public Records
- 1989-06-14 Sold (Public Records) $84,000 Public Records
Property tax history
+3.6%/yrLatest (2025): $4,066 · -3.6% YoY. Source: county tax records.
Cash-flow waterfall
monthlySold comps — $/sqft
last 12 mo · ≤1 miLoading sold comps…