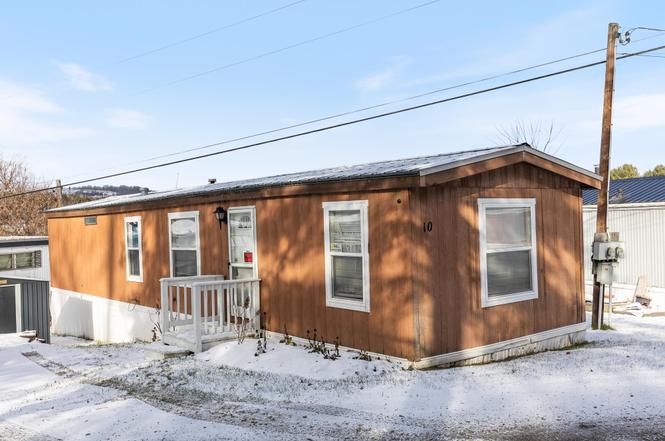
596 S Barre Rd #10 · South Barre, VT
Flood risk 1/10 · Minimal
- FEMA flood zone
- X (unshaded)
- Chance of flooding over 30 yrs
- 0.0%
- Est. flood insurance / yr
- $473 – $860
Fire risk 3/10 · Minor
- Est. fire insurance / yr
- $480 – $892
Heat risk 2/10 · Minimal
- Hot days now (above 89°F)
- 8 days/yr
- Hot days in 30 yrs
- 19 days/yr
Wind risk 2/10 · Minimal
- Chance of severe wind over 30 yrs
- 3.0%
Air-quality risk 2/10 · Minimal
- Unhealthy air days now
- 0 days/yr
- Unhealthy air days in 30 yrs
- 1 days/yr
Risk factors via First Street. Map © Google.
Why this score? — see what drove the B grade
The composite is a weighted blend of 9 inputs, each scored 0–100. Each bar is that input's sub-score; the figure is the points it added to the 100-point composite (weight × sub-score).
- Cash flow +29.4/30.0
- 1% rule +10.0/10.0
- DSCR +10.0/10.0
- ARV discount +7.5/15.0
- Schools +5.0/10.0
- Livability +3.2/5.0
- Rent growth +2.5/5.0
- Condition / age +2.5/5.0
- Appreciation +0.0/10.0
$64,900
🖨 Deal sheet 📄 Offer letter ✓ Due diligence
Listing remarks
This isn't just a mobile home, it's your ticket to easy living in one of Barre’s most well-kept communities. Step inside and instantly feel the calm: warm natural light, fresh paint, and a refreshing layout that makes the most of its 780+ sq ft. Whether you're sipping coffee in the sunny kitchen or unwinding in the living room, this home feels like yours from the start. Two bedrooms offer flexibility—perfect for a guest space, home office, or just room to stretch out. And the updates? All the practical stuff is done for you. Think: new exterior doors, newer windows, freshly painted metal roof, updated kitchen with painted cabinets and backsplash, plus a new range and newer appli
Key facts
- New exterior doors
- Painted cabinets
- Newer windows
Tags
Property features AI
Finance
- Other: Sale includes building only; Mobile make: Titan (serial number provided)
- HOA & community: Monthly park fee of 545 that includes park rent, sewer and water; Park name: Pleasant View (park approval: yes)
Exterior
- Parking: Gravel driveway
- Utilities: Public water; Public sewer; Circuit breaker electrical service; Fiber optic and high-speed internet available; Cable available (Spectrum); Oil delivered by local fuel company
- Home design: Manufactured home (Manuf/Mobile); Single-story; Brown exterior; Metal roof; Unit/Lot #10
- Construction: Built in 1989; T1-11 exterior siding; Manufactured home construction
- Exterior features: Leased lot in a rental mobile home park; Located in a neighborhood; Gravel driveway
Interior
- Kitchen: Range - Gas; Refrigerator; Exhaust hood; Dishwasher
- Bedrooms: Two bedrooms on the main level
- Flooring: Laminate
- Bathrooms: One full bathroom on the main level
- Heating & cooling: Oil-fired heating; Forced air / hot air
- Interior features: Four total rooms; Dirt basement
- Laundry & utility: Washer; Dryer; Owned tank water heater
Neighborhood map
What this means for you Summary
Snapshot
- This is a 2-bed/1.0-bath manufactured listed at $65k.
Deal economics
- At list price, monthly cash flow is $230 ($3k/yr) — positive.
- The deal already cash-flows at list — no discount required.
- Meets the 1% rule at list price ($1k rent vs $65k).
- Recommended offer: $57k (12.0% below list) — sets the bar for market timing.
Location & tenants
- Location reads 65/100 on livability (#55 in VT) — a middle-class / working-renter tenant base. Strengths: crime A+, housing A+, cost of living A-; Watch: health & safety D, amenities F, commute F.
- Zoned schools: Barre Town Elementary & Middle School (math 33% / reading 45%, grade F, #111 of 192 statewide, top 58%, 800 students, 19% FRL).
- Market conditions: 91 active listings in the ZIP; solid renter incomes; 185 units permitted in Washington County in 2024 (30 in 5+ unit buildings).
Forward outlook
- Local home prices are declining (-3.0%/yr); year-one equity from $449 of loan paydown is wiped out by about $2k of value loss. Plan a longer hold.
- Washington County population projected at -19% by 2050 — secular population decline; favor cash flow + early exit over multi-decade hold.
- At projected returns (-3.0% appreciation + 3.0% rent growth), your $18k cash investment doubles in ~8 years — after that, you're playing with house money.
Negotiation context
- It's been on market 155 days — a 12% lower offer ($57k) is reasonable based on typical stale-listing flexibility.
- 2 sale attempts; this cycle's ask has dropped $10k (13%) from the opening price — seller is motivated, your offer sets the floor, not the list.
- Current owner paid $40k; list at $65k implies a 62% gain — meaningful room to come down on a strong offer.
Risks & watch-outs
- Watch-outs: HOA is 37% of rent.
Questions for the listing agent
- It's been on market 155 days. Have you received any prior offers? Is the seller open to a 12% concession, seller financing, or rate buy-down credit?
- What does the HOA fee cover, when was the last increase, and are there any pending special assessments or reserve-fund shortfalls?
- Why hasn't it sold? Are there any deal-killer items the seller is aware of (foundation, flood, title, zoning, code violations)?
- Is there a deadline driving the sale (1031 exchange, divorce, estate, relocation)? That informs how much negotiation room exists.
- Schools are F-rated, which usually means shorter tenancies and higher turnover. Who's the typical renter profile here, and what's been the actual vacancy rate?
- What's the average days-on-market for RENTAL listings here right now (not sales)? A rising rental-DOM trend means longer vacancies and softer asking-rent achievability than the comps imply.
- What's the recent tenant-quality profile in this submarket — average credit score on applications, eviction rate, late-payment / NSF rate, and stable-employment percentage? A property-management company in the area should have these aggregated.
- How much new for-sale + rental construction is in the pipeline within 1–3 miles? Heavy new supply typically softens prices + rents 12–24 months out; constrained supply supports both.
Investment metrics
- 1% rule
- 2.28% ✓
- Cap rate
- 10.55%
- Cash-on-cash
- 15.19%
- DSCR
- 1.68
- GRM
- 3.7
CMA / ARV
- ARV (on-the-fly)
- $30,420
- Comps found
- 1
Show comp detail 1 sale within ~0.75 mi
| Address | Dist | Beds/Ba | Sqft | Sold | Price | $/sf | Match |
|---|---|---|---|---|---|---|---|
| 596 S Barre Rd #17 | 0.04mi | 2/1.0 | 728 (+8%) | 17mo | $32,500 | $45 | 71 |
Match score weights: distance 35% · size 25% · config 20% · recency 20%. Top-matched comps best support the ARV.
Projected returns pro-forma
-3.0% appreciation · 3.0% rent growth · sell at horizon
- IRR
- 6.3%
- Equity multiple
- 1.25×
- Total profit
- $4,456
- Equity at exit
- $9,677
- IRR
- 16.0%
- Equity multiple
- 2.32×
- Total profit
- $24,055
- Equity at exit
- $5,611
Cash invested: $18,172 (down + closing). Projections, not guarantees.
Landlord ↔ Tenant lean methodology
- Overall (STATE)
- 41 Moderately Tenant-Leaning
- State Vermont
- 41 Moderately Tenant-Leaning · D+15
- County
- — inherits STATE
- City
- — inherits STATE
ZIP-level market 05641
- Home prices YoY
- -19.7%
- Active inventory
- 91
- Price-to-rent
- 3.7×
Monthly cashflow live
- Estimated rent
- $1,477 medium interval (Pro) →
- Mortgage (P&I)
- −$340
- Tax from tax record
- −$25 /mo · $295/yr
- Insurance
- −$27
- HOA
- −$545
- Vacancy / Maint / Mgmt
- −$310
- Net cashflow
- $230
Break-even live
UW: 25.0% down · 7.5% · 30yr · 1.5% tax · 5.0% vac · 8.0% maint · 8.0% mgmt
Financing live
Cash to close
- Down payment
- $16,225
- Closing costs
- $1,947
- Reserves months
- —
- Total cash needed
- —
Loan-product check · same deal, 3 products live
Conventional
25% down · 7.5% · 30yr
- Down + closing
- —
- Monthly P&I
- —
- Monthly cashflow
- —
- DSCR
- —
- Eligible?
- —
Personal DTI + credit; lowest rate.
DSCR
20% down · 8.5% · 30yr
- Down + closing
- —
- Monthly P&I
- —
- Monthly cashflow
- —
- DSCR
- —
- Eligible?
- —
No personal income docs; deal must DSCR.
Hard money
10% down · 12.0% · 12mo
- Down + closing
- —
- Monthly P&I
- —
- Monthly cashflow
- —
- DSCR
- —
- Eligible?
- —
Short-term bridge; refi at stabilization.
HOA detail
- Monthly dues
- $545 · $6,540/yr
Listing history 25 events
-
2026-06-19days on market $64,900 Active 155 DOM
-
2026-06-18days on market $64,900 Active 154 DOM
-
2026-06-17days on market $64,900 Active 153 DOM
-
2026-06-16days on market $64,900 Active 152 DOM
-
2026-06-15days on market $64,900 Active 151 DOM
-
2026-06-14days on market $64,900 Active 149 DOM
-
2026-06-12days on market $64,900 Active 148 DOM
-
2026-06-09days on market $64,900 Active 145 DOM
-
2026-06-08days on market $64,900 Active 144 DOM
-
2026-06-07days on market $64,900 Active 143 DOM
-
2026-06-04days on market $64,900 Active 139 DOM
-
2026-06-02days on market $64,900 Active 138 DOM
-
2026-06-01days on market $64,900 Active 137 DOM
-
2026-05-31days on market $64,900 Active 136 DOM
-
2026-05-31days on market $64,900 Active 135 DOM
-
2026-05-20price $64,900
-
2026-03-30price $69,500
-
2026-03-30status Active
-
2026-02-17historical
-
2025-12-05$75,000 Active
-
2022-08-02soldstatus $40,000
-
2022-03-31soldstatus $18,450
-
2013-04-15soldstatus $39,900
-
2009-07-24soldstatus $13,900
-
2005-10-31soldstatus $19,900
ⓘ Source: listings_history table (triggers on properties + properties_extension) + one-shot
backfill from property_details.listing_events for pre-trigger history.
Tax reassessment forecast VT · Partial reset (capped growth)
- Current annual tax
- $295 · $25/mo
- Projected year-2 tax
- $764 · $64/mo
- Expected delta
- +$469/yr (+$39/mo · 158.8%)
ⓘ Screening estimate from a state-policy table — verify with the county assessor before closing.
Climate risk First Street
- Flood 1/10 Low FEMA zone X (unshaded) · 0% chance over 30 yrs
- Wildfire 3/10 Moderate
- Heat 2/10 Low 8 d/yr ≥89°F today · 19 d/yr by 30 yrs out
- Wind 2/10 Low 3% chance of damaging wind over 30 yrs
- Air quality 2/10 Low 0 unhealthy d/yr today · 1 by 30 yrs out
Nearby sold comps map
Loading sold comps map…
Walkable amenities ~0.75 mi
Loading nearby amenities…
Taxation est. · year 1
- Rental income
- $17,727
- − Mortgage interest
- −$3,635
- − Property taxes
- −$295
- − Insurance
- −$324
- − Repairs & maintenance
- −$1,418
- − Management
- −$1,418
- − HOA
- −$6,540
- − Depreciation
- −$1,888
- Taxable income
- $2,207
- Est. tax owed @ 24.0%
- −$530
- After-tax cash flow
- $2,231/yr
For passive investors: Depreciation is non-cash, so a rental often shows a tax loss while cash-flowing — sheltering income. Rental losses are passive: they offset passive income freely, and up to $25,000/yr can offset ordinary (W-2) income if you actively participate and your MAGI is under $100k (phasing out to $0 by $150k); unused losses carry forward. On sale, claimed depreciation is recaptured at up to 25%, and gains may owe capital-gains tax (a 1031 exchange can defer both). Figures are a year-1 estimate at your 24.0% rate — not tax advice; consult a CPA.
Schools (NCES district)
No district data.
Livability — South Barre
- Score
- 65/100
- State rank
- #55
- US rank
- #12485
Category grades
Schools grade is shown separately in the Schools card above.
Census & demographics
- Census place
- South Barre, VT
- County
- Washington County · 16,936 people
- City population
- 38
- Metro
- Barre, VT
- Population (ZIP)
- 16,936
- Household income
- $76,855
- Rent vs Own
- Severe rent burden
- 588.0
Population outlook (Washington County) Hauer SSP2
- Today (2025)
- 56,608 people
- By 2030
- 54,731 · -3.3%
- By 2040
- 50,227 · -11.3%
- By 2050
- 45,893 · -18.9%
- By 2075
- 36,818 · -35.0%
- By 2100
- 28,143 · -50.3%
Race, ethnicity, and origin ACS 2023
- Neighborhood character
- Predominantly White (92%)
- Race & ethnicity
- White 92% Hispanic / Latino 4% Two or more races 3% Black 1%
- Common ancestry
- Lithuanian 15% Slovak 7% Serbian 2%
- Foreign-born
- 2% · Canada
- Languages at home
- 97% English-only · French/Haitian/Cajun 1% Spanish 1% Russian/Polish/Slavic 1%
Political lean MEDSL · Washington
- 2024 margin
- Solid D (+43.4) · D 70.0% · R 26.6% · Other 3.4%
- 2008→2024 swing
- +2.4pp toward D · 2008: 41.0pp · 2024: 43.4pp
- All cycles
- 2024: D+43.4 2020: D+46.1 2016: D+37.0 2012: D+42.2 2008: D+41.0
Not yet ingested
- Civics
- —
Market trends
- HPI YoY
- ▼ -82.01%
- Current HPI
- 333.7046
- Rent YoY
- —
- Metro
- Barre, VT
- State GDP YoY
- —
- F500 in state
- 0
Price history
+226.1% since first listed10 events — show timeline
- 2026-05-20 Price Changed $64,900 PrimeMLS
- 2026-03-30 Price Changed $69,500 PrimeMLS
- 2026-03-30 Relisted — PrimeMLS
- 2026-02-17 Delisted — PrimeMLS
- 2025-12-05 Listed $75,000 PrimeMLS
- 2022-08-02 Sold (Public Records) $40,000 Public Records
- 2022-03-31 Sold (Public Records) $18,450 Public Records
- 2013-04-15 Sold (Public Records) $39,900 Public Records
- 2009-07-24 Sold (Public Records) $13,900 Public Records
- 2005-10-31 Sold (Public Records) $19,900 Public Records
Property tax history
-4.9%/yrLatest (2024): $295 · +10.3% YoY. Source: county tax records.
Cash-flow waterfall
monthlySold comps — $/sqft
last 12 mo · ≤1 miLoading sold comps…