4708 Hawk St · Inyokern, CA
Flood risk 1/10 · Minimal
- FEMA flood zone
- X (shaded)
- Chance of flooding over 30 yrs
- 0.0%
- Est. flood insurance / yr
- $473 – $860
Fire risk 2/10 · Minimal
- Est. fire insurance / yr
- $659 – $1,223
Heat risk 8/10 · Major
- Hot days now (above 105°F)
- 7 days/yr
- Hot days in 30 yrs
- 19 days/yr
Wind risk 1/10 · Minimal
- Chance of severe wind over 30 yrs
- —
Air-quality risk 5/10 · Moderate
- Unhealthy air days now
- 6 days/yr
- Unhealthy air days in 30 yrs
- 8 days/yr
Risk factors via First Street. Map © Google.
Why this score? — see what drove the D+ grade
The composite is a weighted blend of 9 inputs, each scored 0–100. Each bar is that input's sub-score; the figure is the points it added to the 100-point composite (weight × sub-score).
- Cash flow +16.9/30.0
- ARV discount +7.5/15.0
- Appreciation +6.8/10.0
- DSCR +5.3/10.0
- 1% rule +3.5/10.0
- Schools +2.9/10.0
- Rent growth +2.5/5.0
- Condition / age +2.5/5.0
- Livability +2.0/5.0
$140,000
🖨 Deal sheet 📄 Offer letter ✓ Due diligence
Listing remarks MLS
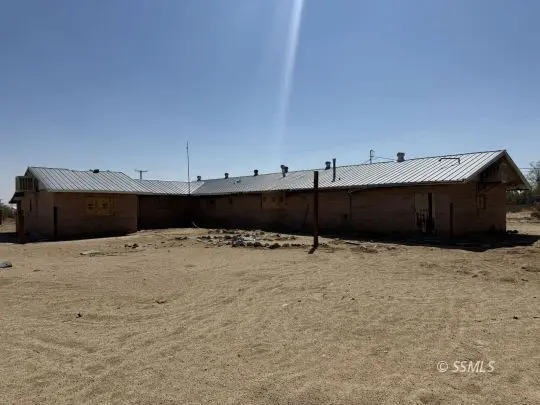
Fantastic Fixer Upper opportunity in North Inyokern! This property features a 2,662 square foot home with a full basement and 3-car garage. Exterior walls are block and it includes a standing seam metal roof. A fire unfortunately engulfed the interior, but the solid exterior block walls, basement, metal roof, and slab remain, providing a strong foundation for a complete renovation or custom build! This property resides on Five acres with picture perfect views of the Sierra Nevada Mountain Range! Private well on property but the water tank and pump are no longer present. Property has two evaporative coolers but operating condition is unknown. With some work, this property has the potential to become a beautiful desert retreat! Don't miss your chance to own five acres with a large structure already in place.
Key facts
- Private well
- Five acres
- Full basement
Tags
Neighborhood map
What this means for you Summary
Snapshot
- This is a 2-bed/2.0-bath single-family listed at $140k.
Deal economics
- At list price, monthly cash flow is $92 ($1k/yr) — positive.
- The deal already cash-flows at list — no discount required.
- To meet the 1% rule (rent ≥ 1% of price), the offer needs to be $119k (14.9% below list).
- Recommended offer: $119k (14.9% below list) — sets the bar for 1% rule.
Location & tenants
- Location reads 39/100 on livability (#1,398 in CA) — a limited-amenity area; tenant pool skews transient or value-seeking. Strengths: crime A, commute A-; Watch: schools C-, amenities F, employment F.
- Sierra Sands Unified (town): math 25% / reading 39% proficiency, ranked #294 of 517 in CA (top 57%) — families likely to look elsewhere, expect single-tenant / working-renter base with shorter leases.
- Market conditions: 93 active listings in the ZIP; 3,244 units permitted in Kern County in 2024 (73 in 5+ unit buildings).
Forward outlook
- In year one you build about $6k of equity ($968 loan paydown + $5k appreciation (3.6% local appreciation)).
- Kern County population projected at +17% by 2050 — long-run rental-demand tailwind backs the buy-and-hold thesis.
- At projected returns (3.6% appreciation + 3.0% rent growth), your $39k cash investment doubles in ~5 years — after that, you're playing with house money.
- By year 6, paydown + projected appreciation supports a ~$32k cash-out refi (75% LTV) — recoverable capital for the next deal without selling this one.
Negotiation context
- It's been on market 285 days — a 12% lower offer ($123k) is reasonable based on typical stale-listing flexibility.
- Current owner paid $75k; list at $140k implies a 87% gain — meaningful room to come down on a strong offer.
Risks & watch-outs
- Watch-outs: built in 1958 — expect roof / HVAC / electrical / plumbing capex.
- Climate carrying-cost: extreme-heat days projected 7→19/yr by 2055 (HVAC capex compounding) — expect insurance premiums to compound above CPI over the hold.
Questions for the listing agent
- It's been on market 285 days. Have you received any prior offers? Is the seller open to a 15% concession, seller financing, or rate buy-down credit?
- Built in 1958 — when were the roof, HVAC, electrical panel, plumbing, and water heater last replaced?
- Why hasn't it sold? Are there any deal-killer items the seller is aware of (foundation, flood, title, zoning, code violations)?
- Is there a deadline driving the sale (1031 exchange, divorce, estate, relocation)? That informs how much negotiation room exists.
- The area grade is low — what's the realistic commute time and amenity access for the typical tenant pool here? Any planned neighborhood developments (good or bad) we should know about?
- What's the average days-on-market for RENTAL listings here right now (not sales)? A rising rental-DOM trend means longer vacancies and softer asking-rent achievability than the comps imply.
- What's the recent tenant-quality profile in this submarket — average credit score on applications, eviction rate, late-payment / NSF rate, and stable-employment percentage? A property-management company in the area should have these aggregated.
- How much new for-sale + rental construction is in the pipeline within 1–3 miles? Heavy new supply typically softens prices + rents 12–24 months out; constrained supply supports both.
Investment metrics
- 1% rule
- 0.85% ✗
- Cap rate
- 7.08%
- Cash-on-cash
- 2.81%
- DSCR
- 1.13
- GRM
- 9.8
CMA / ARV
- ARV (median comp)
- $457,767
- List price
- $140,000
- Delta
- -69.42%
- Verdict
- UNDERPRICED
- Comps
- 2 within 1.0 mi
Show comp detail 1 sale within ~0.75 mi
| Address | Dist | Beds/Ba | Sqft | Sold | Price | $/sf | Match |
|---|---|---|---|---|---|---|---|
| 7626 Seibenthal Rd | 0.21mi | 3/2.0 (+1) | 2,445 (-8%) | 19mo | $570,000 | $233 | 56 |
Match score weights: distance 35% · size 25% · config 20% · recency 20%. Top-matched comps best support the ARV.
Projected returns pro-forma
3.63% appreciation · 3.0% rent growth · sell at horizon
- IRR
- 11.8%
- Equity multiple
- 1.70×
- Total profit
- $27,395
- Equity at exit
- $67,990
- IRR
- 13.5%
- Equity multiple
- 3.13×
- Total profit
- $83,564
- Equity at exit
- $108,880
Cash invested: $39,200 (down + closing). Projections, not guarantees.
Landlord ↔ Tenant lean methodology
- Overall (STATE)
- 18 Strongly Tenant-Friendly
- State California
- 18 Strongly Tenant-Friendly · D+13
- County
- — inherits STATE
- City
- — inherits STATE
ZIP-level market 93527
- Home prices YoY
- 0.7%
- Active inventory
- 93
- Price-to-rent
- 9.8×
Monthly cashflow live
- Estimated rent
- $1,191 medium interval (Pro) →
- Mortgage (P&I)
- −$734
- Tax from tax record
- −$57 /mo · $680/yr
- Insurance
- −$58
- HOA
- −$0
- Vacancy / Maint / Mgmt
- −$250
- Net cashflow
- $92
Break-even live
UW: 25.0% down · 7.5% · 30yr · 1.5% tax · 5.0% vac · 8.0% maint · 8.0% mgmt
Financing live
Cash to close
- Down payment
- $35,000
- Closing costs
- $4,200
- Reserves months
- —
- Total cash needed
- —
Loan-product check · same deal, 3 products live
Conventional
25% down · 7.5% · 30yr
- Down + closing
- —
- Monthly P&I
- —
- Monthly cashflow
- —
- DSCR
- —
- Eligible?
- —
Personal DTI + credit; lowest rate.
DSCR
20% down · 8.5% · 30yr
- Down + closing
- —
- Monthly P&I
- —
- Monthly cashflow
- —
- DSCR
- —
- Eligible?
- —
No personal income docs; deal must DSCR.
Hard money
10% down · 12.0% · 12mo
- Down + closing
- —
- Monthly P&I
- —
- Monthly cashflow
- —
- DSCR
- —
- Eligible?
- —
Short-term bridge; refi at stabilization.
Listing history 19 events
-
2026-06-18days on market $140,000 Active 285 DOM
-
2026-06-17days on market $140,000 Active 284 DOM
-
2026-06-16days on market $140,000 Active 283 DOM
-
2026-06-15days on market $140,000 Active 282 DOM
-
2026-06-14days on market $140,000 Active 280 DOM
-
2026-06-13days on market $140,000 Active 279 DOM
-
2026-06-10days on market $140,000 Active 277 DOM
-
2026-06-09days on market $140,000 Active 276 DOM
-
2026-06-08days on market $140,000 Active 275 DOM
-
2026-06-07days on market $140,000 Active 274 DOM
-
2026-06-05days on market $140,000 Active 271 DOM
-
2026-06-03days on market $140,000 Active 270 DOM
-
2026-06-03days on market $140,000 Active 269 DOM
-
2026-06-01days on market $140,000 Active 268 DOM
-
2026-05-31days on market $140,000 Active 267 DOM
-
2025-12-01price $140,000 818-char remark
Show marketing remark (818 chars)
Fantastic Fixer Upper opportunity in North Inyokern! This property features a 2,662 square foot home with a full basement and 3-car garage. Exterior walls are block and it includes a standing seam metal roof. A fire unfortunately engulfed the interior, but the solid exterior block walls, basement, metal roof, and slab remain, providing a strong foundation for a complete renovation or custom build! This property resides on Five acres with picture perfect views of the Sierra Nevada Mountain Range! Private well on property but the water tank and pump are no longer present. Property has two evaporative coolers but operating condition is unknown. With some work, this property has the potential to become a beautiful desert retreat! Don't miss your chance to own five acres with a large structure already in place.
-
2025-09-06$150,000 Active 818-char remark
Show marketing remark (818 chars)
Fantastic Fixer Upper opportunity in North Inyokern! This property features a 2,662 square foot home with a full basement and 3-car garage. Exterior walls are block and it includes a standing seam metal roof. A fire unfortunately engulfed the interior, but the solid exterior block walls, basement, metal roof, and slab remain, providing a strong foundation for a complete renovation or custom build! This property resides on Five acres with picture perfect views of the Sierra Nevada Mountain Range! Private well on property but the water tank and pump are no longer present. Property has two evaporative coolers but operating condition is unknown. With some work, this property has the potential to become a beautiful desert retreat! Don't miss your chance to own five acres with a large structure already in place.
-
1991-11-21soldstatus $75,000
-
1991-11-21soldstatus $75,000
ⓘ Source: listings_history table (triggers on properties + properties_extension) + one-shot
backfill from property_details.listing_events for pre-trigger history.
Tax reassessment forecast CA · Resets to sale price
- Current annual tax
- $680 · $57/mo
- Projected year-2 tax
- $1,064 · $89/mo
- Expected delta
- +$384/yr (+$32/mo · 56.5%)
ⓘ Screening estimate from a state-policy table — verify with the county assessor before closing.
Climate risk First Street
- Flood 1/10 Low FEMA zone X (shaded) · 0% chance over 30 yrs
- Wildfire 2/10 Low
- Heat 8/10 Severe 7 d/yr ≥105°F today · 19 d/yr by 30 yrs out
- Wind 1/10 Low
- Air quality 5/10 Major 6 unhealthy d/yr today · 8 by 30 yrs out
Nearby sold comps map
Loading sold comps map…
Walkable amenities ~0.75 mi
Loading nearby amenities…
Taxation est. · year 1
- Rental income
- $14,293
- − Mortgage interest
- −$7,842
- − Property taxes
- −$680
- − Insurance
- −$700
- − Repairs & maintenance
- −$1,143
- − Management
- −$1,143
- − Depreciation
- −$4,073
- Taxable loss
- −$1,289
- Est. tax savings @ 24.0%
- +$309
- After-tax cash flow
- $1,411/yr
For passive investors: Depreciation is non-cash, so a rental often shows a tax loss while cash-flowing — sheltering income. Rental losses are passive: they offset passive income freely, and up to $25,000/yr can offset ordinary (W-2) income if you actively participate and your MAGI is under $100k (phasing out to $0 by $150k); unused losses carry forward. On sale, claimed depreciation is recaptured at up to 25%, and gains may owe capital-gains tax (a 1031 exchange can defer both). Figures are a year-1 estimate at your 24.0% rate — not tax advice; consult a CPA.
Schools (NCES district)
- District
- Sierra Sands Unified
- NCES district ID
- 0636800
- Math proficiency
- 25% ▼ -11.00%
- Reading proficiency
- 39% ▼ -11.00%
- Median HH income
- $58,937
- Composite
- 28.66/100
- National rank
- #6699
- State rank
- #294 of 517 in CA
Livability — Inyokern
- Score
- 39/100
- State rank
- #1398
- US rank
- #27420
Category grades
Schools grade is shown separately in the Schools card above.
Census & demographics
- Population (ZIP)
- 1,801
Population outlook (Kern County) Hauer SSP2
- Today (2025)
- 947,286 people
- By 2030
- 978,984 · +3.3%
- By 2040
- 1,045,018 · +10.3%
- By 2050
- 1,105,232 · +16.7%
- By 2075
- 1,229,538 · +29.8%
- By 2100
- 1,238,059 · +30.7%
Race, ethnicity, and origin ACS 2023
- Neighborhood character
- Predominantly White (81%)
- Race & ethnicity
- White 81% Two or more races 11% Hispanic / Latino 9%
- Hispanic origin (detail)
- Mexican 8%
- Common ancestry
- Slovak 4% Scotch-Irish 3% Portuguese 3%
- Foreign-born
- 3% · Canada, China
- Languages at home
- 95% English-only · Spanish 2% German/W. Germanic 2% Chinese 1%
Political lean MEDSL · Kern
- 2024 margin
- Strong R (+21.1) · D 38.2% · R 59.3% · Other 2.5%
- 2008→2024 swing
- -3.3pp toward R · 2008: -17.8pp · 2024: -21.1pp
- All cycles
- 2024: R+21.1 2020: R+10.2 2016: R+15.0 2012: R+20.9 2008: R+17.8
Not yet ingested
- Civics
- —
Market trends
- HPI YoY
- ▲ 3.63%
- Current HPI
- 501.6357
- Rent YoY
- —
- Metro
- —
- State GDP YoY
- ▲ 3.21%
- F500 in state
- 116
Industry mix (Fortune 500 HQ in CA)
| Industry | F500 HQs | Revenue |
|---|---|---|
| Technology | 27 | $1,492B |
|
||
| Financial Services | 3 | $174B |
|
||
| Retail | 3 | $44B |
|
||
| Insurance | 3 | $26B |
|
||
| Media / Entertainment | 2 | $115B |
|
||
| Pharmaceuticals / Biotech | 2 | $62B |
|
||
Price history
+86.7% since first listed4 events — show timeline
- 2025-12-01 Price Changed $140,000 SSMLS
- 2025-09-06 Listed $150,000 SSMLS
- 1991-11-21 Sold (Public Records) $75,000 Public Records
- 1991-11-21 Sold (Public Records) $75,000 Public Records
Property tax history
-5.3%/yrLatest (2025): $680 · -57.8% YoY. Source: county tax records.
Cash-flow waterfall
monthlySold comps — $/sqft
last 12 mo · ≤1 miLoading sold comps…