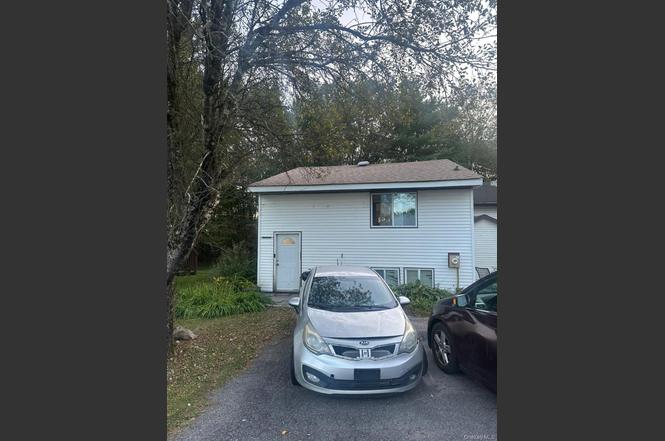
15 Medallion Rd · Kiamesha Lake, NY
Flood risk 1/10 · Minimal
- FEMA flood zone
- X (unshaded)
- Chance of flooding over 30 yrs
- 0.0%
- Est. flood insurance / yr
- $473 – $860
Fire risk 1/10 · Minimal
- Est. fire insurance / yr
- $691 – $1,283
Heat risk 2/10 · Minimal
- Hot days now (above 91°F)
- 7 days/yr
- Hot days in 30 yrs
- 15 days/yr
Wind risk 3/10 · Minor
- Chance of severe wind over 30 yrs
- 5.0%
Air-quality risk 2/10 · Minimal
- Unhealthy air days now
- 1 days/yr
- Unhealthy air days in 30 yrs
- 1 days/yr
Risk factors via First Street. Map © Google.
Why this score? — see what drove the C+ grade
The composite is a weighted blend of 9 inputs, each scored 0–100. Each bar is that input's sub-score; the figure is the points it added to the 100-point composite (weight × sub-score).
- Cash flow +17.5/30.0
- ARV discount +13.7/15.0
- Appreciation +9.3/10.0
- 1% rule +5.5/10.0
- DSCR +5.5/10.0
- Rent growth +2.5/5.0
- Schools +2.5/10.0
- Livability +2.5/5.0
- Condition / age +2.5/5.0
$179,999
🖨 Deal sheet 📄 Offer letter ✓ Due diligence
Listing remarks
Kiamishe Shores featuring this 4 bedroom lovely townhouse newly renovated in 2024.New deck , New roof. 1/2 acre. Private backyard. Call
Key facts
- Private backyard
- New deck
- New roof
Tags
Neighborhood map
What this means for you Summary
Snapshot
- This is a 3-bed/1.5-bath townhouse listed at $180k.
Deal economics
- At list price, monthly cash flow is $137 ($2k/yr) — positive.
- The deal already cash-flows at list — no discount required.
- Meets the 1% rule at list price ($2k rent vs $180k).
- Recommended offer: $158k (12.0% below list) — sets the bar for market timing.
Location & tenants
- Location reads: area grade C — affects rentability + tenant quality, not the cash-flow math above.
- Monticello Central School District (town): math 29% / reading 30% proficiency, ranked #577 of 590 in NY (top 98%) — low school quality limits family demand, transient renter base, plan for 1-2y turnover.
- Market conditions: 18 active listings in the ZIP; 4 comparable units currently listed for rent nearby; rentals at typical pace (median 19d on market — plan ~3-4 weeks tenant-placement turnaround); 739 units permitted in Sullivan County in 2024 (5 in 5+ unit buildings).
Forward outlook
- In year one you build about $17k of equity ($1k loan paydown + $16k appreciation (8.7% local appreciation)).
- Sullivan County population projected at -24% by 2050 — secular population decline; favor cash flow + early exit over multi-decade hold.
- At projected returns (8.7% appreciation + 3.0% rent growth), your $50k cash investment doubles in ~3 years — after that, you're playing with house money.
- By year 3, paydown + projected appreciation supports a ~$42k cash-out refi (75% LTV) — recoverable capital for the next deal without selling this one.
Negotiation context
- It's been on market 156 days — a 12% lower offer ($158k) is reasonable based on typical stale-listing flexibility.
- 4 sale attempts since 5y ago; this cycle's ask has dropped $70k (28%) from the opening price — seller is motivated, your offer sets the floor, not the list.
- Current owner paid $35k; list at $180k implies a 414% gain — meaningful room to come down on a strong offer.
Questions for the listing agent
- It's been on market 156 days. Have you received any prior offers? Is the seller open to a 12% concession, seller financing, or rate buy-down credit?
- Built in 1970 — when were the roof, HVAC, electrical panel, plumbing, and water heater last replaced?
- What does the HOA fee cover, when was the last increase, and are there any pending special assessments or reserve-fund shortfalls?
- Why hasn't it sold? Are there any deal-killer items the seller is aware of (foundation, flood, title, zoning, code violations)?
- Is there a deadline driving the sale (1031 exchange, divorce, estate, relocation)? That informs how much negotiation room exists.
- What's the average days-on-market for RENTAL listings here right now (not sales)? A rising rental-DOM trend means longer vacancies and softer asking-rent achievability than the comps imply.
- What's the recent tenant-quality profile in this submarket — average credit score on applications, eviction rate, late-payment / NSF rate, and stable-employment percentage? A property-management company in the area should have these aggregated.
- How much new for-sale + rental construction is in the pipeline within 1–3 miles? Heavy new supply typically softens prices + rents 12–24 months out; constrained supply supports both.
Investment metrics
- 1% rule
- 1.05% ✓
- Cap rate
- 7.21%
- Cash-on-cash
- 3.26%
- DSCR
- 1.15
- GRM
- 7.9
CMA / ARV
- ARV (on-the-fly)
- $208,512
- Comps found
- 8
Show comp detail 8 sales within ~0.75 mi
| Address | Dist | Beds/Ba | Sqft | Sold | Price | $/sf | Match |
|---|---|---|---|---|---|---|---|
| 5 Laura Ln | 0.05mi | 3/1.5 | 1,152 (0%) | 15mo | $160,000 | $139 | 86 |
| 35 Elizabeth Way Way | 0.31mi | 3/2.0 | 1,152 (0%) | 0mo | $170,000 | $148 | 83 |
| 22 James Pl | 0.09mi | 3/1.5 | 1,152 (0%) | 19mo | $214,900 | $187 | 80 |
| 33 Peter Way | 0.21mi | 3/1.5 | 1,152 (0%) | 12mo | $208,000 | $181 | 80 |
| 11 Peter Way | 0.19mi | 3/1.5 | 1,152 (0%) | 17mo | $185,000 | $161 | 78 |
| 22 Robert Rd | 0.27mi | 3/2.5 | 1,152 (0%) | 18mo | $229,900 | $200 | 68 |
| 13 Elizabeth Way | 0.35mi | 3/1.5 | 1,152 (0%) | 20mo | $220,000 | $191 | 67 |
| 58 Peter Way | 0.29mi | 3/2.0 | 1,152 (0%) | 24mo | $195,000 | $169 | 65 |
Match score weights: distance 35% · size 25% · config 20% · recency 20%. Top-matched comps best support the ARV.
Projected returns pro-forma
8.68% appreciation · 3.0% rent growth · sell at horizon
- IRR
- 24.0%
- Equity multiple
- 2.80×
- Total profit
- $90,948
- Equity at exit
- $145,235
- IRR
- 21.6%
- Equity multiple
- 6.12×
- Total profit
- $258,270
- Equity at exit
- $296,783
Cash invested: $50,400 (down + closing). Projections, not guarantees.
Landlord ↔ Tenant lean methodology
- Overall (STATE)
- 15 Strongly Tenant-Friendly
- State New York
- 15 Strongly Tenant-Friendly · D+10
- County
- — inherits STATE
- City
- — inherits STATE
ZIP-level market 12751
- Home prices YoY
- 2.2%
- Active inventory
- 18
- Price-to-rent
- 7.9×
Monthly cashflow live
- Estimated rent
- $1,896 medium interval (Pro) →
- Mortgage (P&I)
- −$944
- Tax from tax record
- −$192 /mo · $2,306/yr
- Insurance
- −$75
- HOA
- −$150
- Vacancy / Maint / Mgmt
- −$398
- Net cashflow
- $137
Break-even live
UW: 25.0% down · 7.5% · 30yr · 1.5% tax · 5.0% vac · 8.0% maint · 8.0% mgmt
Financing live
Cash to close
- Down payment
- $45,000
- Closing costs
- $5,400
- Reserves months
- —
- Total cash needed
- —
Loan-product check · same deal, 3 products live
Conventional
25% down · 7.5% · 30yr
- Down + closing
- —
- Monthly P&I
- —
- Monthly cashflow
- —
- DSCR
- —
- Eligible?
- —
Personal DTI + credit; lowest rate.
DSCR
20% down · 8.5% · 30yr
- Down + closing
- —
- Monthly P&I
- —
- Monthly cashflow
- —
- DSCR
- —
- Eligible?
- —
No personal income docs; deal must DSCR.
Hard money
10% down · 12.0% · 12mo
- Down + closing
- —
- Monthly P&I
- —
- Monthly cashflow
- —
- DSCR
- —
- Eligible?
- —
Short-term bridge; refi at stabilization.
Rent comps 4 comps
| Address | Beds | Baths | Sqft | Rent | $/sqft | DOM | Units | Dist |
|---|---|---|---|---|---|---|---|---|
| 52 Medallion Rd Kiamesha Lake, NY | 3.0 | 1.5 | 1440 | $1,950 | $1.35 | 19d | 1 | 0.16mi |
| 52 Medallion Rd Unit 1 Kiamesha Lake, NY | 3.0 | 1.5 | 1440 | $1,950 | $1.35 | 14d | 1 | 0.16mi |
| 42 Krier Ln Kiamesha Lake, NY | 2.0 | 1.5 | 1350 | $1,650 | $1.22 | 14d | 1 | 0.44mi |
| 41 Rock Ridge Ave Monticello, NY | 2.0 | 1.5 | 1200 | $1,800 | $1.50 | 19d | 1 | 1.43mi |
HOA detail
- Monthly dues
- $150 · $1,800/yr
Listing history 19 events
-
2026-02-18status Pending
-
2026-01-22price $179,999
-
2025-12-01price $199,999
-
2025-10-26price $215,999
-
2025-10-09price $224,999
-
2025-09-15$249,999 Active
-
2022-12-09historical
-
2022-10-14historical
-
2022-10-14status Active
-
2022-09-19status Pending
-
2022-09-14historical
-
2022-09-02$125,000 Active
-
2022-08-30historical
-
2022-01-27historical
-
2021-10-03price $119,998
-
2021-06-24$149,998 Active
-
2018-03-21soldstatus $35,000
-
2004-10-27soldstatus $75,000
-
1983-01-17soldstatus $25,000
ⓘ Source: listings_history table (triggers on properties + properties_extension) + one-shot
backfill from property_details.listing_events for pre-trigger history.
Tax reassessment forecast NY · Partial reset (capped growth)
- Current annual tax
- $2,306 · $192/mo
- Projected year-2 tax
- $2,674 · $223/mo
- Expected delta
- +$368/yr (+$31/mo · 16.0%)
ⓘ Screening estimate from a state-policy table — verify with the county assessor before closing.
Climate risk First Street
- Flood 1/10 Low FEMA zone X (unshaded) · 0% chance over 30 yrs
- Wildfire 1/10 Low
- Heat 2/10 Low 7 d/yr ≥91°F today · 15 d/yr by 30 yrs out
- Wind 3/10 Moderate 5% chance of damaging wind over 30 yrs
- Air quality 2/10 Low 1 unhealthy d/yr today · 1 by 30 yrs out
Nearby sold comps map
Loading sold comps map…
Walkable amenities ~0.75 mi
Loading nearby amenities…
Taxation est. · year 1
- Rental income
- $22,754
- − Mortgage interest
- −$10,083
- − Property taxes
- −$2,306
- − Insurance
- −$900
- − Repairs & maintenance
- −$1,820
- − Management
- −$1,820
- − HOA
- −$1,800
- − Depreciation
- −$5,236
- Taxable loss
- −$1,211
- Est. tax savings @ 24.0%
- +$291
- After-tax cash flow
- $1,934/yr
For passive investors: Depreciation is non-cash, so a rental often shows a tax loss while cash-flowing — sheltering income. Rental losses are passive: they offset passive income freely, and up to $25,000/yr can offset ordinary (W-2) income if you actively participate and your MAGI is under $100k (phasing out to $0 by $150k); unused losses carry forward. On sale, claimed depreciation is recaptured at up to 25%, and gains may owe capital-gains tax (a 1031 exchange can defer both). Figures are a year-1 estimate at your 24.0% rate — not tax advice; consult a CPA.
Schools (NCES district)
- District
- Monticello Central School District
- NCES district ID
- 3619740
- Math proficiency
- 29% ▼ -4.00%
- Reading proficiency
- 30% ▼ -2.00%
- Median HH income
- $44,696
- Composite
- 25.28/100
- National rank
- #7491
- State rank
- #577 of 590 in NY
Livability — Kiamesha Lake
No livability data for this city. (Only ~50 U.S. cities are tracked.)
Census & demographics
- Census place
- Kiamesha Lake, NY
- City population
- 1,340
- Population (ZIP)
- 1,340
Population outlook (Sullivan County) Hauer SSP2
- Today (2025)
- 68,974 people
- By 2030
- 65,609 · -4.9%
- By 2040
- 58,878 · -14.6%
- By 2050
- 52,500 · -23.9%
- By 2075
- 39,941 · -42.1%
- By 2100
- 28,880 · -58.1%
Race, ethnicity, and origin ACS 2023
- Neighborhood character
- Predominantly White (75%)
- Race & ethnicity
- White 75% Two or more races 13% Black 11% Hispanic / Latino 10%
- Hispanic origin (detail)
- Puerto Rican 8%
- Common ancestry
- Romanian 9% Danish 9% Estonian 8%
- Foreign-born
- 1%
- Languages at home
- 51% English-only · German/W. Germanic 43% Spanish 6%
Political lean MEDSL · Sullivan
- 2024 margin
- R (+16.7) · D 41.6% · R 58.4%
- 2008→2024 swing
- -26.2pp toward R · 2008: 9.5pp · 2024: -16.7pp
- All cycles
- 2024: R+16.7 2020: R+9.2 2016: R+13.7 2012: D+10.4 2008: D+9.5
Not yet ingested
- Civics
- —
Market trends
- HPI YoY
- ▲ 8.68%
- Current HPI
- 397.7278
- Rent YoY
- —
- Metro
- —
- State GDP YoY
- ▲ 2.60%
- F500 in state
- 92
Industry mix (Fortune 500 HQ in NY)
| Industry | F500 HQs | Revenue |
|---|---|---|
| Financial Services | 10 | $950B |
|
||
| Consumer Goods | 9 | $162B |
|
||
| Insurance | 4 | $225B |
|
||
| Telecommunications | 2 | $144B |
|
||
| Pharmaceuticals | 2 | $112B |
|
||
| Media / Entertainment | 2 | $69B |
|
||
Price history
+620.0% since first listed19 events — show timeline
- 2026-02-18 Pending — OneKey® MLS as Distributed by MLS Grid
- 2026-01-22 Price Changed $179,999 OneKey® MLS as Distributed by MLS Grid
- 2025-12-01 Price Changed $199,999 OneKey® MLS as Distributed by MLS Grid
- 2025-10-26 Price Changed $215,999 OneKey® MLS as Distributed by MLS Grid
- 2025-10-09 Price Changed $224,999 OneKey® MLS as Distributed by MLS Grid
- 2025-09-15 Listed $249,999 OneKey® MLS as Distributed by MLS Grid
- 2022-12-09 Rental Removed — ONEKEY
- 2022-10-14 Listing Removed — OneKey® MLS as Distributed by MLS Grid
- 2022-10-14 Relisted — OneKey® MLS as Distributed by MLS Grid
- 2022-09-19 Pending — OneKey® MLS as Distributed by MLS Grid
- 2022-09-14 Listing Removed — OneKey® MLS as Distributed by MLS Grid
- 2022-09-02 Listed $125,000 OneKey® MLS as Distributed by MLS Grid
- 2022-08-30 Coming Soon — OneKey® MLS as Distributed by MLS Grid
- 2022-01-27 Listing Removed — OneKey® MLS as Distributed by MLS Grid
- 2021-10-03 Price Changed $119,998 OneKey® MLS as Distributed by MLS Grid
- 2021-06-24 Listed $149,998 OneKey® MLS as Distributed by MLS Grid
- 2018-03-21 Sold (Public Records) $35,000 Public Records
- 2004-10-27 Sold (Public Records) $75,000 Public Records
- 1983-01-17 Sold (Public Records) $25,000 Public Records
Property tax history
-3.6%/yrLatest (2025): $2,306 · +2.1% YoY. Source: county tax records.
Cash-flow waterfall
monthlySold comps — $/sqft
last 12 mo · ≤1 miLoading sold comps…