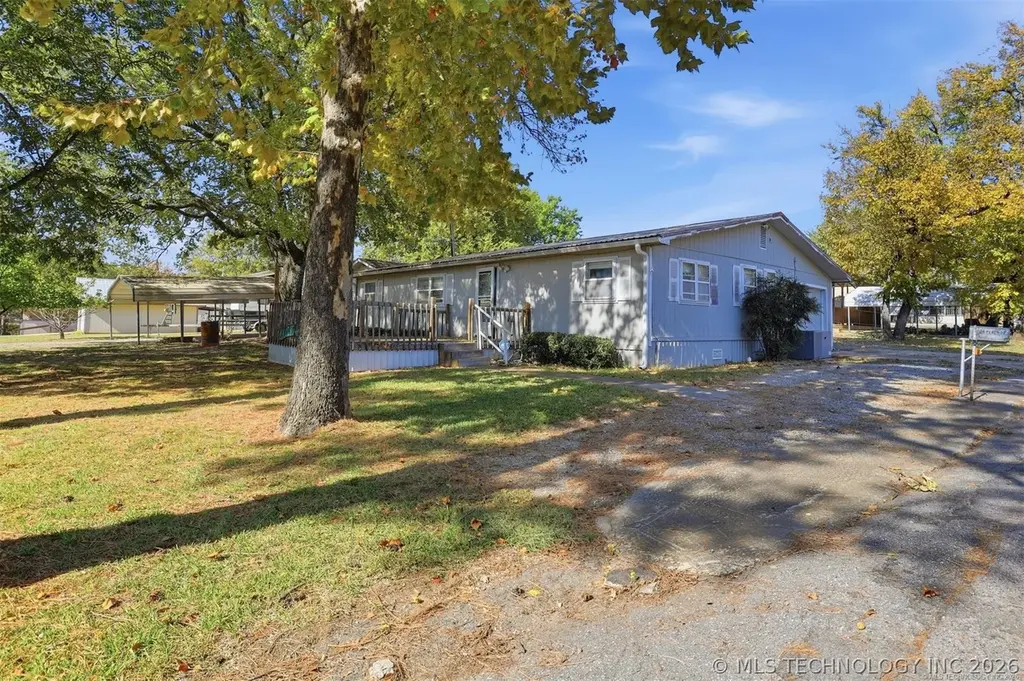
75 Perch · Sand Point, OK
Flood risk 1/10 · Minimal
- FEMA flood zone
- X (unshaded)
- Chance of flooding over 30 yrs
- 0.0%
- Est. flood insurance / yr
- $507 – $1,088
Fire risk 4/10 · Minor
- Est. fire insurance / yr
- $2,463 – $4,575
Heat risk 6/10 · Moderate
- Hot days now (above 110°F)
- 7 days/yr
- Hot days in 30 yrs
- 21 days/yr
Wind risk 4/10 · Minor
- Chance of severe wind over 30 yrs
- 16.0%
Air-quality risk 3/10 · Minor
- Unhealthy air days now
- 3 days/yr
- Unhealthy air days in 30 yrs
- 3 days/yr
Risk factors via First Street. Map © Google.
Why this score? — see what drove the C- grade
The composite is a weighted blend of 9 inputs, each scored 0–100. Each bar is that input's sub-score; the figure is the points it added to the 100-point composite (weight × sub-score).
- Cash flow +16.5/30.0
- Appreciation +10.0/10.0
- ARV discount +7.5/15.0
- DSCR +5.1/10.0
- 1% rule +3.4/10.0
- Rent growth +2.5/5.0
- Schools +2.5/10.0
- Livability +2.5/5.0
- Condition / age +2.5/5.0
$139,000
🖨 Deal sheet 📄 Offer letter ✓ Due diligence
Listing remarks
Just steps from Lake Texoma! Welcome to 75 Perch Lane in Mead, Oklahoma, a charming pier-and-beam home located less than a mile from the water and the beautiful Willow Springs Marina. Perfectly positioned for lake lovers, this property offers the ideal blend of comfort, convenience, and classic Texoma charm. Sitting on a corner lot, the home features 3 spacious bedrooms and 2 full bathrooms, with plenty of room for family, friends, or weekend guests. There’s no shortage of parking with three garage stalls plus two covered carports, perfect for storing your boat, golf cart, or lake toys. Inside, enjoy the fresh new flooring in the main living areas and a large utility room for added s
Key facts
- 0.23 acre lot
- 5 garage spots
- Built 1992
Property features AI
Finance
- HOA & community: Marina access nearby; Sidewalks; Gutter(s) maintained
Exterior
- Parking: Attached garage; Carport; Garage faces side; Second detached garage; 5 garage spaces
- Security: No safety shelter
- Utilities: Public water; Public sewer
- Home design: Single-story; Double-wide mobile home; Faces south; Entry on crawlspace
- Construction: Built according to public records; Vinyl siding with wood frame construction; Metal roof; Crawlspace foundation
- Exterior features: Dog run; Sprinkler/irrigation; Rain gutters; Patio; Chain-link fencing; Fruit trees; Less than 1 mile to Texoma Lake
Interior
- Kitchen: Electric oven connection
- Flooring: Carpet; Laminate
- Bathrooms: 2 full bathrooms
- Heating & cooling: Electric heating with multiple units; Two cooling units
- Interior features: Aluminum-framed windows; Laminate counters; Electric oven connection; Other interior features
- Laundry & utility: Electric water heater
Neighborhood map
What this means for you Summary
Snapshot
- This is a 3-bed/2.0-bath single-family listed at $139k.
Deal economics
- At list price, monthly cash flow is $81 ($974/yr) — positive.
- The deal already cash-flows at list — no discount required.
- To meet the 1% rule (rent ≥ 1% of price), the offer needs to be $117k (15.9% below list).
- Recommended offer: $117k (15.9% below list) — sets the bar for 1% rule.
Location & tenants
- Location reads: area grade C — affects rentability + tenant quality, not the cash-flow math above.
- Silo (rural): math 24% / reading 35% proficiency, ranked #64 of 270 in OK (top 24%) — low school quality limits family demand, transient renter base, plan for 1-2y turnover; 64% free/reduced lunch — lower-income household profile, screen leases tightly.
- Market conditions: 45 active listings in the ZIP; 176 units permitted in Bryan County in 2024 (80 in 5+ unit buildings).
Forward outlook
- In year one you build about $15k of equity ($961 loan paydown + $14k appreciation (10.0% local appreciation)).
- Bryan County population projected at +26% by 2050 — long-run rental-demand tailwind backs the buy-and-hold thesis.
- At projected returns (10.0% appreciation + 3.0% rent growth), your $39k cash investment doubles in ~3 years — after that, you're playing with house money.
- By year 3, paydown + projected appreciation supports a ~$38k cash-out refi (75% LTV) — recoverable capital for the next deal without selling this one.
Negotiation context
- Only 1 days on market — expect competitive offers; lowballing is unlikely to land.
- 3 sale attempts with the ask held roughly flat each time — persistent listings suggest the price (not the market) is what's stuck; bring a comps-based counter.
- Current owner paid $68k; list at $139k implies a 106% gain — meaningful room to come down on a strong offer.
Risks & watch-outs
- Climate carrying-cost: extreme-heat days projected 7→21/yr by 2055 (HVAC capex compounding) — expect insurance premiums to compound above CPI over the hold.
Questions for the listing agent
- Is there a deadline driving the sale (1031 exchange, divorce, estate, relocation)? That informs how much negotiation room exists.
- What's the average days-on-market for RENTAL listings here right now (not sales)? A rising rental-DOM trend means longer vacancies and softer asking-rent achievability than the comps imply.
- What's the recent tenant-quality profile in this submarket — average credit score on applications, eviction rate, late-payment / NSF rate, and stable-employment percentage? A property-management company in the area should have these aggregated.
- How much new for-sale + rental construction is in the pipeline within 1–3 miles? Heavy new supply typically softens prices + rents 12–24 months out; constrained supply supports both.
Investment metrics
- 1% rule
- 0.84% ✗
- Cap rate
- 6.99%
- Cash-on-cash
- 2.50%
- DSCR
- 1.11
- GRM
- 9.9
CMA / ARV
- ARV (on-the-fly)
- $288,864
- Comps found
- 1
Show comp detail 1 sale within ~0.75 mi
| Address | Dist | Beds/Ba | Sqft | Sold | Price | $/sf | Match |
|---|---|---|---|---|---|---|---|
| 401 Willow Springs Rd | 0.50mi | 2/2.0 (-1) | 1,575 (+11%) | 3mo | $322,000 | $204 | 51 |
Match score weights: distance 35% · size 25% · config 20% · recency 20%. Top-matched comps best support the ARV.
Projected returns pro-forma
10.0% appreciation · 3.0% rent growth · sell at horizon
- IRR
- 26.1%
- Equity multiple
- 3.08×
- Total profit
- $80,817
- Equity at exit
- $125,222
- IRR
- 22.9%
- Equity multiple
- 7.01×
- Total profit
- $233,820
- Equity at exit
- $270,046
Cash invested: $38,920 (down + closing). Projections, not guarantees.
Landlord ↔ Tenant lean methodology
- Overall (STATE)
- 83 Strongly Landlord-Friendly
- State Oklahoma
- 83 Strongly Landlord-Friendly · R+20
- County
- — inherits STATE
- City
- — inherits STATE
ZIP-level market 73449
- Home prices YoY
- 13.3%
- Active inventory
- 45
- Price-to-rent
- 9.9×
Monthly cashflow live
- Estimated rent
- $1,169 medium interval (Pro) →
- Mortgage (P&I)
- −$729
- Tax from tax record
- −$56 /mo · $668/yr
- Insurance
- −$58
- HOA
- −$0
- Vacancy / Maint / Mgmt
- −$246
- Net cashflow
- $81
Break-even live
UW: 25.0% down · 7.5% · 30yr · 1.5% tax · 5.0% vac · 8.0% maint · 8.0% mgmt
Financing live
Cash to close
- Down payment
- $34,750
- Closing costs
- $4,170
- Reserves months
- —
- Total cash needed
- —
Loan-product check · same deal, 3 products live
Conventional
25% down · 7.5% · 30yr
- Down + closing
- —
- Monthly P&I
- —
- Monthly cashflow
- —
- DSCR
- —
- Eligible?
- —
Personal DTI + credit; lowest rate.
DSCR
20% down · 8.5% · 30yr
- Down + closing
- —
- Monthly P&I
- —
- Monthly cashflow
- —
- DSCR
- —
- Eligible?
- —
No personal income docs; deal must DSCR.
Hard money
10% down · 12.0% · 12mo
- Down + closing
- —
- Monthly P&I
- —
- Monthly cashflow
- —
- DSCR
- —
- Eligible?
- —
Short-term bridge; refi at stabilization.
Listing history 14 events
-
2026-05-11status Pending
-
2026-05-11$139,000 Active
-
2026-05-09historical
-
2026-03-30price $139,000
-
2025-11-09$140,000 Active
-
2025-09-30status Pending
-
2025-09-30historical
-
2025-08-08price $149,000
-
2025-08-07price $155,000
-
2025-07-23price $160,000
-
2025-06-10price $165,000
-
2025-04-30$169,000 Active
-
2008-10-01soldstatus $67,500
-
2006-05-15soldstatus $57,500
ⓘ Source: listings_history table (triggers on properties + properties_extension) + one-shot
backfill from property_details.listing_events for pre-trigger history.
Tax reassessment forecast OK · Resets to sale price
- Current annual tax
- $668 · $56/mo
- Projected year-2 tax
- $1,251 · $104/mo
- Expected delta
- +$583/yr (+$49/mo · 87.3%)
ⓘ Screening estimate from a state-policy table — verify with the county assessor before closing.
Climate risk First Street
- Flood 1/10 Low FEMA zone X (unshaded) · 0% chance over 30 yrs
- Wildfire 4/10 Moderate
- Heat 6/10 Major 7 d/yr ≥110°F today · 21 d/yr by 30 yrs out
- Wind 4/10 Moderate 16% chance of damaging wind over 30 yrs
- Air quality 3/10 Moderate 3 unhealthy d/yr today · 3 by 30 yrs out
Nearby sold comps map
Loading sold comps map…
Walkable amenities ~0.75 mi
Loading nearby amenities…
Taxation est. · year 1
- Rental income
- $14,031
- − Mortgage interest
- −$7,786
- − Property taxes
- −$668
- − Insurance
- −$695
- − Repairs & maintenance
- −$1,122
- − Management
- −$1,122
- − Depreciation
- −$4,044
- Taxable loss
- −$1,407
- Est. tax savings @ 24.0%
- +$338
- After-tax cash flow
- $1,312/yr
For passive investors: Depreciation is non-cash, so a rental often shows a tax loss while cash-flowing — sheltering income. Rental losses are passive: they offset passive income freely, and up to $25,000/yr can offset ordinary (W-2) income if you actively participate and your MAGI is under $100k (phasing out to $0 by $150k); unused losses carry forward. On sale, claimed depreciation is recaptured at up to 25%, and gains may owe capital-gains tax (a 1031 exchange can defer both). Figures are a year-1 estimate at your 24.0% rate — not tax advice; consult a CPA.
Schools (NCES district)
- District
- Silo
- NCES district ID
- 4027640
- Math proficiency
- 24% ▼ -7.00%
- Reading proficiency
- 35% ▬ 0.00%
- Median HH income
- $46,297
- Composite
- 25.4/100
- National rank
- #7463
- State rank
- #64 of 270 in OK
Livability — Sand Point
No livability data for this city. (Only ~50 U.S. cities are tracked.)
Census & demographics
- Population (ZIP)
- 3,063
Population outlook (Bryan County) Hauer SSP2
- Today (2025)
- 50,265 people
- By 2030
- 52,866 · +5.2%
- By 2040
- 58,018 · +15.4%
- By 2050
- 63,073 · +25.5%
- By 2075
- 74,439 · +48.1%
- By 2100
- 81,743 · +62.6%
Race, ethnicity, and origin ACS 2023
- Neighborhood character
- Predominantly White (75%)
- Race & ethnicity
- White 75% Native American 12% Two or more races 11% Hispanic / Latino 5%
- Common ancestry
- Slovak 3% Lithuanian 2% Italian 1%
- Foreign-born
- 1% · Canada
- Languages at home
- 96% English-only · Spanish 3% Russian/Polish/Slavic 1%
Political lean MEDSL · Bryan
- 2024 margin
- Solid R (+58.5) · D 20.0% · R 78.6% · Other 1.4%
- 2008→2024 swing
- -23.0pp toward R · 2008: -35.5pp · 2024: -58.5pp
- All cycles
- 2024: R+58.5 2020: R+56.5 2016: R+55.6 2012: R+44.5 2008: R+35.5
Not yet ingested
- Civics
- —
Market trends
- HPI YoY
- ▲ 44.61%
- Current HPI
- 378.9559
- Rent YoY
- —
- Metro
- —
- State GDP YoY
- ▲ 1.55%
- F500 in state
- 6
Industry mix (Fortune 500 HQ in OK)
| Industry | F500 HQs | Revenue |
|---|---|---|
| Energy | 3 | $48B |
|
||
Price history
+141.7% since first listed14 events — show timeline
- 2026-05-11 Pending — MLS Technology, Inc.
- 2026-05-11 Listed $139,000 MLS Technology, Inc.
- 2026-05-09 Listing Removed — MLS Technology, Inc.
- 2026-03-30 Price Changed $139,000 MLS Technology, Inc.
- 2025-11-09 Listed $140,000 MLS Technology, Inc.
- 2025-09-30 Pending — MLS Technology, Inc.
- 2025-09-30 Listing Removed — MLS Technology, Inc.
- 2025-08-08 Price Changed $149,000 MLS Technology, Inc.
- 2025-08-07 Price Changed $155,000 MLS Technology, Inc.
- 2025-07-23 Price Changed $160,000 MLS Technology, Inc.
- 2025-06-10 Price Changed $165,000 MLS Technology, Inc.
- 2025-04-30 Listed $169,000 MLS Technology, Inc.
- 2008-10-01 Sold (Public Records) $67,500 Public Records
- 2006-05-15 Sold (Public Records) $57,500 Public Records
Property tax history
+4.4%/yrLatest (2025): $668 · +45.5% YoY. Source: county tax records.
Cash-flow waterfall
monthlySold comps — $/sqft
last 12 mo · ≤1 miLoading sold comps…