 25-Plex
4501 Columbus St · Bakersfield, CA
Flood risk 1/10 · Minimal
- FEMA flood zone
- X (unshaded)
- Chance of flooding over 30 yrs
- 0.0%
- Est. flood insurance / yr
- $507 – $1,088
Fire risk 7/10 · Major
- Est. fire insurance / yr
- $659 – $1,223
Heat risk 8/10 · Major
- Hot days now (above 105°F)
- 6 days/yr
- Hot days in 30 yrs
- 16 days/yr
Wind risk 1/10 · Minimal
- Chance of severe wind over 30 yrs
- —
Air-quality risk 10/10 · Severe
- Unhealthy air days now
- 34 days/yr
- Unhealthy air days in 30 yrs
- 40 days/yr
Risk factors via First Street. Map © Google.
Why this score? — see what drove the C+ grade
The composite is a weighted blend of 9 inputs, each scored 0–100. Each bar is that input's sub-score; the figure is the points it added to the 100-point composite (weight × sub-score).
- Cash flow +29.0/30.0
- DSCR +10.0/10.0
- 1% rule +7.4/10.0
- ARV discount +4.3/15.0
- Schools +3.4/10.0
- Rent growth +3.1/5.0
- Livability +2.9/5.0
- Condition / age +2.5/5.0
- Appreciation +0.0/10.0
$2,783,000
🖨 Deal sheet (PDF) 📄 Offer letter ✓ Due diligence
Multi-family units
County records classify this as Multi-Family (5+ Unit). Listing-text estimate: 25 units. confirmed
5+ unit building — per-unit beds/baths from public records are typically unavailable; the breakdown below (if shown) is an estimate from the listing text.
Listing remarks MLS
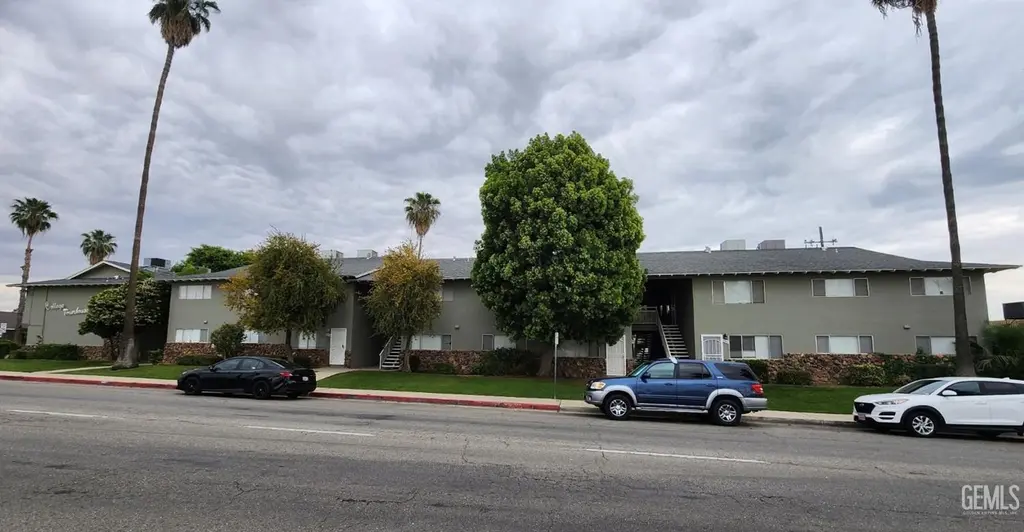
Situated in the desirable upper Northeast Bakersfield submarket, 4501 Columbus Street presents a rare opportunity to acquire a well-located 25-unit multifamily community offered at $2,783,000 ($111,320 per unit). Built between 1966-1967 and encompassing approximately 25,896 square feet, the property features a diverse unit mix including 7 spacious 2-bedroom/2.25-bath townhomes, 12 2-bedroom/2-bath units, 5 1-bedroom/1-bath units, and 1 large 3-bedroom/2-bath unit appealing to a broad tenant base. Recent capital improvements include a freshly painted exterior and a recently replaced (2) roofs, reducing near-term maintenance expenses. Current rents range from $829 to $1,400, providing investors with immediate upside through strategic rent increases and operational efficiencies. Ideally located near the scenic Panorama Bluffs, Bakersfield College, and the Bakersfield Country Club, the property benefits from strong rental demand and convenient access to local amenities.
Key facts
- 0.85 acre lot
- Garage
- Built 1967
Tags
Neighborhood map
What this means for you Summary
Snapshot
- This is a 7×2bd/2.25ba + 12×2bd/2ba + 5×1bd/1ba units multifamily listed at $2.78M.
Deal economics
- At list price, monthly cash flow is $10k ($114k/yr) — positive. Per door: $381/mo.
- The deal already cash-flows at list — no discount required.
- Meets the 1% rule at list price ($34k rent vs $2.78M).
- Recommended offer: $2.70M (3.0% below list) — sets the bar for market timing.
- Cap rate 10.4% vs local median 3.6% in Bakersfield — top-decile yield for the area; either an underpriced asset or a hidden risk that comps aren't pricing in. Stress-test before assuming the spread holds.
Location & tenants
- Location reads 58/100 on livability (#716 in CA) — a working-class tenant base; expect higher turnover. Strengths: housing A+; Watch: health & safety D, schools D-, crime F.
- Kern High (urban): math 21% / reading 51% proficiency, ranked #860 of 1,400 in CA (top 61%) — families likely to look elsewhere, expect single-tenant / working-renter base with shorter leases.
- Market conditions: Rents rising (+2.2%/yr); 387 active listings in the ZIP; 3,244 units permitted in Kern County in 2024 (73 in 5+ unit buildings).
- At $34,438/mo this rent would consume 592% of the median local household income ($70k/yr) (locally 2871% of renters already pay >50% of income on rent) — very limited rent-growth headroom before tenants either downsize or default.
Forward outlook
- Local home prices are declining (-3.0%/yr); year-one equity from $19k of loan paydown is wiped out by about $83k of value loss. Plan a longer hold.
- Kern County population projected at +17% by 2050 — long-run rental-demand tailwind backs the buy-and-hold thesis.
- At projected returns (-3.0% appreciation + 2.2% rent growth), your $779k cash investment doubles in ~9 years — after that, you're playing with house money.
Negotiation context
- It's been on market 36 days — a 3% lower offer ($2.70M) is reasonable based on typical stale-listing flexibility.
- 4 sale attempts since 32y ago with the ask held roughly flat each time — persistent listings suggest the price (not the market) is what's stuck; bring a comps-based counter.
- Current owner paid $755k; list at $2.78M implies a 269% gain — meaningful room to come down on a strong offer.
Risks & watch-outs
- Climate carrying-cost: major wildfire risk; extreme-heat days projected 6→16/yr by 2055 (HVAC capex compounding) — expect insurance premiums to compound above CPI over the hold.
Questions for the listing agent
- It's been on market 36 days. Have you received any prior offers? Is the seller open to a 3% concession, seller financing, or rate buy-down credit?
- Can we see the unit-by-unit rent roll, current vacancy, and any below-market leases? What's the average tenancy length?
- What capital expenditures (roof, boiler, parking lot, exteriors) have been made in the last 5 years, and what's planned in the next 2?
- Built in 1967 — when were the roof, HVAC, electrical panel, plumbing, and water heater last replaced?
- Is there a deadline driving the sale (1031 exchange, divorce, estate, relocation)? That informs how much negotiation room exists.
- Schools are D-rated, which usually means shorter tenancies and higher turnover. Who's the typical renter profile here, and what's been the actual vacancy rate?
- Crime grade is F in this area — have there been break-ins, vandalism, or insurance claims at this property in the last 3 years? What carrier currently insures it and at what premium?
- What's the average days-on-market for RENTAL listings here right now (not sales)? A rising rental-DOM trend means longer vacancies and softer asking-rent achievability than the comps imply.
- What's the recent tenant-quality profile in this submarket — average credit score on applications, eviction rate, late-payment / NSF rate, and stable-employment percentage? A property-management company in the area should have these aggregated.
- How much new apartment / multifamily construction is in the pipeline within 1–3 miles? Heavy new supply (>2% of stock underway) typically softens rents 12–24 months out; light construction supports rent growth.
Investment metrics
- 1% rule
- 1.24% ✓
- Cap rate
- 10.40%
- Cash-on-cash
- 14.67%
- DSCR
- 1.65
- GRM
- 6.7
CMA / ARV
- ARV (median comp)
- $2,597,233
- List price
- $2,783,000
- Delta
- 7.15%
- Verdict
- FAIR
- Comps
- 1 within 2.0 mi
Projected returns pro-forma
-3.0% appreciation · 2.24% rent growth · sell at horizon
- IRR
- 4.3%
- Equity multiple
- 1.17×
- Total profit
- $129,221
- Equity at exit
- $414,954
- IRR
- 13.1%
- Equity multiple
- 2.01×
- Total profit
- $786,433
- Equity at exit
- $240,623
Cash invested: $779,240 (down + closing). Projections, not guarantees.
Landlord ↔ Tenant lean methodology
- Overall (STATE)
- 18 Strongly Tenant-Friendly
- State California
- 18 Strongly Tenant-Friendly · D+13
- County
- — inherits STATE
- City
- — inherits STATE
ZIP-level market 93306
- Rents YoY
- 2.2%
- Active inventory
- 387
- Price-to-rent
- 165.6×
Monthly cashflow live
- Estimated rent
- $34,438 medium interval (Pro) →
- Mortgage (P&I)
- −$14,594
- Tax from tax record
- −$1,925 /mo · $23,105/yr
- Insurance
- −$1,160
- HOA
- −$0
- Vacancy / Maint / Mgmt
- −$7,232
- Net cashflow
- $9,527
Break-even live
Sensitivity live
| Price | -10% $11,102 | -5% $10,314 | +0% $9,527 | +5% $8,739 | +10% $7,951 |
|---|---|---|---|---|---|
| Rent | -10% $6,806 | -5% $8,166 | +0% $9,527 | +5% $10,887 | +10% $12,247 |
| Rate | -1.0pp $10,928 | -0.5pp $10,235 | base $9,527 | +0.5pp $8,806 | +1.0pp $8,072 |
25-unit breakdown (identical units grouped — click to expand)
| Units | Beds | Baths | Est. rent |
|---|---|---|---|
| 7× units | 2 | 2.25 | $9,800 |
| #1 | 2 | 2.25 | $1,400 |
| #2 | 2 | 2.25 | $1,400 |
| #3 | 2 | 2.25 | $1,400 |
| #4 | 2 | 2.25 | $1,400 |
| #5 | 2 | 2.25 | $1,400 |
| #6 | 2 | 2.25 | $1,400 |
| #7 | 2 | 2.25 | $1,400 |
| 12× units | 2 | 2 | $16,800 |
| #8 | 2 | 2 | $1,400 |
| #9 | 2 | 2 | $1,400 |
| #10 | 2 | 2 | $1,400 |
| #11 | 2 | 2 | $1,400 |
| #12 | 2 | 2 | $1,400 |
| #13 | 2 | 2 | $1,400 |
| #14 | 2 | 2 | $1,400 |
| #15 | 2 | 2 | $1,400 |
| #16 | 2 | 2 | $1,400 |
| #17 | 2 | 2 | $1,400 |
| #18 | 2 | 2 | $1,400 |
| #19 | 2 | 2 | $1,400 |
| 5× units | 1 | 1 | $6,140 |
| #20 | 1 | 1 | $1,228 |
| #21 | 1 | 1 | $1,228 |
| #22 | 1 | 1 | $1,228 |
| #23 | 1 | 1 | $1,228 |
| #24 | 1 | 1 | $1,228 |
| 1× unit | 3 | 2 | $1,696 |
| Total (25 units) | $34,438 | ||
UW: 25.0% down · 7.5% · 30yr · 1.5% tax · 5.0% vac · 8.0% maint · 8.0% mgmt
Financing live
Cash to close
- Down payment
- $695,750
- Closing costs
- $83,490
- Reserves months
- —
- Total cash needed
- —
Loan-product check · same deal, 3 products live
Conventional
25% down · 7.5% · 30yr
- Down + closing
- —
- Monthly P&I
- —
- Monthly cashflow
- —
- DSCR
- —
- Eligible?
- —
Personal DTI + credit; lowest rate.
DSCR
20% down · 8.5% · 30yr
- Down + closing
- —
- Monthly P&I
- —
- Monthly cashflow
- —
- DSCR
- —
- Eligible?
- —
No personal income docs; deal must DSCR.
Hard money
10% down · 12.0% · 12mo
- Down + closing
- —
- Monthly P&I
- —
- Monthly cashflow
- —
- DSCR
- —
- Eligible?
- —
Short-term bridge; refi at stabilization.
Listing history 23 events
-
2026-06-14statusdays on market $2,783,000 Pending 36 DOM
-
2026-06-10days on market $2,783,000 Active - Contingent 34 DOM
-
2026-06-09days on market $2,783,000 Active - Contingent 33 DOM
-
2026-06-08days on market $2,783,000 Active - Contingent 32 DOM
-
2026-06-07days on market $2,783,000 Active - Contingent 31 DOM
-
2026-06-05days on market $2,783,000 Active - Contingent 28 DOM
-
2026-06-03days on market $2,783,000 Active - Contingent 27 DOM
-
2026-06-03days on market $2,783,000 Active - Contingent 26 DOM
-
2026-06-01days on market $2,783,000 Active - Contingent 25 DOM
-
2026-05-31days on market $2,783,000 Active - Contingent 24 DOM
-
2026-05-14historical Active - Contingent 980-char remark
Show marketing remark (980 chars)
Situated in the desirable upper Northeast Bakersfield submarket, 4501 Columbus Street presents a rare opportunity to acquire a well-located 25-unit multifamily community offered at $2,783,000 ($111,320 per unit). Built between 1966-1967 and encompassing approximately 25,896 square feet, the property features a diverse unit mix including 7 spacious 2-bedroom/2.25-bath townhomes, 12 2-bedroom/2-bath units, 5 1-bedroom/1-bath units, and 1 large 3-bedroom/2-bath unit appealing to a broad tenant base. Recent capital improvements include a freshly painted exterior and a recently replaced (2) roofs, reducing near-term maintenance expenses. Current rents range from $829 to $1,400, providing investors with immediate upside through strategic rent increases and operational efficiencies. Ideally located near the scenic Panorama Bluffs, Bakersfield College, and the Bakersfield Country Club, the property benefits from strong rental demand and convenient access to local amenities.
-
2026-05-06$2,783,000 Active 980-char remark
Show marketing remark (980 chars)
Situated in the desirable upper Northeast Bakersfield submarket, 4501 Columbus Street presents a rare opportunity to acquire a well-located 25-unit multifamily community offered at $2,783,000 ($111,320 per unit). Built between 1966-1967 and encompassing approximately 25,896 square feet, the property features a diverse unit mix including 7 spacious 2-bedroom/2.25-bath townhomes, 12 2-bedroom/2-bath units, 5 1-bedroom/1-bath units, and 1 large 3-bedroom/2-bath unit appealing to a broad tenant base. Recent capital improvements include a freshly painted exterior and a recently replaced (2) roofs, reducing near-term maintenance expenses. Current rents range from $829 to $1,400, providing investors with immediate upside through strategic rent increases and operational efficiencies. Ideally located near the scenic Panorama Bluffs, Bakersfield College, and the Bakersfield Country Club, the property benefits from strong rental demand and convenient access to local amenities.
-
2026-02-13historical $1,050
-
2026-01-08$1,050
-
2024-06-08historical $1,495
-
2024-04-24$1,495
-
2022-08-01price $1,300
-
1994-08-18soldstatus $755,000 109-char remark
Show marketing remark (109 chars)
Make Offer Subj To Insp. Great Units In Ne Area. Priced At Onl6.5+gross. `college Townhouses`. Co-lister Bob.
-
1994-08-18soldstatus $755,000
Show marketing remark (109 chars)
Make Offer Subj To Insp. Great Units In Ne Area. Priced At Onl6.5+gross. `college Townhouses`. Co-lister Bob.
-
1994-04-29historical 109-char remark
Show marketing remark (109 chars)
Make Offer Subj To Insp. Great Units In Ne Area. Priced At Onl6.5+gross. `college Townhouses`. Co-lister Bob.
-
1994-04-29price $870,000 109-char remark
Show marketing remark (109 chars)
Make Offer Subj To Insp. Great Units In Ne Area. Priced At Onl6.5+gross. `college Townhouses`. Co-lister Bob.
-
1994-04-18$755,000 109-char remark
Show marketing remark (109 chars)
Make Offer Subj To Insp. Great Units In Ne Area. Priced At Onl6.5+gross. `college Townhouses`. Co-lister Bob.
-
1993-03-26soldstatus $650,000
ⓘ Source: listings_history table (triggers on properties + properties_extension) + one-shot
backfill from property_details.listing_events for pre-trigger history.
Tax reassessment forecast CA · Resets to sale price
- Current annual tax
- $23,105 · $1,925/mo
- Projected year-2 tax
- $23,105 · $1,925/mo
- Expected delta
- $0/yr ($0/mo · 0.0%)
ⓘ Screening estimate from a state-policy table — verify with the county assessor before closing.
Climate risk First Street
- Flood 1/10 Low FEMA zone X (unshaded) · 0% chance over 30 yrs
- Wildfire 7/10 Severe
- Heat 8/10 Severe 6 d/yr ≥105°F today · 16 d/yr by 30 yrs out
- Wind 1/10 Low
- Air quality 10/10 Extreme 34 unhealthy d/yr today · 40 by 30 yrs out
Nearby sold comps map
Loading sold comps map…
Walkable amenities ~0.75 mi
Loading nearby amenities…
Taxation est. · year 1
- Rental income
- $413,256
- − Mortgage interest
- −$155,891
- − Property taxes
- −$23,105
- − Insurance
- −$13,915
- − Repairs & maintenance
- −$33,060
- − Management
- −$33,060
- − Depreciation
- −$80,960
- Taxable income
- $73,264
- Est. tax owed @ 24.0%
- −$17,583
- After-tax cash flow
- $96,737/yr
For passive investors: Depreciation is non-cash, so a rental often shows a tax loss while cash-flowing — sheltering income. Rental losses are passive: they offset passive income freely, and up to $25,000/yr can offset ordinary (W-2) income if you actively participate and your MAGI is under $100k (phasing out to $0 by $150k); unused losses carry forward. On sale, claimed depreciation is recaptured at up to 25%, and gains may owe capital-gains tax (a 1031 exchange can defer both). Figures are a year-1 estimate at your 24.0% rate — not tax advice; consult a CPA.
Schools (NCES district)
- District
- Kern High
- NCES district ID
- 0619540
- Math proficiency
- 21% ▬ 0.00%
- Reading proficiency
- 51% ▲ 2.00%
- Median HH income
- $49,686
- Composite
- 33.68/100
- National rank
- #10443
- State rank
- #860 of 1400 in CA
Livability — Bakersfield
- Score
- 58/100
- State rank
- #716
- US rank
- #21355
Category grades
Schools grade is shown separately in the Schools card above.
Census & demographics
- Census place
- Bakersfield, CA
- County
- Kern County · 710,371 people
- City population
- 499,124
- Metro
- Bakersfield, CA
- Population (ZIP)
- 74,116
- Household income
- $69,805
- Rent vs Own
- Severe rent burden
- 2871.0
Population outlook (Kern County) Hauer SSP2
- Today (2025)
- 947,286 people
- By 2030
- 978,984 · +3.3%
- By 2040
- 1,045,018 · +10.3%
- By 2050
- 1,105,232 · +16.7%
- By 2075
- 1,229,538 · +29.8%
- By 2100
- 1,238,059 · +30.7%
Race, ethnicity, and origin ACS 2023
- Neighborhood character
- Predominantly Hispanic (67%)
- Race & ethnicity
- Hispanic / Latino 67% White 23% Two or more races 20% Black 3% Asian 2% Native American 1%
- Hispanic origin (detail)
- Mexican 63%
- Common ancestry
- Italian 2% Slovak 1% Russian 1%
- Foreign-born
- 19% · Canada
- Languages at home
- 50% English-only · Spanish 46% Other Asian/Pacific 1% Arabic 1%
Political lean MEDSL · Kern
- 2024 margin
- Strong R (+21.1) · D 38.2% · R 59.3% · Other 2.5%
- 2008→2024 swing
- -3.3pp toward R · 2008: -17.8pp · 2024: -21.1pp
- All cycles
- 2024: R+21.1 2020: R+10.2 2016: R+15.0 2012: R+20.9 2008: R+17.8
Not yet ingested
- Civics
- —
Market trends
- HPI YoY
- ▼ -323.02%
- Current HPI
- 358.5434
- Rent YoY
- ▲ 2.24%
- Metro
- Bakersfield, CA
- State GDP YoY
- ▲ 3.21%
- F500 in state
- 116
Industry mix (Fortune 500 HQ in CA)
| Industry | F500 HQs | Revenue |
|---|---|---|
| Technology | 27 | $1,492B |
|
||
| Financial Services | 3 | $174B |
|
||
| Retail | 3 | $44B |
|
||
| Insurance | 3 | $26B |
|
||
| Media / Entertainment | 2 | $115B |
|
||
| Pharmaceuticals / Biotech | 2 | $62B |
|
||
Price history
+328.2% since first listed13 events — show timeline
- 2026-05-14 Contingent — GEMLS
- 2026-05-06 Listed $2,783,000 GEMLS
- 2026-02-13 Rental Removed $1,050 APPFOLIO
- 2026-01-08 Listed for Rent $1,050 APPFOLIO
- 2024-06-08 Rental Removed $1,495 APPFOLIO
- 2024-04-24 Listed for Rent $1,495 APPFOLIO
- 2022-08-01 Price Changed $1,300 RENT.
- 1994-08-18 Sold (Public Records) $755,000 Public Records
- 1994-08-18 Sold (MLS) $755,000 GEMLS
- 1994-04-29 Price Changed $870,000 GEMLS
- 1994-04-29 Delisted — GEMLS
- 1994-04-18 Listed $755,000 GEMLS
- 1993-03-26 Sold (Public Records) $650,000 Public Records
Property tax history
+2.8%/yrLatest (2025): $23,105 · +1.7% YoY. Source: county tax records.
Cash-flow waterfall
monthlySold comps — $/sqft
last 12 mo · ≤1 miLoading sold comps…