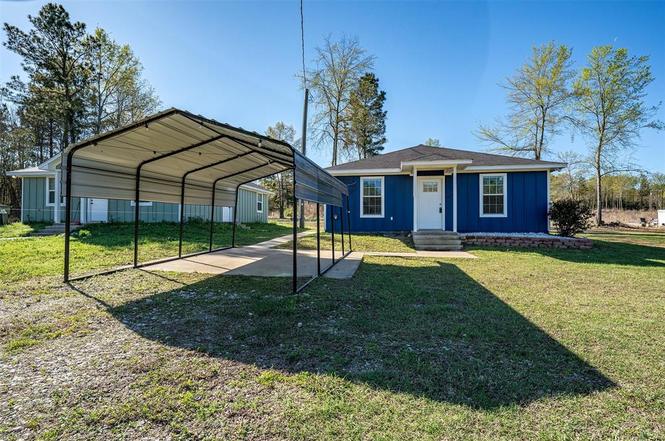
10670 Seven Hills Rd · Tyler, TX
Flood risk 1/10 · Minimal
- FEMA flood zone
- X (unshaded)
- Chance of flooding over 30 yrs
- 0.0%
- Est. flood insurance / yr
- $507 – $1,088
Fire risk 5/10 · Moderate
- Est. fire insurance / yr
- $1,222 – $2,270
Heat risk 6/10 · Moderate
- Hot days now (above 109°F)
- 7 days/yr
- Hot days in 30 yrs
- 23 days/yr
Wind risk 6/10 · Moderate
- Chance of severe wind over 30 yrs
- 60.0%
Air-quality risk 2/10 · Minimal
- Unhealthy air days now
- 0 days/yr
- Unhealthy air days in 30 yrs
- 1 days/yr
Risk factors via First Street. Map © Google.
Why this score? — see what drove the D- grade
The composite is a weighted blend of 9 inputs, each scored 0–100. Each bar is that input's sub-score; the figure is the points it added to the 100-point composite (weight × sub-score).
- Cash flow +7.7/30.0
- ARV discount +7.5/15.0
- Appreciation +7.5/10.0
- Livability +3.8/5.0
- Rent growth +2.5/5.0
- Schools +2.5/10.0
- Condition / age +2.5/5.0
- 1% rule +2.0/10.0
- DSCR +1.8/10.0
$205,000
🖨 Deal sheet 📄 Offer letter ✓ Due diligence
Listing remarks
Are you looking for an affordable home and wanting to get away from the hussle and bussle of the city life. This is the one!! Welcome to 10670 Seven Hills Rd in Tyler, Texas — a charming one-owner home nestled on a full acre of peaceful East Texas countryside. This well-maintained 3-bedroom, 2-bath residence offers a comfortable and functional layout designed for everyday living. Step inside to an inviting open-concept living room and kitchen, creating the perfect space for gathering with family and friends. The kitchen is equipped with a well maintained stove, microwave, and dishwasher. The on trend white cabinet and ceramic flooring compliements well with each other. You will not fi
Key facts
- Ceramic flooring
- Natural light
- Full acre
Tags
Property features AI
Finance
- Other: Possession: 30–60 days or at closing/funding; Listing terms: Exclusive Right To Sell; Special listing conditions: Standard; Refrigerator excluded from sale
- Financial info: Financing available: Cash, Conventional, FHA, USDA Loan, VA Loan
- HOA & community: No homeowners association
Exterior
- Parking: Covered parking (1 space); Carport (1 space); Additional parking available
- Utilities: Electricity connected; Well water; Septic system; All-weather road access; Municipal utility district: no
- Home design: Single-family residence (residential); One story; Property attached: yes; Built in 2021; Subdivision: Las Palmas Add
- Construction: Siding exterior; Composition roof; Slab foundation; Year built 2021
- Exterior features: Large backyard with grass; Few trees; Level lot; Acreage; Patio/porch: none noted; Easements for utilities and water lines
Interior
- Kitchen: Dishwasher; Electric oven; Electric range; Microwave
- Bedrooms: Primary bedroom on main level with walk-in closet; Two additional bedrooms on main level with custom closet systems
- Flooring: Ceramic tile
- Bathrooms: 2 full bathrooms
- Heating & cooling: Central heating (electric); Central air (electric)
- Interior features: Eat-in kitchen; Window coverings; One living area; One dining area; Total of 6 rooms
- Laundry & utility: Utility room; Washer hookup; Electric dryer hookup
Neighborhood map
What this means for you Summary
Snapshot
- This is a 3-bed/2.0-bath single-family listed at $205k.
Deal economics
- At list price, monthly cash flow is $-233 ($-3k/yr) — negative.
- To cash-flow at today's rent, offer at most $164k (20.0% below list).
- To meet the 1% rule (rent ≥ 1% of price), the offer needs to be $143k (30.4% below list).
- Recommended offer: $143k (30.4% below list) — sets the bar for 1% rule.
- Cap rate 4.9% vs local median 3.6% in Tyler — top-decile yield for the area; either an underpriced asset or a hidden risk that comps aren't pricing in. Stress-test before assuming the spread holds.
Location & tenants
- Location reads 75/100 on livability (#147 in TX, #4,181 nationally) — a middle-class / working-renter tenant base. Strengths: cost of living A+, housing A+, health & safety A+; Watch: employment C-, schools D+, crime D+.
- Chapel Hill ISD (rural): math 25% / reading 33% proficiency, ranked #650 of 826 in TX (top 79%) — low school quality limits family demand, transient renter base, plan for 1-2y turnover; 64% free/reduced lunch — lower-income household profile, screen leases tightly.
- Market conditions: 67 active listings in the ZIP; 595 units permitted in Smith County in 2024 (45 in 5+ unit buildings).
Forward outlook
- In year one you build about $12k of equity ($1k loan paydown + $10k appreciation (5.0% local appreciation)).
- Smith County population projected at +24% by 2050 — long-run rental-demand tailwind backs the buy-and-hold thesis.
- By year 4, paydown + projected appreciation supports a ~$39k cash-out refi (75% LTV) — recoverable capital for the next deal without selling this one.
Negotiation context
- It's been on market 98 days — a 9% lower offer ($187k) is reasonable based on typical stale-listing flexibility.
- 2 sale attempts with the ask held roughly flat each time — persistent listings suggest the price (not the market) is what's stuck; bring a comps-based counter.
Risks & watch-outs
- Climate carrying-cost: major wind risk, 60% chance of damaging wind over 30y; moderate wildfire risk; extreme-heat days projected 7→23/yr by 2055 (HVAC capex compounding) — expect insurance premiums to compound above CPI over the hold.
Questions for the listing agent
- What do current leases actually rent for vs. the listed asking? Can we see a recent rent roll and the last 12 months of T-12 income?
- It's been on market 98 days. Have you received any prior offers? Is the seller open to a 30% concession, seller financing, or rate buy-down credit?
- Why hasn't it sold? Are there any deal-killer items the seller is aware of (foundation, flood, title, zoning, code violations)?
- Is there a deadline driving the sale (1031 exchange, divorce, estate, relocation)? That informs how much negotiation room exists.
- Schools are D-rated, which usually means shorter tenancies and higher turnover. Who's the typical renter profile here, and what's been the actual vacancy rate?
- Crime grade is D in this area — have there been break-ins, vandalism, or insurance claims at this property in the last 3 years? What carrier currently insures it and at what premium?
- The area grade is low — what's the realistic commute time and amenity access for the typical tenant pool here? Any planned neighborhood developments (good or bad) we should know about?
- What's the average days-on-market for RENTAL listings here right now (not sales)? A rising rental-DOM trend means longer vacancies and softer asking-rent achievability than the comps imply.
- What's the recent tenant-quality profile in this submarket — average credit score on applications, eviction rate, late-payment / NSF rate, and stable-employment percentage? A property-management company in the area should have these aggregated.
- How much new for-sale + rental construction is in the pipeline within 1–3 miles? Heavy new supply typically softens prices + rents 12–24 months out; constrained supply supports both.
Investment metrics
- 1% rule
- 0.70% ✗
- Cap rate
- 4.93%
- Cash-on-cash
- -4.86%
- DSCR
- 0.78
- GRM
- 12.0
CMA / ARV
No comps found within radius.
Projected returns pro-forma
4.96% appreciation · 3.0% rent growth · sell at horizon
- IRR
- 8.7%
- Equity multiple
- 1.56×
- Total profit
- $32,001
- Equity at exit
- $115,728
- IRR
- 10.4%
- Equity multiple
- 2.91×
- Total profit
- $109,764
- Equity at exit
- $199,365
Cash invested: $57,400 (down + closing). Projections, not guarantees.
Landlord ↔ Tenant lean methodology
- Overall (STATE)
- 87 Strongly Landlord-Friendly
- State Texas
- 87 Strongly Landlord-Friendly · R+5
- County
- — inherits STATE
- City
- — inherits STATE
ZIP-level market 75708
- Home prices YoY
- 2.4%
- Active inventory
- 67
- Price-to-rent
- 12.0×
Monthly cashflow live
- Estimated rent
- $1,426 medium interval (Pro) →
- Mortgage (P&I)
- −$1,075
- Tax from tax record
- −$199 /mo · $2,389/yr
- Insurance
- −$85
- HOA
- −$0
- Vacancy / Maint / Mgmt
- −$300
- Net cashflow
- $-233
Break-even live
UW: 25.0% down · 7.5% · 30yr · 1.5% tax · 5.0% vac · 8.0% maint · 8.0% mgmt
Financing live
Cash to close
- Down payment
- $51,250
- Closing costs
- $6,150
- Reserves months
- —
- Total cash needed
- —
Loan-product check · same deal, 3 products live
Conventional
25% down · 7.5% · 30yr
- Down + closing
- —
- Monthly P&I
- —
- Monthly cashflow
- —
- DSCR
- —
- Eligible?
- —
Personal DTI + credit; lowest rate.
DSCR
20% down · 8.5% · 30yr
- Down + closing
- —
- Monthly P&I
- —
- Monthly cashflow
- —
- DSCR
- —
- Eligible?
- —
No personal income docs; deal must DSCR.
Hard money
10% down · 12.0% · 12mo
- Down + closing
- —
- Monthly P&I
- —
- Monthly cashflow
- —
- DSCR
- —
- Eligible?
- —
Short-term bridge; refi at stabilization.
Listing history 19 events
-
2026-06-19days on market $205,000 Active 98 DOM
-
2026-06-18days on market $205,000 Active 97 DOM
-
2026-06-17days on market $205,000 Active 96 DOM
-
2026-06-16days on market $205,000 Active 95 DOM
-
2026-06-15days on market $205,000 Active 94 DOM
-
2026-06-14days on market $205,000 Active 92 DOM
-
2026-06-13days on market $205,000 Active 91 DOM
-
2026-06-10days on market $205,000 Active 89 DOM
-
2026-06-09days on market $205,000 Active 88 DOM
-
2026-06-08days on market $205,000 Active 87 DOM
-
2026-06-07pricedays on market $205,000 Active 86 DOM
-
2026-06-02days on market $210,000 Active 81 DOM
-
2026-06-01days on market $210,000 Active 80 DOM
-
2026-05-31days on market $210,000 Active 79 DOM
-
2026-05-30days on market $210,000 Active 78 DOM
-
2026-05-18price $210,000
-
2026-03-27status Active
-
2026-03-24historical Active Option Contract
-
2026-03-13$215,000 Active
ⓘ Source: listings_history table (triggers on properties + properties_extension) + one-shot
backfill from property_details.listing_events for pre-trigger history.
Tax reassessment forecast TX · Resets to sale price
- Current annual tax
- $2,389 · $199/mo
- Projected year-2 tax
- $3,752 · $313/mo
- Expected delta
- +$1,363/yr (+$114/mo · 57.1%)
ⓘ Screening estimate from a state-policy table — verify with the county assessor before closing.
Climate risk First Street
- Flood 1/10 Low FEMA zone X (unshaded) · 0% chance over 30 yrs
- Wildfire 5/10 Major
- Heat 6/10 Major 7 d/yr ≥109°F today · 23 d/yr by 30 yrs out
- Wind 6/10 Major 60% chance of damaging wind over 30 yrs
- Air quality 2/10 Low 0 unhealthy d/yr today · 1 by 30 yrs out
Nearby sold comps map
Loading sold comps map…
Walkable amenities ~0.75 mi
Loading nearby amenities…
Taxation est. · year 1
- Rental income
- $17,117
- − Mortgage interest
- −$11,483
- − Property taxes
- −$2,389
- − Insurance
- −$1,025
- − Repairs & maintenance
- −$1,369
- − Management
- −$1,369
- − Depreciation
- −$5,964
- Taxable loss
- −$6,482
- Est. tax savings @ 24.0%
- +$1,556
- After-tax cash flow
- $-1,236/yr
For passive investors: Depreciation is non-cash, so a rental often shows a tax loss while cash-flowing — sheltering income. Rental losses are passive: they offset passive income freely, and up to $25,000/yr can offset ordinary (W-2) income if you actively participate and your MAGI is under $100k (phasing out to $0 by $150k); unused losses carry forward. On sale, claimed depreciation is recaptured at up to 25%, and gains may owe capital-gains tax (a 1031 exchange can defer both). Figures are a year-1 estimate at your 24.0% rate — not tax advice; consult a CPA.
Schools (NCES district)
- District
- Chapel Hill ISD
- NCES district ID
- 4813650
- Math proficiency
- 25% ▼ -10.00%
- Reading proficiency
- 33% ▼ -5.00%
- Median HH income
- $43,891
- Composite
- 24.76/100
- National rank
- #7603
- State rank
- #650 of 826 in TX
Livability — Tyler
- Score
- 75/100
- State rank
- #147
- US rank
- #4181
Category grades
Schools grade is shown separately in the Schools card above.
Census & demographics
- City population
- 127,842
- Population (ZIP)
- 10,001
Population outlook (Smith County) Hauer SSP2
- Today (2025)
- 248,890 people
- By 2030
- 261,665 · +5.1%
- By 2040
- 286,114 · +15.0%
- By 2050
- 308,006 · +23.8%
- By 2075
- 354,171 · +42.3%
- By 2100
- 372,828 · +49.8%
Race, ethnicity, and origin ACS 2023
- Neighborhood character
- Diverse neighborhood (Simpson 0.58)
- Race & ethnicity
- Hispanic / Latino 51% White 39% Two or more races 9% Black 9% Asian 1%
- Hispanic origin (detail)
- Mexican 49%
- Common ancestry
- Danish 1%
- Foreign-born
- 15% · Canada, Vietnam
- Languages at home
- 62% English-only · Spanish 37% Vietnamese 1%
Political lean MEDSL · Smith
- 2024 margin
- Solid R (+45.1) · D 27.0% · R 72.1%
- 2008→2024 swing
- -5.6pp toward R · 2008: -39.5pp · 2024: -45.1pp
- All cycles
- 2024: R+45.1 2020: R+39.4 2016: R+43.9 2012: R+46.9 2008: R+39.5
Not yet ingested
- Civics
- —
Market trends
- HPI YoY
- ▲ 4.96%
- Current HPI
- 216.4494
- Rent YoY
- —
- Metro
- —
- State GDP YoY
- ▲ 3.95%
- F500 in state
- 110
Industry mix (Fortune 500 HQ in TX)
| Industry | F500 HQs | Revenue |
|---|---|---|
| Energy | 16 | $1,198B |
|
||
| Technology | 5 | $198B |
|
||
| Engineering / Construction | 4 | $72B |
|
||
| Energy Services | 3 | $60B |
|
||
| Utilities | 3 | $41B |
|
||
| Healthcare | 2 | $330B |
|
||
Price history
-2.3% since first listed4 events — show timeline
- 2026-05-18 Price Changed $210,000 NTREIS
- 2026-03-27 Relisted — NTREIS
- 2026-03-24 Contingent — NTREIS
- 2026-03-13 Listed $215,000 NTREIS
Property tax history
+14.3%/yrLatest (2024): $2,389 · +11.2% YoY. Source: county tax records.
Cash-flow waterfall
monthlySold comps — $/sqft
last 12 mo · ≤1 miLoading sold comps…