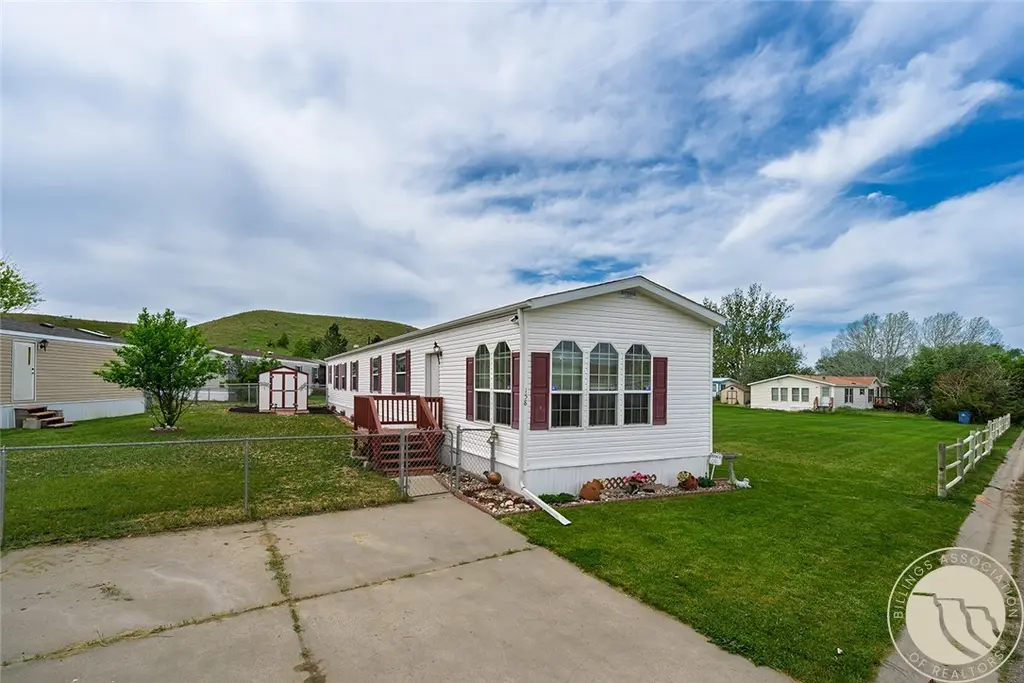
2224 Us Highway 87 E Trlr 158 · Lockwood, MT
Flood risk 4/10 · Minor
- FEMA flood zone
- D
- Chance of flooding over 30 yrs
- 0.24%
- Est. flood insurance / yr
- $544 – $1,084
Fire risk 7/10 · Major
- Est. fire insurance / yr
- $918 – $1,706
Heat risk 3/10 · Minor
- Hot days now (above 94°F)
- 7 days/yr
- Hot days in 30 yrs
- 15 days/yr
Wind risk 1/10 · Minimal
- Chance of severe wind over 30 yrs
- —
Air-quality risk 4/10 · Minor
- Unhealthy air days now
- 5 days/yr
- Unhealthy air days in 30 yrs
- 6 days/yr
Risk factors via First Street. Map © Google.
Why this score? — see what drove the B- grade
The composite is a weighted blend of 9 inputs, each scored 0–100. Each bar is that input's sub-score; the figure is the points it added to the 100-point composite (weight × sub-score).
- Cash flow +30.0/30.0
- 1% rule +10.0/10.0
- DSCR +10.0/10.0
- ARV discount +5.5/15.0
- Rent growth +3.5/5.0
- Livability +3.0/5.0
- Condition / age +2.8/5.0
- Schools +2.4/10.0
- Appreciation +0.0/10.0
$69,900
🖨 Deal sheet 📄 Offer letter ✓ Due diligence
Key facts
- Green space
- Covered deck
- New siding
Tags
Property features AI
Exterior
- Parking: Off-street parking
- Utilities: Shared well water; Public sewer
- Home design: Residential mobile home; Single-story
- Construction: Metal, aluminum and vinyl siding; Asphalt shingle roof
- Exterior features: Fenced yard; Landscaped, level site
Interior
- Kitchen: Includes dishwasher, oven, range, refrigerator
- Bedrooms: 3 bedrooms on the main level
- Bathrooms: 2 full bathrooms, both on the main level
- Heating & cooling: Central air conditioning; Natural gas forced air heating
- Interior features: Dishwasher, Oven, Range, Refrigerator; No basement
Neighborhood map
What this means for you Summary
Snapshot
- This is a 3-bed/2.0-bath manufactured listed at $70k. Condition is rated average.
Deal economics
- At list price, monthly cash flow is $816 ($10k/yr) — positive.
- The deal already cash-flows at list — no discount required.
- Meets the 1% rule at list price ($2k rent vs $70k).
- Cap rate 20.3% vs local median 1.7% in Lockwood — top-decile yield for the area; either an underpriced asset or a hidden risk that comps aren't pricing in. Stress-test before assuming the spread holds.
Location & tenants
- Location reads 59/100 on livability (#238 in MT) — a working-class tenant base; expect higher turnover. Strengths: cost of living A+, housing A+; Watch: health & safety C-, amenities F, commute F.
- Lockwood K-12 (suburban): math 21% / reading 33% proficiency, ranked #86 of 116 in MT (top 74%) — low school quality limits family demand, transient renter base, plan for 1-2y turnover.
- Zoned schools: Lockwood Primary (374 students, 0% FRL); Lockwood Middle School (math 19% / reading 35%, grade F, #115 of 146 statewide, top 79%, 433 students, 0% FRL); Lockwood High School (546 students, 0% FRL) — zoned schools average 0% FRL vs 35% district-wide (35 pts lower); this property's tenant base skews higher-income than the district average.
- Market conditions: Rents rising (+4.0%/yr); 279 active listings in the ZIP; 1 comparable units currently listed for rent nearby; 1,401 units permitted in Yellowstone County in 2024 (281 in 5+ unit buildings).
- This rent runs 34% of the median local income ($59k/yr) — at the standard rent-burdened threshold; future hikes will face affordability resistance.
Forward outlook
- Local home prices are declining (-3.0%/yr); year-one equity from $483 of loan paydown is wiped out by about $2k of value loss. Plan a longer hold.
- Yellowstone County population projected at +26% by 2050 — long-run rental-demand tailwind backs the buy-and-hold thesis.
- At projected returns (-3.0% appreciation + 4.0% rent growth), your $20k cash investment doubles in ~3 years — after that, you're playing with house money.
Negotiation context
- Only 5 days on market — expect competitive offers; lowballing is unlikely to land.
Risks & watch-outs
- Climate carrying-cost: major wildfire risk — expect insurance premiums to compound above CPI over the hold.
Questions for the listing agent
- Is there a deadline driving the sale (1031 exchange, divorce, estate, relocation)? That informs how much negotiation room exists.
- Schools are F-rated, which usually means shorter tenancies and higher turnover. Who's the typical renter profile here, and what's been the actual vacancy rate?
- What's the average days-on-market for RENTAL listings here right now (not sales)? A rising rental-DOM trend means longer vacancies and softer asking-rent achievability than the comps imply.
- What's the recent tenant-quality profile in this submarket — average credit score on applications, eviction rate, late-payment / NSF rate, and stable-employment percentage? A property-management company in the area should have these aggregated.
- How much new for-sale + rental construction is in the pipeline within 1–3 miles? Heavy new supply typically softens prices + rents 12–24 months out; constrained supply supports both.
Investment metrics
- 1% rule
- 2.35% ✓
- Cap rate
- 20.31%
- Cash-on-cash
- 50.06%
- DSCR
- 3.23
- GRM
- 3.5
CMA / ARV
- ARV (on-the-fly)
- $66,880
- Comps found
- 12
Show comp detail 12 sales within ~0.75 mi
| Address | Dist | Beds/Ba | Sqft | Sold | Price | $/sf | Match |
|---|---|---|---|---|---|---|---|
| 2224 Us Highway 87 E Trlr 158 | 0.00mi | 3/2.0 | 1,216 (0%) | 0mo | $69,900 | $57 | 100 |
| 2224 US Highway 87 E Trlr 91 | 0.03mi | 3/2.0 | 1,216 (0%) | 2mo | $50,150 | $41 | 97 |
| 2224 Highway 87 E #28 #28 | 0.03mi | 3/2.0 | 1,216 (0%) | 3mo | $49,000 | $40 | 96 |
| 2224 Highway 87 E #230 #230 | 0.03mi | 3/2.0 | 1,216 (0%) | 9mo | $59,000 | $49 | 92 |
| 2224 US Hwy 87 E #90 | 0.03mi | 3/2.0 | 1,216 (0%) | 9mo | $102,000 | $84 | 91 |
| 2224 Highway 87 E #129 | 0.03mi | 3/2.0 | 1,216 (0%) | 10mo | $59,000 | $49 | 91 |
| 2224 Highway 87 E #232 #232 | 0.03mi | 3/2.0 | 1,216 (0%) | 10mo | $99,999 | $82 | 91 |
| 2224 U.s. Highway 87 East #65 | 0.21mi | 3/2.0 | 1,216 (0%) | 3mo | $85,000 | $70 | 88 |
| 2224 Highway 87 E #193 | 0.23mi | 3/2.0 | 1,216 (0%) | 2mo | $59,000 | $49 | 88 |
| 2224 US Highway 87 E #57 | 0.21mi | 3/1.0 | 1,216 (0%) | 8mo | $45,000 | $37 | 80 |
| 2224 US Highway 87 E #181 | 0.21mi | 3/2.0 | 1,274 (+5%) | 10mo | $87,500 | $69 | 74 |
| 2224 Highway 87 E #220 #220 | 0.03mi | 3/2.0 | 1,065 (-12%) | 9mo | $59,000 | $55 | 70 |
Match score weights: distance 35% · size 25% · config 20% · recency 20%. Top-matched comps best support the ARV.
Projected returns pro-forma
-3.0% appreciation · 3.96% rent growth · sell at horizon
- IRR
- 48.9%
- Equity multiple
- 3.16×
- Total profit
- $42,303
- Equity at exit
- $10,422
- IRR
- 54.8%
- Equity multiple
- 6.65×
- Total profit
- $110,609
- Equity at exit
- $6,044
Cash invested: $19,572 (down + closing). Projections, not guarantees.
Landlord ↔ Tenant lean methodology
- Overall (STATE)
- 82 Strongly Landlord-Friendly
- State Montana
- 82 Strongly Landlord-Friendly · R+11
- County
- — inherits STATE
- City
- — inherits STATE
ZIP-level market 59101
- Rents YoY
- 4.0%
- Active inventory
- 279
- Price-to-rent
- 3.5×
Monthly cashflow live
- Estimated rent
- $1,645 medium interval (Pro) →
- Mortgage (P&I)
- −$367
- Tax est. 1.5%
- −$87 /mo · $1,048/yr
- Insurance
- −$29
- HOA
- −$0
- Vacancy / Maint / Mgmt
- −$345
- Net cashflow
- $816
Break-even live
UW: 25.0% down · 7.5% · 30yr · 1.5% tax · 5.0% vac · 8.0% maint · 8.0% mgmt
Financing live
Cash to close
- Down payment
- $17,475
- Closing costs
- $2,097
- Reserves months
- —
- Total cash needed
- —
Loan-product check · same deal, 3 products live
Conventional
25% down · 7.5% · 30yr
- Down + closing
- —
- Monthly P&I
- —
- Monthly cashflow
- —
- DSCR
- —
- Eligible?
- —
Personal DTI + credit; lowest rate.
DSCR
20% down · 8.5% · 30yr
- Down + closing
- —
- Monthly P&I
- —
- Monthly cashflow
- —
- DSCR
- —
- Eligible?
- —
No personal income docs; deal must DSCR.
Hard money
10% down · 12.0% · 12mo
- Down + closing
- —
- Monthly P&I
- —
- Monthly cashflow
- —
- DSCR
- —
- Eligible?
- —
Short-term bridge; refi at stabilization.
Rent comps 1 comps
| Address | Beds | Baths | Sqft | Rent | $/sqft | DOM | Units | Dist |
|---|---|---|---|---|---|---|---|---|
| 133 Hemlock Dr Billings, MT | 3.0 | 2.0 | 1450 | $1,700 | $1.17 | 44d | 1 | 0.60mi |
Listing history 6 events
-
2026-06-05status $69,900 Pending 5 DOM
-
2026-06-03days on market $69,900 Active 5 DOM
-
2026-06-02days on market $69,900 Active 4 DOM
-
2026-06-01days on market $69,900 Active 3 DOM
-
2026-05-31days on market $69,900 Active 2 DOM
-
2026-05-29$69,900 Active
ⓘ Source: listings_history table (triggers on properties + properties_extension) + one-shot
backfill from property_details.listing_events for pre-trigger history.
Climate risk First Street
- Flood 4/10 Moderate FEMA zone D · 24% chance over 30 yrs
- Wildfire 7/10 Severe
- Heat 3/10 Moderate 7 d/yr ≥94°F today · 15 d/yr by 30 yrs out
- Wind 1/10 Low
- Air quality 4/10 Moderate 5 unhealthy d/yr today · 6 by 30 yrs out
Nearby sold comps map
Loading sold comps map…
Walkable amenities ~0.75 mi
Loading nearby amenities…
Taxation est. · year 1
- Rental income
- $19,740
- − Mortgage interest
- −$3,915
- − Property taxes
- −$1,048
- − Insurance
- −$350
- − Repairs & maintenance
- −$1,579
- − Management
- −$1,579
- − Depreciation
- −$2,033
- Taxable income
- $9,234
- Est. tax owed @ 24.0%
- −$2,216
- After-tax cash flow
- $7,581/yr
For passive investors: Depreciation is non-cash, so a rental often shows a tax loss while cash-flowing — sheltering income. Rental losses are passive: they offset passive income freely, and up to $25,000/yr can offset ordinary (W-2) income if you actively participate and your MAGI is under $100k (phasing out to $0 by $150k); unused losses carry forward. On sale, claimed depreciation is recaptured at up to 25%, and gains may owe capital-gains tax (a 1031 exchange can defer both). Figures are a year-1 estimate at your 24.0% rate — not tax advice; consult a CPA.
Condition & rehab AI · 12 photos
The home is in average condition with some cosmetic updates needed to enhance its resale and rental value.
Repairs flagged
- Minor ceiling fan — lighting fixture needs cleaning
- Minor curtains — some appear frayed
Value-add opportunities
- Both painting the interior walls — fresh paint enhances curb appeal and interior aesthetics
- Both upgrading the ceiling fan — modern fan improves functionality and aesthetics
- Both replacing worn curtains — new curtains improve aesthetics and functionality
- Both landscaping the front yard — enhances curb appeal and adds value
Renovation cost estimate screening
| Repair item | Severity | Est. cost |
|---|---|---|
| ceiling fan · lighting fixture needs cleaning | Minor | $500–3,000 |
| curtains · some appear frayed | Minor | $500–3,000 |
| Total estimated repair cost · 2 items | $1,000–6,000 |
Value-add ROI direction
- Both painting the interior walls — fresh paint enhances curb appeal and interior aesthetics ↑
- Both upgrading the ceiling fan — modern fan improves functionality and aesthetics ↑
- Both replacing worn curtains — new curtains improve aesthetics and functionality ↑
- Both landscaping the front yard — enhances curb appeal and adds value ↑
ⓘ Cost ranges are severity-bucket heuristics (US national rule-of-thumb). Get contractor quotes + a written scope before underwriting a rehab budget.
Schools (NCES district)
- District
- Lockwood K-12
- NCES district ID
- 3000656
- Math proficiency
- 21% ▼ -5.00%
- Reading proficiency
- 33% ▼ -1.00%
- Median HH income
- $53,104
- Composite
- 23.97/100
- National rank
- #7779
- State rank
- #86 of 116 in MT
Livability — Lockwood
- Score
- 59/100
- State rank
- #238
- US rank
- #20350
Category grades
Schools grade is shown separately in the Schools card above.
Census & demographics
- Census place
- Lockwood, MT
- County
- Yellowstone County · 159,426 people
- City population
- 147,124
- Metro
- Billings, MT
- Population (ZIP)
- 42,250
- Household income
- $58,598
- Rent vs Own
- Severe rent burden
- 1534.0
Population outlook (Yellowstone County) Hauer SSP2
- Today (2025)
- 176,227 people
- By 2030
- 185,619 · +5.3%
- By 2040
- 203,543 · +15.5%
- By 2050
- 221,100 · +25.5%
- By 2075
- 266,931 · +51.5%
- By 2100
- 301,141 · +70.9%
Race, ethnicity, and origin ACS 2023
- Neighborhood character
- Predominantly White (75%)
- Race & ethnicity
- White 75% Hispanic / Latino 9% Native American 9% Two or more races 8% Black 1%
- Hispanic origin (detail)
- Mexican 6%
- Common ancestry
- Portuguese 6% Italian 2% Lithuanian 2%
- Foreign-born
- 2% · Canada
- Languages at home
- 96% English-only · Spanish 1%
Political lean MEDSL · Yellowstone
- 2024 margin
- Strong R (+27.1) · D 34.9% · R 62.0% · Other 3.1%
- 2008→2024 swing
- -20.8pp toward R · 2008: -6.3pp · 2024: -27.1pp
- All cycles
- 2024: R+27.1 2020: R+24.0 2016: R+27.1 2012: R+20.6 2008: R+6.3
Not yet ingested
- Civics
- —
Market trends
- HPI YoY
- ▼ -191.74%
- Current HPI
- 201.7039
- Rent YoY
- ▲ 3.96%
- Metro
- Billings, MT
- State GDP YoY
- ▲ 3.41%
- F500 in state
- 2
Industry mix (Fortune 500 HQ in MT)
| Industry | F500 HQs | Revenue |
|---|---|---|
| Technology / Analytics | 1 | $2B |
|
||
Price history
1 event — show timeline
- 2026-05-29 Listed $69,900 BMTMLS
Cash-flow waterfall
monthlySold comps — $/sqft
last 12 mo · ≤1 miLoading sold comps…