 🔨 Auction
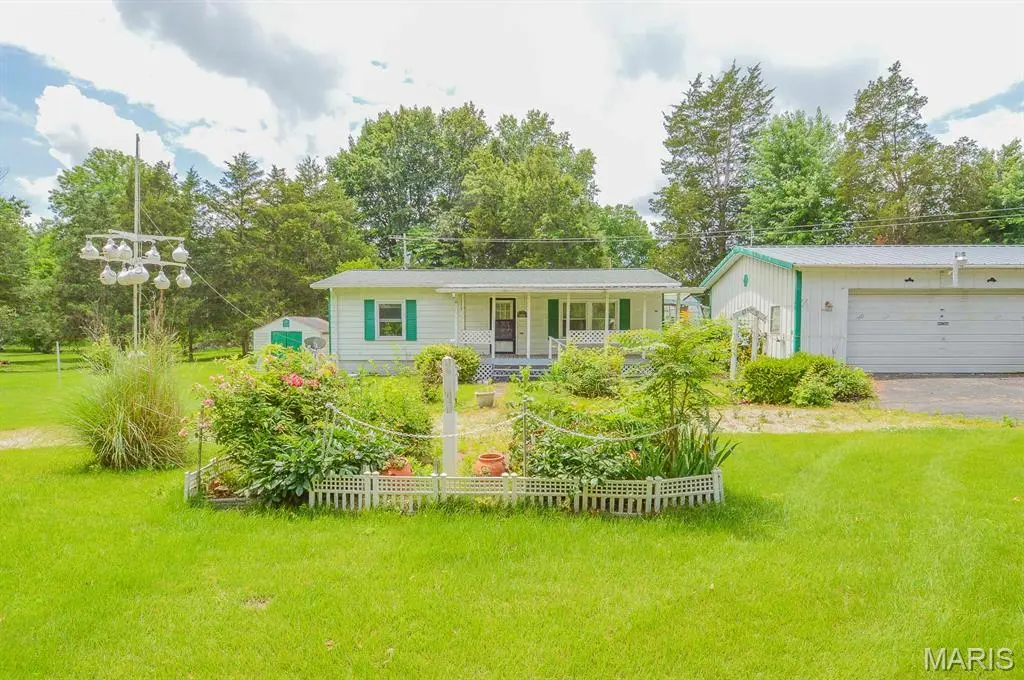
10231 Sandy Dr · Baldwin, IL
Flood risk 1/10 · Minimal
- FEMA flood zone
- X (unshaded)
- Chance of flooding over 30 yrs
- 0.0%
- Est. flood insurance / yr
- $473 – $860
Fire risk 2/10 · Minimal
- Est. fire insurance / yr
- $804 – $1,492
Heat risk 5/10 · Moderate
- Hot days now (above 108°F)
- 7 days/yr
- Hot days in 30 yrs
- 21 days/yr
Wind risk 2/10 · Minimal
- Chance of severe wind over 30 yrs
- 2.0%
Air-quality risk 2/10 · Minimal
- Unhealthy air days now
- 1 days/yr
- Unhealthy air days in 30 yrs
- 2 days/yr
Risk factors via First Street. Map © Google.
Why this score? — see what drove the F grade
The composite is a weighted blend of 9 inputs, each scored 0–100. Each bar is that input's sub-score; the figure is the points it added to the 100-point composite (weight × sub-score).
- ARV discount +7.5/15.0
- Appreciation +4.7/10.0
- Cash flow +4.6/30.0
- Livability +2.7/5.0
- Rent growth +2.5/5.0
- Schools +2.5/10.0
- Condition / age +2.5/5.0
- 1% rule +0.5/10.0
- DSCR +0.0/10.0
$20,000
🖨 Deal sheet 📄 Offer letter ✓ Due diligence
Listing remarks
Price listed is Starting Bid Only. Bidding starts closing 7/16/2026 @ 5 p. m. Some TLC could bring new life to this 2BR/1BA estate home set on a generous 0.78± acre lot in Baldwin. The manufactured home was built in 1975 and features a functional layout with a cozy living room that flows into the kitchen and adjacent utility area. Two bedrooms share a full hall bath, and a flexible bonus room offers additional living space while offering access to the backyard. Enjoy peaceful rural views from the covered front porch or take advantage of the existing garden beds ready for your personal touch. The property also includes a spacious 24’ x 40’ detached garage with full electri
Key facts
- Covered front porch
- Cozy living room
- Generous acre lot
Tags
Property features AI
Finance
- Other: Property listed as fixer condition; Above-grade finished living area recorded at 1,064
- Financial info: Lease not considered
Exterior
- Parking: Two-car garage (total parking for 2)
- Utilities: Public water; Septic tank; Electricity connected (electric listed as 'Other'); Propane available; Cable available; Water connected
- Home design: Private ownership; Manufactured (mobile) home; One story
- Construction: Architectural shingle roof; Other construction materials
- Exterior features: Back yard and front yard; A few trees on the lot; Pie-shaped lot; Barns and sheds on the property
Interior
- Bedrooms: Two bedrooms on the main level
- Bathrooms: One full bathroom on the main level
- Heating & cooling: Baseboard heating (electric); No central air conditioning
- Interior features: Crawl space basement; Living room fireplace fueled by propane
Neighborhood map
What this means for you Summary
Snapshot
- This is a 2-bed/1.0-bath single-family listed at $20k.
Deal economics
- At list price, monthly cash flow is $-449 ($-5k/yr) — negative.
- The deal already cash-flows at list — no discount required.
- Meets the 1% rule at list price ($977 rent vs $20k).
Location & tenants
- Location reads 54/100 on livability (#1,281 in IL) — a working-class tenant base; expect higher turnover. Strengths: cost of living A+, housing A+; Watch: crime F, amenities F, commute F.
- Red Bud CUSD 132 (town): math 20% / reading 35% proficiency, ranked #268 of 620 in IL (top 43%) — low school quality limits family demand, transient renter base, plan for 1-2y turnover.
- Zoned schools: Red Bud High School (math 22% / reading 27%, grade F, #256 of 693 statewide, top 44%, 410 students, 0% FRL) — zoned schools average 0% FRL vs 36% district-wide (36 pts lower); this property's tenant base skews higher-income than the district average.
- Market conditions: 4 active listings in the ZIP; 3 units permitted in Randolph County in 2024 (0 in 5+ unit buildings).
Forward outlook
- In year one you build about $240 of equity ($1k loan paydown + $-981 appreciation (-0.6% local appreciation)).
- Randolph County population projected at -14% by 2050 — secular population decline; favor cash flow + early exit over multi-decade hold.
Negotiation context
- Only 13 days on market — expect competitive offers; lowballing is unlikely to land.
Risks & watch-outs
- Watch-outs: property tax is 13.2% of price.
- Climate carrying-cost: extreme-heat days projected 7→21/yr by 2055 (HVAC capex compounding) — expect insurance premiums to compound above CPI over the hold.
Questions for the listing agent
- What do current leases actually rent for vs. the listed asking? Can we see a recent rent roll and the last 12 months of T-12 income?
- Built in 1975 — when were the roof, HVAC, electrical panel, plumbing, and water heater last replaced?
- Property tax is high relative to price — has the assessment been appealed recently, and will the sale trigger a re-assessment?
- Is there a deadline driving the sale (1031 exchange, divorce, estate, relocation)? That informs how much negotiation room exists.
- Schools are F-rated, which usually means shorter tenancies and higher turnover. Who's the typical renter profile here, and what's been the actual vacancy rate?
- Crime grade is F in this area — have there been break-ins, vandalism, or insurance claims at this property in the last 3 years? What carrier currently insures it and at what premium?
- The area grade is low — what's the realistic commute time and amenity access for the typical tenant pool here? Any planned neighborhood developments (good or bad) we should know about?
- What's the average days-on-market for RENTAL listings here right now (not sales)? A rising rental-DOM trend means longer vacancies and softer asking-rent achievability than the comps imply.
- What's the recent tenant-quality profile in this submarket — average credit score on applications, eviction rate, late-payment / NSF rate, and stable-employment percentage? A property-management company in the area should have these aggregated.
- How much new for-sale + rental construction is in the pipeline within 1–3 miles? Heavy new supply typically softens prices + rents 12–24 months out; constrained supply supports both.
Investment metrics
- 1% rule
- 0.55% ✗
- Cap rate
- 3.25%
- Cash-on-cash
- -10.89%
- DSCR
- 0.52
- GRM
- 15.1
CMA / ARV
- ARV (on-the-fly)
- $176,624
- Comps found
- 2
Show comp detail 2 sales within ~0.75 mi
| Address | Dist | Beds/Ba | Sqft | Sold | Price | $/sf | Match |
|---|---|---|---|---|---|---|---|
| 10236 Stringtown Rd | 0.19mi | 3/2.0 (+1) | 1,056 (-1%) | 23mo | $175,000 | $166 | 61 |
| 7657 State Route 154 | 0.34mi | 3/1.5 (+1) | 1,144 (+8%) | 14mo | $20,000 | $17 | 53 |
Match score weights: distance 35% · size 25% · config 20% · recency 20%. Top-matched comps best support the ARV.
Projected returns pro-forma
-0.56% appreciation · 3.0% rent growth · sell at horizon
- IRR
- -17.6%
- Equity multiple
- 0.23×
- Total profit
- $-38,282
- Equity at exit
- $46,437
- IRR
- -11.0%
- Equity multiple
- -0.05×
- Total profit
- $-51,917
- Equity at exit
- $52,084
Cash invested: $49,455 (down + closing). Projections, not guarantees.
Landlord ↔ Tenant lean methodology
- Overall (STATE)
- 43 Moderately Tenant-Leaning
- State Illinois
- 43 Moderately Tenant-Leaning · D+7
- County
- — inherits STATE
- City
- — inherits STATE
ZIP-level market 62217
- Home prices YoY
- -0.6%
- Active inventory
- 4
- Price-to-rent
- 1.7×
Monthly cashflow live
- Estimated rent
- $977 medium interval (Pro) →
- Mortgage (P&I)
- −$926
- Tax est. 1.5%
- −$221 /mo · $2,649/yr
- Insurance
- −$74
- HOA
- −$0
- Vacancy / Maint / Mgmt
- −$205
- Net cashflow
- $-449
Break-even live
UW: 25.0% down · 7.5% · 30yr · 1.5% tax · 5.0% vac · 8.0% maint · 8.0% mgmt
Financing live
Cash to close
- Down payment
- $44,156
- Closing costs
- $5,299
- Reserves months
- —
- Total cash needed
- —
Loan-product check · same deal, 3 products live
Conventional
25% down · 7.5% · 30yr
- Down + closing
- —
- Monthly P&I
- —
- Monthly cashflow
- —
- DSCR
- —
- Eligible?
- —
Personal DTI + credit; lowest rate.
DSCR
20% down · 8.5% · 30yr
- Down + closing
- —
- Monthly P&I
- —
- Monthly cashflow
- —
- DSCR
- —
- Eligible?
- —
No personal income docs; deal must DSCR.
Hard money
10% down · 12.0% · 12mo
- Down + closing
- —
- Monthly P&I
- —
- Monthly cashflow
- —
- DSCR
- —
- Eligible?
- —
Short-term bridge; refi at stabilization.
Listing history 10 events
-
2026-06-18days on market $20,000 Active 13 DOM
-
2026-06-17days on market $20,000 Active 12 DOM
-
2026-06-16days on market $20,000 Active 11 DOM
-
2026-06-15days on market $20,000 Active 10 DOM
-
2026-06-13days on market $20,000 Active 8 DOM
-
2026-06-12days on market $20,000 Active 7 DOM
-
2026-06-09days on market $20,000 Active 4 DOM
-
2026-06-08days on market $20,000 Active 3 DOM
-
2026-06-07remarks 680-char remark
-
2026-06-07$20,000 Active 2 DOM
ⓘ Source: listings_history table (triggers on properties + properties_extension) + one-shot
backfill from property_details.listing_events for pre-trigger history.
Tax reassessment forecast IL · Partial reset (capped growth)
- Current annual tax
- $343 · $29/mo
- Projected year-2 tax
- $399 · $33/mo
- Expected delta
- +$55/yr (+$5/mo · 16.1%)
ⓘ Screening estimate from a state-policy table — verify with the county assessor before closing.
Climate risk First Street
- Flood 1/10 Low FEMA zone X (unshaded) · 0% chance over 30 yrs
- Wildfire 2/10 Low
- Heat 5/10 Major 7 d/yr ≥108°F today · 21 d/yr by 30 yrs out
- Wind 2/10 Low 2% chance of damaging wind over 30 yrs
- Air quality 2/10 Low 1 unhealthy d/yr today · 2 by 30 yrs out
Nearby sold comps map
Loading sold comps map…
Walkable amenities ~0.75 mi
Loading nearby amenities…
Taxation est. · year 1
- Rental income
- $11,727
- − Mortgage interest
- −$9,894
- − Property taxes
- −$2,649
- − Insurance
- −$883
- − Repairs & maintenance
- −$938
- − Management
- −$938
- − Depreciation
- −$5,138
- Taxable loss
- −$8,714
- Est. tax savings @ 24.0%
- +$2,091
- After-tax cash flow
- $-3,292/yr
For passive investors: Depreciation is non-cash, so a rental often shows a tax loss while cash-flowing — sheltering income. Rental losses are passive: they offset passive income freely, and up to $25,000/yr can offset ordinary (W-2) income if you actively participate and your MAGI is under $100k (phasing out to $0 by $150k); unused losses carry forward. On sale, claimed depreciation is recaptured at up to 25%, and gains may owe capital-gains tax (a 1031 exchange can defer both). Figures are a year-1 estimate at your 24.0% rate — not tax advice; consult a CPA.
Schools (NCES district)
- District
- Red Bud CUSD 132
- NCES district ID
- 1733300
- Math proficiency
- 20% ▼ -8.00%
- Reading proficiency
- 35% ▼ -10.00%
- Median HH income
- $54,391
- Composite
- 24.5/100
- National rank
- #7652
- State rank
- #268 of 620 in IL
Livability — Baldwin
- Score
- 54/100
- State rank
- #1281
- US rank
- #24153
Category grades
Schools grade is shown separately in the Schools card above.
Census & demographics
- Population (ZIP)
- 710
Population outlook (Randolph County) Hauer SSP2
- Today (2025)
- 31,417 people
- By 2030
- 30,519 · -2.9%
- By 2040
- 28,841 · -8.2%
- By 2050
- 27,150 · -13.6%
- By 2075
- 22,569 · -28.2%
- By 2100
- 16,584 · -47.2%
Race, ethnicity, and origin ACS 2023
- Neighborhood character
- Predominantly White (99%)
- Race & ethnicity
- White 99%
- Common ancestry
- Lithuanian 9% Italian 5% Slovak 4%
Political lean MEDSL · Randolph
- 2024 margin
- Solid R (+50.0) · D 24.1% · R 74.1% · Other 1.7%
- 2008→2024 swing
- -49.0pp toward R · 2008: -0.9pp · 2024: -50.0pp
- All cycles
- 2024: R+50.0 2020: R+50.2 2016: R+46.8 2012: R+17.6 2008: R+0.9
Not yet ingested
- Civics
- —
Market trends
- HPI YoY
- ▼ -0.56%
- Current HPI
- 93.5403
- Rent YoY
- —
- Metro
- —
- State GDP YoY
- ▲ 1.59%
- F500 in state
- 60
Industry mix (Fortune 500 HQ in IL)
| Industry | F500 HQs | Revenue |
|---|---|---|
| Insurance | 4 | $201B |
|
||
| Consumer Goods | 4 | $87B |
|
||
| Industrial Machinery | 3 | $64B |
|
||
| Healthcare | 2 | $55B |
|
||
| Retail / Pharmacy | 1 | $148B |
|
||
| Agriculture / Food | 1 | $86B |
|
||
Price history
+100.0% since first listed2 events — show timeline
- 2026-06-05 Price Changed $20,000 MARIS as Distributed by MLS Grid
- 2026-06-05 Listed $10,000 MARIS as Distributed by MLS Grid
Cash-flow waterfall
monthlySold comps — $/sqft
last 12 mo · ≤1 miLoading sold comps…