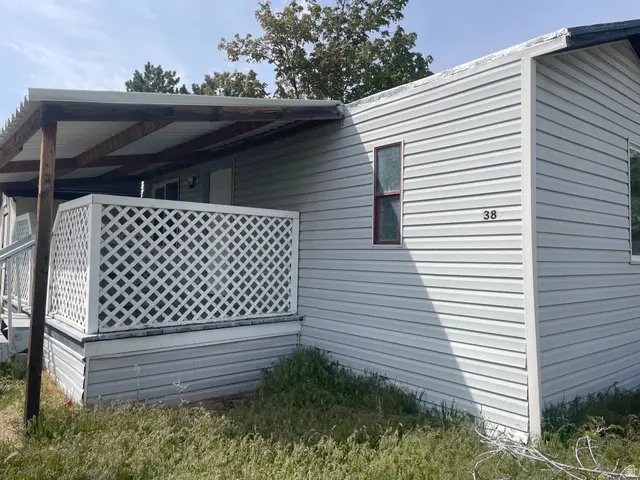
1350 W 300 N #38 · Clearfield, UT
Flood risk 1/10 · Minimal
- FEMA flood zone
- X (unshaded)
- Chance of flooding over 30 yrs
- 0.0%
- Est. flood insurance / yr
- $507 – $1,088
Fire risk 1/10 · Minimal
- Est. fire insurance / yr
- $453 – $841
Heat risk 4/10 · Minor
- Hot days now (above 93°F)
- 6 days/yr
- Hot days in 30 yrs
- 15 days/yr
Wind risk 1/10 · Minimal
- Chance of severe wind over 30 yrs
- —
Air-quality risk 2/10 · Minimal
- Unhealthy air days now
- 1 days/yr
- Unhealthy air days in 30 yrs
- 2 days/yr
Risk factors via First Street. Map © Google.
Why this score? — see what drove the D+ grade
The composite is a weighted blend of 9 inputs, each scored 0–100. Each bar is that input's sub-score; the figure is the points it added to the 100-point composite (weight × sub-score).
- Cash flow +15.0/30.0
- ARV discount +7.5/15.0
- 1% rule +5.0/10.0
- DSCR +5.0/10.0
- Schools +4.1/10.0
- Livability +3.9/5.0
- Rent growth +3.1/5.0
- Condition / age +2.5/5.0
- Appreciation +0.0/10.0
$24,000
🖨 Deal sheet (PDF) 📄 Offer letter ✓ Due diligence
Listing remarks
Seller financing available. Beautifully remodeled 2 bed 2 bath home with fresh paint, updated flooring, and modern bathrooms throughout. Bright and open with tons of natural light that makes the whole place feel warm and inviting. Located near Clearfield Station with easy access to the FrontRunner, making commuting simple and convenient. Move-in ready and shows great.
Key facts
- Natural light
- Updated flooring
- Modern bathrooms
Tags
Property features AI
Finance
- Other: Zoning: R-M
- HOA & community: Homeowners association with monthly fee; Association fee $960 monthly; Association covers sewer, trash, and water; Association allows pets; Association provides management
Exterior
- Parking: Carport (covered) for 2 cars; 2 total parking spaces
- Utilities: Natural gas connected; Electricity connected; Public sewer connected; Water connected
- Home design: Manufactured home; Single-story; Residential use; Built and standing
- Construction: Built/Standing construction
- Exterior features: Covered patio
Interior
- Bedrooms: 2 bedrooms on the main level
- Flooring: Laminate flooring
- Bathrooms: 2 full bathrooms
- Heating & cooling: Gas central heating; Central air conditioning
- Interior features: Single-level living; 8 total rooms; No basement; Covered patio
- Laundry & utility: Electric dryer hookup
Neighborhood map
What this means for you Summary
Snapshot
- This is a 2-bed/2.0-bath manufactured listed at $24k.
Deal economics
- At list price, monthly cash flow is $149 ($2k/yr) — positive.
- The deal already cash-flows at list — no discount required.
- Meets the 1% rule at list price ($2k rent vs $24k).
- Recommended offer: $23k (6.0% below list) — sets the bar for market timing.
Location & tenants
- Location reads 78/100 on livability (#45 in UT, #2,413 nationally) — a middle-class / working-renter tenant base. Strengths: commute A+, housing A+, employment B+; Watch: amenities D-.
- Davis District (suburban): math 43% / reading 47% proficiency, ranked #28 of 80 in UT (top 35%) — families likely to look elsewhere, expect single-tenant / working-renter base with shorter leases; only 19% free/reduced lunch — higher-income household profile.
- Zoned schools: Holt School (math 25% / reading 22%, grade F, #494 of 585 statewide, top 85%, 458 students, 41% FRL); North Davis Jr High (math 30% / reading 34%, grade F, #101 of 138 statewide, top 73%, 924 students, 46% FRL); Clearfield High (math 23% / reading 41%, grade F, #111 of 171 statewide, top 68%, 2,030 students, 22% FRL) — zoned schools average 37% FRL vs 19% district-wide (18 pts higher); higher-poverty schools than district average — tighter screening recommended.
- Zoned-school proficiency averages 29% at this address vs 45% district-wide (-16 pts) — the specific schools serving this property underperform the Davis District average; the district grade overstates school quality for this exact location.
- Market conditions: Rents rising (+2.2%/yr); 395 active listings in the ZIP; 8 comparable units currently listed for rent nearby; rentals at typical pace (median 16d on market — plan ~3-4 weeks tenant-placement turnaround); solid renter incomes; 1,461 units permitted in Davis County in 2024 (508 in 5+ unit buildings).
Forward outlook
- Local home prices are declining (-3.0%/yr); year-one equity from $166 of loan paydown is wiped out by about $720 of value loss. Plan a longer hold.
- Davis County population projected at +39% by 2050 — long-run rental-demand tailwind backs the buy-and-hold thesis.
- At projected returns (-3.0% appreciation + 2.2% rent growth), your $7k cash investment doubles in ~5 years — after that, you're playing with house money.
Negotiation context
- It's been on market 64 days — a 6% lower offer ($23k) is reasonable based on typical stale-listing flexibility.
- 2 sale attempts; this cycle's ask has dropped $6k (20%) from the opening price — seller is motivated, your offer sets the floor, not the list.
Risks & watch-outs
- Watch-outs: HOA is 59% of rent.
Questions for the listing agent
- It's been on market 64 days. Have you received any prior offers? Is the seller open to a 6% concession, seller financing, or rate buy-down credit?
- What does the HOA fee cover, when was the last increase, and are there any pending special assessments or reserve-fund shortfalls?
- Why hasn't it sold? Are there any deal-killer items the seller is aware of (foundation, flood, title, zoning, code violations)?
- Is there a deadline driving the sale (1031 exchange, divorce, estate, relocation)? That informs how much negotiation room exists.
- The area grade is low — what's the realistic commute time and amenity access for the typical tenant pool here? Any planned neighborhood developments (good or bad) we should know about?
- What's the average days-on-market for RENTAL listings here right now (not sales)? A rising rental-DOM trend means longer vacancies and softer asking-rent achievability than the comps imply.
- What's the recent tenant-quality profile in this submarket — average credit score on applications, eviction rate, late-payment / NSF rate, and stable-employment percentage? A property-management company in the area should have these aggregated.
- How much new for-sale + rental construction is in the pipeline within 1–3 miles? Heavy new supply typically softens prices + rents 12–24 months out; constrained supply supports both.
Investment metrics
- 1% rule
- 6.72% ✓
- Cap rate
- 13.74%
- Cash-on-cash
- 26.61%
- DSCR
- 2.18
- GRM
- 1.2
CMA / ARV
No comps found within radius.
Projected returns pro-forma
-3.0% appreciation · 2.25% rent growth · sell at horizon
- IRR
- 18.7%
- Equity multiple
- 1.75×
- Total profit
- $5,009
- Equity at exit
- $3,578
- IRR
- 26.0%
- Equity multiple
- 3.11×
- Total profit
- $14,194
- Equity at exit
- $2,075
Cash invested: $6,720 (down + closing). Projections, not guarantees.
Landlord ↔ Tenant lean methodology
- Overall (STATE)
- 86 Strongly Landlord-Friendly
- State Utah
- 86 Strongly Landlord-Friendly · R+15
- County
- — inherits STATE
- City
- — inherits STATE
ZIP-level market 84015
- Rents YoY
- 2.2%
- Active inventory
- 395
- Price-to-rent
- 1.2×
Monthly cashflow live
- Estimated rent
- $1,614 high interval (Pro) →
- Mortgage (P&I)
- −$126
- Tax est. 1.5%
- −$30 /mo · $360/yr
- Insurance
- −$10
- HOA
- −$960
- Vacancy / Maint / Mgmt
- −$339
- Net cashflow
- $149
Break-even live
Sensitivity live
| Price | -10% $166 | -5% $157 | +0% $149 | +5% $141 | +10% $132 |
|---|---|---|---|---|---|
| Rent | -10% $22 | -5% $85 | +0% $149 | +5% $213 | +10% $277 |
| Rate | -1.0pp $161 | -0.5pp $155 | base $149 | +0.5pp $143 | +1.0pp $136 |
UW: 25.0% down · 7.5% · 30yr · 1.5% tax · 5.0% vac · 8.0% maint · 8.0% mgmt
Financing live
Cash to close
- Down payment
- $6,000
- Closing costs
- $720
- Reserves months
- —
- Total cash needed
- —
Loan-product check · same deal, 3 products live
Conventional
25% down · 7.5% · 30yr
- Down + closing
- —
- Monthly P&I
- —
- Monthly cashflow
- —
- DSCR
- —
- Eligible?
- —
Personal DTI + credit; lowest rate.
DSCR
20% down · 8.5% · 30yr
- Down + closing
- —
- Monthly P&I
- —
- Monthly cashflow
- —
- DSCR
- —
- Eligible?
- —
No personal income docs; deal must DSCR.
Hard money
10% down · 12.0% · 12mo
- Down + closing
- —
- Monthly P&I
- —
- Monthly cashflow
- —
- DSCR
- —
- Eligible?
- —
Short-term bridge; refi at stabilization.
Rent comps 8 comps
| Address | Beds | Baths | Sqft | Rent | $/sqft | DOM | Units | Dist |
|---|---|---|---|---|---|---|---|---|
| 163 S 1450 W Clearfield, UT | 2.0–3.0 | 1.5 | 1060 | $1,617 | $1.53 | 16d | 2 | 0.73mi |
| 684 W 800 N Clearfield, UT | 2.0 | 1.0–1.5 | 831 | $1,315 | $1.58 | 25d | 1 | 0.75mi |
| 101 N 2000 W West Point, UT | 1.0–2.0 | 1.0–2.0 | 970 | $1,953 | $2.01 | 16d | 9 | 0.85mi |
| 326 S 1550 W Syracuse, UT | 1.0–4.0 | 1.0–2.5 | 1545 | $1,758 | $1.14 | 16d | 37 | 0.94mi |
| 373 N 2625 W West Point, UT | 2.0 | 1.0 | 800 | $1,350 | $1.69 | 16d | 1 | 1.30mi |
| 75 W 250 N Clearfield, UT | 2.0 | 2.0 | 896 | $1,424 | $1.59 | 25d | 1 | 1.36mi |
| 54 W 250 N Apt 2 Clearfield, UT | 2.0 | 1.0 | 900 | $1,095 | $1.22 | 25d | 1 | 1.38mi |
| 101 N Main St Clearfield, UT | 1.0–3.0 | 1.0–2.0 | 1040 | $1,572 | $1.51 | 15d | 8 | 1.44mi |
HOA detail
- Monthly dues
- $960 · $11,520/yr
Listing history 24 events
-
2026-06-21days on market $24,000 Active 64 DOM
-
2026-06-18days on market $24,000 Active 61 DOM
-
2026-06-17days on market $24,000 Active 60 DOM
-
2026-06-16days on market $24,000 Active 59 DOM
-
2026-06-15days on market $24,000 Active 58 DOM
-
2026-06-14days on market $24,000 Active 56 DOM
-
2026-06-13days on market $24,000 Active 55 DOM
-
2026-06-10days on market $24,000 Active 53 DOM
-
2026-06-09days on market $24,000 Active 52 DOM
-
2026-06-08days on market $24,000 Active 51 DOM
-
2026-06-07days on market $24,000 Active 50 DOM
-
2026-06-05days on market $24,000 Active 47 DOM
-
2026-06-03days on market $24,000 Active 46 DOM
-
2026-06-02days on market $24,000 Active 45 DOM
-
2026-06-01days on market $24,000 Active 44 DOM
-
2026-05-31days on market $24,000 Active 43 DOM
-
2026-05-31days on market $24,000 Active 42 DOM
-
2026-05-15price $28,000
-
2026-04-24price $29,000
-
2026-04-18$30,000 Active
-
2026-01-03historical
-
2025-05-28price $59,000
-
2025-03-13price $69,000
-
2025-01-03$79,000 Active
ⓘ Source: listings_history table (triggers on properties + properties_extension) + one-shot
backfill from property_details.listing_events for pre-trigger history.
Climate risk First Street
- Flood 1/10 Low FEMA zone X (unshaded) · 0% chance over 30 yrs
- Wildfire 1/10 Low
- Heat 4/10 Moderate 6 d/yr ≥93°F today · 15 d/yr by 30 yrs out
- Wind 1/10 Low
- Air quality 2/10 Low 1 unhealthy d/yr today · 2 by 30 yrs out
Nearby sold comps map
Loading sold comps map…
Walkable amenities ~0.75 mi
Loading nearby amenities…
Taxation est. · year 1
- Rental income
- $19,365
- − Mortgage interest
- −$1,344
- − Property taxes
- −$360
- − Insurance
- −$120
- − Repairs & maintenance
- −$1,549
- − Management
- −$1,549
- − HOA
- −$11,520
- − Depreciation
- −$698
- Taxable income
- $2,224
- Est. tax owed @ 24.0%
- −$534
- After-tax cash flow
- $1,255/yr
For passive investors: Depreciation is non-cash, so a rental often shows a tax loss while cash-flowing — sheltering income. Rental losses are passive: they offset passive income freely, and up to $25,000/yr can offset ordinary (W-2) income if you actively participate and your MAGI is under $100k (phasing out to $0 by $150k); unused losses carry forward. On sale, claimed depreciation is recaptured at up to 25%, and gains may owe capital-gains tax (a 1031 exchange can defer both). Figures are a year-1 estimate at your 24.0% rate — not tax advice; consult a CPA.
Schools (NCES district)
- District
- Davis District
- NCES district ID
- 4900210
- Math proficiency
- 43% ▼ -9.00%
- Reading proficiency
- 47% ▼ -5.00%
- Median HH income
- $70,511
- Composite
- 40.59/100
- National rank
- #3698
- State rank
- #28 of 80 in UT
Livability — Clearfield
- Score
- 78/100
- State rank
- #45
- US rank
- #2413
Category grades
Schools grade is shown separately in the Schools card above.
Census & demographics
- Census place
- Clearfield, UT
- County
- Davis County · 341,755 people
- City population
- 71,812
- Metro
- Ogden-Clearfield, UT
- Population (ZIP)
- 71,812
- Household income
- $95,519
- Rent vs Own
- Severe rent burden
- 985.0
Population outlook (Davis County) Hauer SSP2
- Today (2025)
- 399,271 people
- By 2030
- 430,528 · +7.8%
- By 2040
- 493,485 · +23.6%
- By 2050
- 555,187 · +39.1%
- By 2075
- 688,589 · +72.5%
- By 2100
- 769,646 · +92.8%
Race, ethnicity, and origin ACS 2023
- Neighborhood character
- Predominantly White (75%)
- Race & ethnicity
- White 75% Hispanic / Latino 16% Two or more races 9% Asian 2% Black 1%
- Hispanic origin (detail)
- Mexican 12%
- Common ancestry
- Slovak 3% Italian 3% Portuguese 2%
- Foreign-born
- 6% · Canada, Vietnam
- Languages at home
- 88% English-only · Spanish 9% Other Asian/Pacific 1% Tagalog/Filipino 1%
Political lean MEDSL · Davis
- 2024 margin
- Strong R (+24.9) · D 36.0% · R 60.8% · Other 3.2%
- 2008→2024 swing
- +17.4pp toward D · 2008: -42.3pp · 2024: -24.9pp
- All cycles
- 2024: R+24.9 2020: R+27.5 2016: R+23.3 2012: R+61.8 2008: R+42.3
Not yet ingested
- Civics
- —
Market trends
- HPI YoY
- ▼ -249.80%
- Current HPI
- 330.669
- Rent YoY
- ▲ 2.25%
- Metro
- Ogden-Clearfield, UT
- State GDP YoY
- ▲ 3.54%
- F500 in state
- 2
Industry mix (Fortune 500 HQ in UT)
| Industry | F500 HQs | Revenue |
|---|---|---|
| Financial Services | 1 | $3B |
|
||
Price history
-64.6% since first listed7 events — show timeline
- 2026-05-15 Price Changed $28,000 WFRMLS
- 2026-04-24 Price Changed $29,000 WFRMLS
- 2026-04-18 Listed $30,000 WFRMLS
- 2026-01-03 Listing Removed — WFRMLS
- 2025-05-28 Price Changed $59,000 WFRMLS
- 2025-03-13 Price Changed $69,000 WFRMLS
- 2025-01-03 Listed $79,000 WFRMLS
Cash-flow waterfall
monthlySold comps — $/sqft
last 12 mo · ≤1 miLoading sold comps…