11705 SP 22 Parey Ave · Proberta, CA
Flood risk 7/10 · Major
- FEMA flood zone
- A
- Chance of flooding over 30 yrs
- 0.75%
- Est. flood insurance / yr
- $1,009 – $1,996
Fire risk 8/10 · Major
- Est. fire insurance / yr
- $659 – $1,223
Heat risk 8/10 · Major
- Hot days now (above 105°F)
- 7 days/yr
- Hot days in 30 yrs
- 16 days/yr
Wind risk 1/10 · Minimal
- Chance of severe wind over 30 yrs
- —
Air-quality risk 10/10 · Severe
- Unhealthy air days now
- 32 days/yr
- Unhealthy air days in 30 yrs
- 36 days/yr
Risk factors via First Street. Map © Google.
Why this score? — see what drove the D grade
The composite is a weighted blend of 9 inputs, each scored 0–100. Each bar is that input's sub-score; the figure is the points it added to the 100-point composite (weight × sub-score).
- Cash flow +15.0/30.0
- ARV discount +7.5/15.0
- 1% rule +5.0/10.0
- DSCR +5.0/10.0
- Schools +4.4/10.0
- Rent growth +2.7/5.0
- Condition / age +2.5/5.0
- Livability +1.9/5.0
- Appreciation +0.0/10.0
$28,500
🖨 Deal sheet (PDF) 📄 Offer letter ✓ Due diligence
Listing remarks
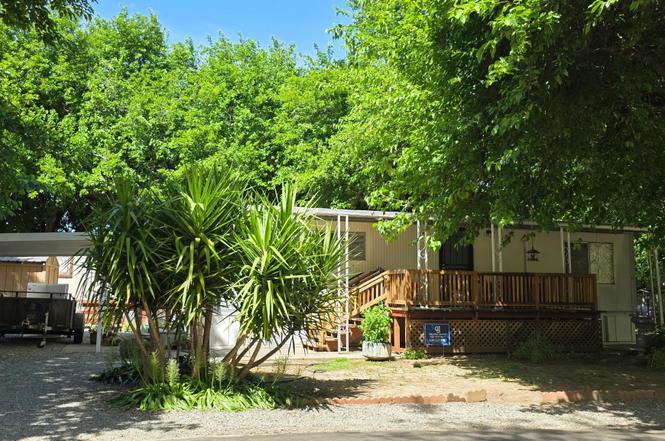
Located in the peaceful River View Mobile Home Community along the Sacramento River, this well maintained Double Wide Mobile home offers a perfect blend of modern comfort and tranquil 55+ senior living. Property Overview Address: 11705 Parey Ave. , SP 22, Red Bluff, CA 96080 2 Bedrooms / 1 Bathroom Interior Space: Approximately 800 sq. ft. of updated living area. Key Upgrades & Features: Nearly new appliances, flooring, and mini splits. All lights on dimmers. New interior paint. This corner lot has lots of elbow room. Reliable Utilities: This property comes with restored and updated modern appliances with lots of upgrades. Outdoor Living: Step outside to an expansive nearly new 8ft x
Key facts
- Community clubhouse
- Newer water heater
- Built 1972
Tags
Property features AI
Exterior
- Parking: Detached carport; Carport present; Gravel parking surface
- Utilities: Electricity available; Natural gas available; Propane available; Septic tank
- Home design: Manufactured home; Residential property
- Construction: Metal roof; 40-foot mobile unit (LANCER HM model); Foundation details: see remarks
- Exterior features: Deck; Porch; Partial fencing; Shed(s); Back yard; Corner lot; Garden; Landscaped yard; Wooded area; Paved road access
Interior
- Kitchen: Gas oven; Gas range; Refrigerator
- Bathrooms: 1 full bathroom
- Heating & cooling: Ductless heating; Ductless cooling
- Interior features: Laminate counters; One fireplace (no special features listed)
Neighborhood map
What this means for you Summary
Snapshot
- This is a 2-bed/1.0-bath manufactured listed at $28k.
Deal economics
- At list price, monthly cash flow is $848 ($10k/yr) — positive.
- The deal already cash-flows at list — no discount required.
- Meets the 1% rule at list price ($1k rent vs $28k).
- Recommended offer: $25k (12.0% below list) — sets the bar for market timing.
Location & tenants
- Location reads 37/100 on livability (#1,425 in CA) — a limited-amenity area; tenant pool skews transient or value-seeking. Strengths: crime A; Watch: schools D-, amenities F, commute F.
- Lassen View Union Elementary (rural): math 47% / reading 56% proficiency, ranked #142 of 517 in CA (top 28%) — acceptable for families but not a draw, mixed tenant base, ~2y average lease.
- Market conditions: Rents flat; 263 active listings in the ZIP; 186 units permitted in Tehama County in 2024 (0 in 5+ unit buildings).
Forward outlook
- Local home prices are declining (-3.0%/yr); year-one equity from $197 of loan paydown is wiped out by about $855 of value loss. Plan a longer hold.
- Tehama County population projected at -14% by 2050 — secular population decline; favor cash flow + early exit over multi-decade hold.
- At projected returns (-3.0% appreciation + 1.0% rent growth), your $8k cash investment doubles in ~1 year — after that, you're playing with house money.
Negotiation context
- It's been on market 135 days — a 12% lower offer ($25k) is reasonable based on typical stale-listing flexibility.
- 2 sale attempts with the ask held roughly flat each time — persistent listings suggest the price (not the market) is what's stuck; bring a comps-based counter.
Risks & watch-outs
- Watch-outs: flood insurance adds $125/mo.
- Climate carrying-cost: in FEMA flood zone A (mandatory federal flood insurance); severe wildfire risk; extreme-heat days projected 7→16/yr by 2055 (HVAC capex compounding) — expect insurance premiums to compound above CPI over the hold.
Questions for the listing agent
- It's been on market 135 days. Have you received any prior offers? Is the seller open to a 12% concession, seller financing, or rate buy-down credit?
- Built in 1972 — when were the roof, HVAC, electrical panel, plumbing, and water heater last replaced?
- What's the actual annual flood-insurance premium (NFIP or private), and is the property in a SFHA with mandatory coverage?
- Why hasn't it sold? Are there any deal-killer items the seller is aware of (foundation, flood, title, zoning, code violations)?
- Is there a deadline driving the sale (1031 exchange, divorce, estate, relocation)? That informs how much negotiation room exists.
- Schools are D-rated, which usually means shorter tenancies and higher turnover. Who's the typical renter profile here, and what's been the actual vacancy rate?
- The area grade is low — what's the realistic commute time and amenity access for the typical tenant pool here? Any planned neighborhood developments (good or bad) we should know about?
- What's the average days-on-market for RENTAL listings here right now (not sales)? A rising rental-DOM trend means longer vacancies and softer asking-rent achievability than the comps imply.
- What's the recent tenant-quality profile in this submarket — average credit score on applications, eviction rate, late-payment / NSF rate, and stable-employment percentage? A property-management company in the area should have these aggregated.
- How much new for-sale + rental construction is in the pipeline within 1–3 miles? Heavy new supply typically softens prices + rents 12–24 months out; constrained supply supports both.
Investment metrics
- 1% rule
- 5.11% ✓
- Cap rate
- 47.26%
- Cash-on-cash
- 146.32%
- DSCR
- 7.51
- GRM
- 1.6
CMA / ARV
No comps found within radius.
Projected returns pro-forma
-3.0% appreciation · 0.98% rent growth · sell at horizon
- IRR
- —
- Equity multiple
- 6.83×
- Total profit
- $46,563
- Equity at exit
- $4,249
- IRR
- —
- Equity multiple
- 13.40×
- Total profit
- $98,989
- Equity at exit
- $2,464
Cash invested: $7,980 (down + closing). Projections, not guarantees.
Landlord ↔ Tenant lean methodology
- Overall (STATE)
- 18 Strongly Tenant-Friendly
- State California
- 18 Strongly Tenant-Friendly · D+13
- County
- — inherits STATE
- City
- — inherits STATE
ZIP-level market 96080
- Rents YoY
- 1.0%
- Active inventory
- 263
- Price-to-rent
- 1.6×
Monthly cashflow live
- Estimated rent
- $1,458 medium interval (Pro) →
- Mortgage (P&I)
- −$149
- Tax from tax record
- −$17 /mo · $206/yr
- Insurance
- −$12
- Flood insurance flood zone
- −$125 /mo · $1,502/yr
- HOA
- −$0
- Vacancy / Maint / Mgmt
- −$306
- Net cashflow
- $848
Break-even live
Sensitivity live
| Price | -10% $864 | -5% $856 | +0% $848 | +5% $840 | +10% $832 |
|---|---|---|---|---|---|
| Rent | -10% $733 | -5% $790 | +0% $848 | +5% $905 | +10% $963 |
| Rate | -1.0pp $862 | -0.5pp $855 | base $848 | +0.5pp $840 | +1.0pp $833 |
UW: 25.0% down · 7.5% · 30yr · 1.5% tax · 5.0% vac · 8.0% maint · 8.0% mgmt
Financing live
Cash to close
- Down payment
- $7,125
- Closing costs
- $855
- Reserves months
- —
- Total cash needed
- —
Loan-product check · same deal, 3 products live
Conventional
25% down · 7.5% · 30yr
- Down + closing
- —
- Monthly P&I
- —
- Monthly cashflow
- —
- DSCR
- —
- Eligible?
- —
Personal DTI + credit; lowest rate.
DSCR
20% down · 8.5% · 30yr
- Down + closing
- —
- Monthly P&I
- —
- Monthly cashflow
- —
- DSCR
- —
- Eligible?
- —
No personal income docs; deal must DSCR.
Hard money
10% down · 12.0% · 12mo
- Down + closing
- —
- Monthly P&I
- —
- Monthly cashflow
- —
- DSCR
- —
- Eligible?
- —
Short-term bridge; refi at stabilization.
Listing history 24 events
-
2026-06-21days on market $28,500 Active 135 DOM
-
2026-06-19days on market $28,500 Active 133 DOM
-
2026-06-18days on market $28,500 Active 132 DOM
-
2026-06-17days on market $28,500 Active 131 DOM
-
2026-06-16days on market $28,500 Active 130 DOM
-
2026-06-15days on market $28,500 Active 129 DOM
-
2026-06-14days on market $28,500 Active 127 DOM
-
2026-06-12days on market $28,500 Active 126 DOM
-
2026-06-09days on market $28,500 Active 123 DOM
-
2026-06-08days on market $28,500 Active 122 DOM
-
2026-06-07days on market $28,500 Active 121 DOM
-
2026-06-05days on market $28,500 Active 118 DOM
-
2026-06-03days on market $28,500 Active 117 DOM
-
2026-06-02days on market $28,500 Active 116 DOM
-
2026-06-01days on market $28,500 Active 115 DOM
-
2026-05-31days on market $28,500 Active 114 DOM
-
2026-05-30days on market $28,500 Active 113 DOM
-
2026-04-24price $28,500
-
2026-04-22price $29,500
-
2026-04-20price $27,500
-
2026-03-18price $29,995
-
2026-02-13price $31,995
-
2026-02-07status Active
-
2026-01-15$29,995 Active
ⓘ Source: listings_history table (triggers on properties + properties_extension) + one-shot
backfill from property_details.listing_events for pre-trigger history.
Tax reassessment forecast CA · Resets to sale price
- Current annual tax
- $206 · $17/mo
- Projected year-2 tax
- $217 · $18/mo
- Expected delta
- +$11/yr (+$1/mo · 5.3%)
ⓘ Screening estimate from a state-policy table — verify with the county assessor before closing.
Climate risk First Street
- Flood 7/10 Severe FEMA zone A · 75% chance over 30 yrs
- Wildfire 8/10 Severe
- Heat 8/10 Severe 7 d/yr ≥105°F today · 16 d/yr by 30 yrs out
- Wind 1/10 Low
- Air quality 10/10 Extreme 32 unhealthy d/yr today · 36 by 30 yrs out
Nearby sold comps map
Loading sold comps map…
Walkable amenities ~0.75 mi
Loading nearby amenities…
Taxation est. · year 1
- Rental income
- $17,491
- − Mortgage interest
- −$1,596
- − Property taxes
- −$206
- − Insurance
- −$1,645
- − Repairs & maintenance
- −$1,399
- − Management
- −$1,399
- − Depreciation
- −$829
- Taxable income
- $10,416
- Est. tax owed @ 24.0%
- −$2,500
- After-tax cash flow
- $7,674/yr
For passive investors: Depreciation is non-cash, so a rental often shows a tax loss while cash-flowing — sheltering income. Rental losses are passive: they offset passive income freely, and up to $25,000/yr can offset ordinary (W-2) income if you actively participate and your MAGI is under $100k (phasing out to $0 by $150k); unused losses carry forward. On sale, claimed depreciation is recaptured at up to 25%, and gains may owe capital-gains tax (a 1031 exchange can defer both). Figures are a year-1 estimate at your 24.0% rate — not tax advice; consult a CPA.
Schools (NCES district)
- District
- Lassen View Union Elementary
- NCES district ID
- 0621090
- Math proficiency
- 47% ▲ 4.00%
- Reading proficiency
- 56% ▲ 4.00%
- Median HH income
- $45,781
- Composite
- 43.59/100
- National rank
- #2974
- State rank
- #142 of 517 in CA
Livability — Proberta
- Score
- 37/100
- State rank
- #1425
- US rank
- #27601
Category grades
Schools grade is shown separately in the Schools card above.
Census & demographics
- County
- Tehama County · 31,554 people
- City population
- 95
- Metro
- Red Bluff, CA
- Population (ZIP)
- 31,554
- Household income
- $66,076
- Rent vs Own
- Severe rent burden
- 981.0
Population outlook (Tehama County) Hauer SSP2
- Today (2025)
- 61,058 people
- By 2030
- 59,493 · -2.6%
- By 2040
- 56,076 · -8.2%
- By 2050
- 52,372 · -14.2%
- By 2075
- 43,895 · -28.1%
- By 2100
- 34,186 · -44.0%
Race, ethnicity, and origin ACS 2023
- Neighborhood character
- Predominantly White (71%)
- Race & ethnicity
- White 71% Hispanic / Latino 19% Two or more races 13% Native American 3% Black 2% Asian 1%
- Hispanic origin (detail)
- Mexican 17%
- Common ancestry
- Italian 2% Slovak 2% Lithuanian 2%
- Foreign-born
- 6% · Canada, Vietnam
- Languages at home
- 89% English-only · Spanish 9%
Political lean MEDSL · Tehama
- 2024 margin
- Solid R (+41.8) · D 27.9% · R 69.7% · Other 2.3%
- 2008→2024 swing
- -17.7pp toward R · 2008: -24.1pp · 2024: -41.8pp
- All cycles
- 2024: R+41.8 2020: R+35.6 2016: R+36.8 2012: R+27.4 2008: R+24.1
Not yet ingested
- Civics
- —
Market trends
- HPI YoY
- ▼ -139.80%
- Current HPI
- 246.877
- Rent YoY
- ▲ 0.98%
- Metro
- Red Bluff, CA
- State GDP YoY
- ▲ 3.21%
- F500 in state
- 116
Industry mix (Fortune 500 HQ in CA)
| Industry | F500 HQs | Revenue |
|---|---|---|
| Technology | 27 | $1,492B |
|
||
| Financial Services | 3 | $174B |
|
||
| Retail | 3 | $44B |
|
||
| Insurance | 3 | $26B |
|
||
| Media / Entertainment | 2 | $115B |
|
||
| Pharmaceuticals / Biotech | 2 | $62B |
|
||
Price history
-5.0% since first listed7 events — show timeline
- 2026-04-24 Price Changed $28,500 TCAOR
- 2026-04-22 Price Changed $29,500 TCAOR
- 2026-04-20 Price Changed $27,500 TCAOR
- 2026-03-18 Price Changed $29,995 TCAOR
- 2026-02-13 Price Changed $31,995 TCAOR
- 2026-02-07 Relisted — TCAOR
- 2026-01-15 Listed $29,995 TCAOR
Property tax history
+19.1%/yrLatest (2025): $206 · +567.4% YoY. Source: county tax records.
Cash-flow waterfall
monthlySold comps — $/sqft
last 12 mo · ≤1 miLoading sold comps…