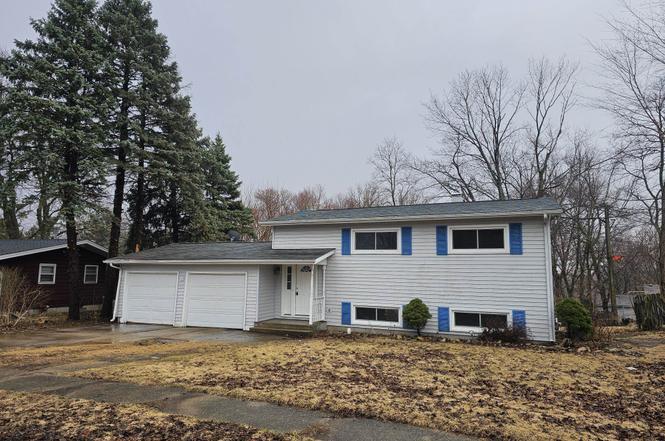
808 Crest View Trl · Byron, IL
Flood risk 1/10 · Minimal
- FEMA flood zone
- X (unshaded)
- Chance of flooding over 30 yrs
- 0.0%
- Est. flood insurance / yr
- $473 – $860
Fire risk 1/10 · Minimal
- Est. fire insurance / yr
- $804 – $1,492
Heat risk 2/10 · Minimal
- Hot days now (above 102°F)
- 7 days/yr
- Hot days in 30 yrs
- 15 days/yr
Wind risk 2/10 · Minimal
- Chance of severe wind over 30 yrs
- —
Air-quality risk 3/10 · Minor
- Unhealthy air days now
- 2 days/yr
- Unhealthy air days in 30 yrs
- 3 days/yr
Risk factors via First Street. Map © Google.
Why this score? — see what drove the D+ grade
The composite is a weighted blend of 9 inputs, each scored 0–100. Each bar is that input's sub-score; the figure is the points it added to the 100-point composite (weight × sub-score).
- Cash flow +16.6/30.0
- ARV discount +7.5/15.0
- DSCR +5.1/10.0
- 1% rule +4.4/10.0
- Schools +4.2/10.0
- Livability +4.0/5.0
- Rent growth +2.5/5.0
- Condition / age +2.5/5.0
- Appreciation +0.0/10.0
$199,900
🖨 Deal sheet 📄 Offer letter ✓ Due diligence
Listing remarks
Welcome home to this charming and move-in ready bi-level featuring 4 spacious bedrooms and 2 full bathrooms. Fresh updates throughout make this home shine, including brand new paint, carpet, LVP flooring in the kitchen and bathrooms, new windows and patio doors and new kitchen stove. Don’t miss your chance to own this adorable, updated home!
Key facts
- New carpet
- New patio doors
- New paint
Tags
Property features AI
Finance
- Other: Annual tax amount reported
Exterior
- Parking: Attached 2-car garage
- Utilities: Public water; Public sewer; Electric service (standard)
- Home design: Single-family residence (house); Residential property
- Construction: Below-grade finished area (basement) approximately 768
- Exterior features: Shingle roof; Lot approximately 0.26 acres
Interior
- Kitchen: Gas cooktop; Microwave; Refrigerator
- Bathrooms: Two full bathrooms; One main-level bathroom
- Heating & cooling: Forced air heating (natural gas); Central air conditioning
- Interior features: Water softener; Full basement
- Laundry & utility: Washer; Gas water heater
Neighborhood map
What this means for you Summary
Snapshot
- This is a 4-bed/2.0-bath single-family listed at $200k.
Deal economics
- At list price, monthly cash flow is $120 ($1k/yr) — positive.
- The deal already cash-flows at list — no discount required.
- To meet the 1% rule (rent ≥ 1% of price), the offer needs to be $189k (5.5% below list).
- Recommended offer: $189k (5.5% below list) — sets the bar for 1% rule.
Location & tenants
- Location reads 81/100 on livability (#100 in IL, #1,602 nationally) — a professional / high-income tenant draw. Strengths: crime A+, cost of living A+, housing A+; Watch: amenities F, commute F.
- Byron CUSD 226 (town): math 45% / reading 50% proficiency, ranked #68 of 620 in IL (top 11%) — families likely to look elsewhere, expect single-tenant / working-renter base with shorter leases; only 17% free/reduced lunch — higher-income household profile.
- Zoned schools: Mary Morgan Elem Sch (math 56% / reading 45%, grade D+, #172 of 2,056 statewide, top 8%, 659 students, 0% FRL); Byron Middle School (math 38% / reading 57%, grade C-, #69 of 665 statewide, top 11%, 350 students, 0% FRL); Byron High School 9-12 (math 32% / reading 42%, grade F, #107 of 693 statewide, top 17%, 457 students, 0% FRL) — zoned schools average 0% FRL vs 17% district-wide (17 pts lower); this property's tenant base skews higher-income than the district average.
- Market conditions: 27 active listings in the ZIP; 113 units permitted in Ogle County in 2024 (67 in 5+ unit buildings).
Forward outlook
- Local home prices are declining (-3.0%/yr); year-one equity from $1k of loan paydown is wiped out by about $6k of value loss. Plan a longer hold.
- Ogle County population projected at -24% by 2050 — secular population decline; favor cash flow + early exit over multi-decade hold.
Negotiation context
- It's been on market 21 days — a 2% lower offer ($197k) is reasonable based on typical stale-listing flexibility.
- 2 sale attempts with the ask held roughly flat each time — persistent listings suggest the price (not the market) is what's stuck; bring a comps-based counter.
- Current owner paid $120k; list at $200k implies a 67% gain — meaningful room to come down on a strong offer.
Questions for the listing agent
- Built in 1970 — when were the roof, HVAC, electrical panel, plumbing, and water heater last replaced?
- Is there a deadline driving the sale (1031 exchange, divorce, estate, relocation)? That informs how much negotiation room exists.
- Schools are B-rated — typically a magnet for longer-tenancy family renters. What's the average tenant stay here, and is there a school-zone premium baked into asking?
- The area grade is low — what's the realistic commute time and amenity access for the typical tenant pool here? Any planned neighborhood developments (good or bad) we should know about?
- What's the average days-on-market for RENTAL listings here right now (not sales)? A rising rental-DOM trend means longer vacancies and softer asking-rent achievability than the comps imply.
- What's the recent tenant-quality profile in this submarket — average credit score on applications, eviction rate, late-payment / NSF rate, and stable-employment percentage? A property-management company in the area should have these aggregated.
- How much new for-sale + rental construction is in the pipeline within 1–3 miles? Heavy new supply typically softens prices + rents 12–24 months out; constrained supply supports both.
Investment metrics
- 1% rule
- 0.94% ✗
- Cap rate
- 7.01%
- Cash-on-cash
- 2.57%
- DSCR
- 1.11
- GRM
- 8.8
CMA / ARV
No comps found within radius.
Projected returns pro-forma
-3.0% appreciation · 3.0% rent growth · sell at horizon
- IRR
- -12.2%
- Equity multiple
- 0.56×
- Total profit
- $-24,724
- Equity at exit
- $29,806
- IRR
- -3.1%
- Equity multiple
- 0.79×
- Total profit
- $-11,593
- Equity at exit
- $17,284
Cash invested: $55,972 (down + closing). Projections, not guarantees.
Landlord ↔ Tenant lean methodology
- Overall (STATE)
- 43 Moderately Tenant-Leaning
- State Illinois
- 43 Moderately Tenant-Leaning · D+7
- County
- — inherits STATE
- City
- — inherits STATE
ZIP-level market 61010
- Home prices YoY
- -27.8%
- Active inventory
- 27
- Price-to-rent
- 8.8×
Monthly cashflow live
- Estimated rent
- $1,888 medium interval (Pro) →
- Mortgage (P&I)
- −$1,048
- Tax from tax record
- −$240 /mo · $2,882/yr
- Insurance
- −$83
- HOA
- −$0
- Vacancy / Maint / Mgmt
- −$397
- Net cashflow
- $120
Break-even live
UW: 25.0% down · 7.5% · 30yr · 1.5% tax · 5.0% vac · 8.0% maint · 8.0% mgmt
Financing live
Cash to close
- Down payment
- $49,975
- Closing costs
- $5,997
- Reserves months
- —
- Total cash needed
- —
Loan-product check · same deal, 3 products live
Conventional
25% down · 7.5% · 30yr
- Down + closing
- —
- Monthly P&I
- —
- Monthly cashflow
- —
- DSCR
- —
- Eligible?
- —
Personal DTI + credit; lowest rate.
DSCR
20% down · 8.5% · 30yr
- Down + closing
- —
- Monthly P&I
- —
- Monthly cashflow
- —
- DSCR
- —
- Eligible?
- —
No personal income docs; deal must DSCR.
Hard money
10% down · 12.0% · 12mo
- Down + closing
- —
- Monthly P&I
- —
- Monthly cashflow
- —
- DSCR
- —
- Eligible?
- —
Short-term bridge; refi at stabilization.
Listing history 6 events
-
2026-05-04status Pending
-
2026-05-04status Active
-
2026-03-31historical
-
2026-03-30historical
-
2026-03-09$199,900 Active
-
2026-01-30soldstatus $119,500
ⓘ Source: listings_history table (triggers on properties + properties_extension) + one-shot
backfill from property_details.listing_events for pre-trigger history.
Tax reassessment forecast IL · Partial reset (capped growth)
- Current annual tax
- $2,882 · $240/mo
- Projected year-2 tax
- $3,710 · $309/mo
- Expected delta
- +$828/yr (+$69/mo · 28.7%)
ⓘ Screening estimate from a state-policy table — verify with the county assessor before closing.
Climate risk First Street
- Flood 1/10 Low FEMA zone X (unshaded) · 0% chance over 30 yrs
- Wildfire 1/10 Low
- Heat 2/10 Low 7 d/yr ≥102°F today · 15 d/yr by 30 yrs out
- Wind 2/10 Low
- Air quality 3/10 Moderate 2 unhealthy d/yr today · 3 by 30 yrs out
Nearby sold comps map
Loading sold comps map…
Walkable amenities ~0.75 mi
Loading nearby amenities…
Taxation est. · year 1
- Rental income
- $22,660
- − Mortgage interest
- −$11,198
- − Property taxes
- −$2,882
- − Insurance
- −$1,000
- − Repairs & maintenance
- −$1,813
- − Management
- −$1,813
- − Depreciation
- −$5,815
- Taxable loss
- −$1,860
- Est. tax savings @ 24.0%
- +$446
- After-tax cash flow
- $1,887/yr
For passive investors: Depreciation is non-cash, so a rental often shows a tax loss while cash-flowing — sheltering income. Rental losses are passive: they offset passive income freely, and up to $25,000/yr can offset ordinary (W-2) income if you actively participate and your MAGI is under $100k (phasing out to $0 by $150k); unused losses carry forward. On sale, claimed depreciation is recaptured at up to 25%, and gains may owe capital-gains tax (a 1031 exchange can defer both). Figures are a year-1 estimate at your 24.0% rate — not tax advice; consult a CPA.
Schools (NCES district)
- District
- Byron CUSD 226
- NCES district ID
- 1708010
- Math proficiency
- 45% ▼ -12.00%
- Reading proficiency
- 50% ▼ -11.00%
- Median HH income
- $66,582
- Composite
- 42.28/100
- National rank
- #3267
- State rank
- #68 of 620 in IL
Livability — Byron
- Score
- 81/100
- State rank
- #100
- US rank
- #1602
Category grades
Schools grade is shown separately in the Schools card above.
Census & demographics
- Census place
- Byron, IL
- City population
- 7,494
- Population (ZIP)
- 7,494
Population outlook (Ogle County) Hauer SSP2
- Today (2025)
- 48,390 people
- By 2030
- 46,346 · -4.2%
- By 2040
- 41,772 · -13.7%
- By 2050
- 36,911 · -23.7%
- By 2075
- 27,130 · -43.9%
- By 2100
- 18,627 · -61.5%
Race, ethnicity, and origin ACS 2023
- Neighborhood character
- Predominantly White (87%)
- Race & ethnicity
- White 87% Hispanic / Latino 9% Two or more races 7%
- Hispanic origin (detail)
- Mexican 8%
- Common ancestry
- Romanian 5% Portuguese 4% Lithuanian 1%
- Foreign-born
- 4% · Canada, South Korea
- Languages at home
- 94% English-only · Spanish 6%
Political lean MEDSL · Ogle
- 2024 margin
- Strong R (+29.4) · D 34.5% · R 63.9% · Other 1.6%
- 2008→2024 swing
- -21.8pp toward R · 2008: -7.6pp · 2024: -29.4pp
- All cycles
- 2024: R+29.4 2020: R+25.9 2016: R+26.6 2012: R+16.7 2008: R+7.6
Not yet ingested
- Civics
- —
Market trends
- HPI YoY
- ▼ -66.23%
- Current HPI
- 171.8623
- Rent YoY
- —
- Metro
- —
- State GDP YoY
- ▲ 1.59%
- F500 in state
- 60
Industry mix (Fortune 500 HQ in IL)
| Industry | F500 HQs | Revenue |
|---|---|---|
| Insurance | 4 | $201B |
|
||
| Consumer Goods | 4 | $87B |
|
||
| Industrial Machinery | 3 | $64B |
|
||
| Healthcare | 2 | $55B |
|
||
| Retail / Pharmacy | 1 | $148B |
|
||
| Agriculture / Food | 1 | $86B |
|
||
Price history
+67.3% since first listed6 events — show timeline
- 2026-05-04 Pending — NWIAR
- 2026-05-04 Relisted — NWIAR
- 2026-03-31 Delisted — NWIAR
- 2026-03-30 Listing Removed — MRED as Distributed by MLS Grid
- 2026-03-09 Listed $199,900 NWIAR
- 2026-01-30 Sold (Public Records) $119,500 Public Records
Property tax history
+4.4%/yrLatest (2024): $2,882 · +9.1% YoY. Source: county tax records.
Cash-flow waterfall
monthlySold comps — $/sqft
last 12 mo · ≤1 miLoading sold comps…