14692 Via Fiesta #10 · San Diego, CA
Flood risk 1/10 · Minimal
- FEMA flood zone
- X (unshaded)
- Chance of flooding over 30 yrs
- 0.0%
- Est. flood insurance / yr
- $507 – $1,088
Fire risk 4/10 · Minor
- Est. fire insurance / yr
- $659 – $1,223
Heat risk 4/10 · Minor
- Hot days now (above 91°F)
- 7 days/yr
- Hot days in 30 yrs
- 19 days/yr
Wind risk 1/10 · Minimal
- Chance of severe wind over 30 yrs
- —
Air-quality risk 4/10 · Minor
- Unhealthy air days now
- 4 days/yr
- Unhealthy air days in 30 yrs
- 5 days/yr
Risk factors via First Street. Map © Google.
Why this score? — see what drove the D+ grade
The composite is a weighted blend of 9 inputs, each scored 0–100. Each bar is that input's sub-score; the figure is the points it added to the 100-point composite (weight × sub-score).
- Cash flow +15.0/30.0
- ARV discount +7.5/15.0
- Appreciation +5.1/10.0
- DSCR +4.6/10.0
- 1% rule +4.5/10.0
- Livability +3.8/5.0
- Rent growth +3.2/5.0
- Schools +2.7/10.0
- Condition / age +2.5/5.0
$429,492
🖨 Deal sheet 📄 Offer letter ✓ Due diligence
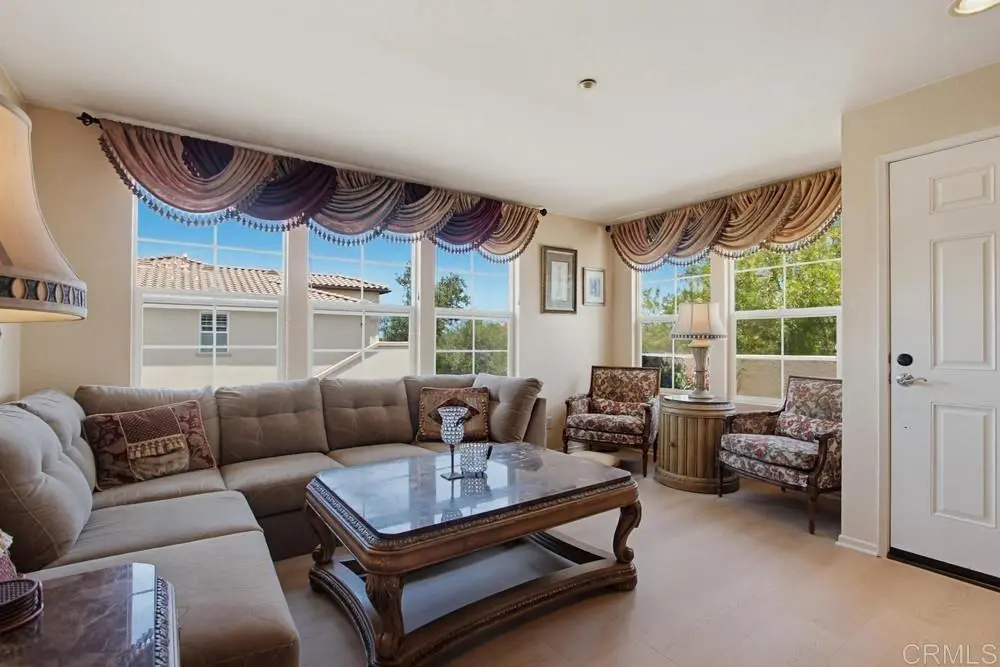
Listing remarks
* * Deed Restricted Unit * * DO NOT CONTACT SDHC DIRECTLY. Buyer must meet income and qualifications guidelines. Welcome to this fabulous 3-bedroom, 2-bath upper-level condo, perfectly positioned on a premier corner lot within the highly desirable Sycamore Walk community. This thoughtfully designed home delivers an incredible layout, anchored by an open kitchen that naturally expands the living space. The primary suite features its own private bathroom and a walk-in closet, while a dedicated indoor laundry closet adds everyday convenience. Complete with a detached 1-car garage, the property offers exclusive access to resort-style amenities, including a sparkling pool and a rentable clubh
Key facts
- Rentable clubhouse
- Walk-in closet
- Private bathroom
Tags
Property features AI
Finance
- Other: Zoned R-1 (single family residential)
- Financial info: Property subject to Mello-Roos assessments
- HOA & community: Part of an association (Santaluz Sycamore Walk); Monthly HOA fee of $345; Association amenities include pool and clubhouse; pet rules apply; Community of 120 units
Exterior
- Parking: 1 garage space; 1 total parking space
- Utilities: Public sewer
- Home design: Attached property; End unit with 2+ common walls; Single-story / 1 total story
- Construction: Living area and lot size per public records
- Exterior features: Community pool; Curbs and sidewalks; Suburban setting
Interior
- Kitchen: Kitchen (listed as a room)
- Bedrooms: Walk-in closet listed (bedroom feature)
- Bathrooms: 2 full bathrooms
- Interior features: One-level home; Entry on level 2; Has a view; Walk-in closet
- Laundry & utility: In-closet laundry; Washer hookup (washer and dryer excluded from sale)
Neighborhood map
What this means for you Summary
Snapshot
- This is a 3-bed/2.0-bath condo listed at $429k.
Deal economics
- At list price, monthly cash flow is $132 ($2k/yr) — positive.
- The deal already cash-flows at list — no discount required.
- To meet the 1% rule (rent ≥ 1% of price), the offer needs to be $409k (4.9% below list).
- Recommended offer: $409k (4.9% below list) — sets the bar for 1% rule.
- Cap rate 6.7% vs local median 2.0% in San Diego — top-decile yield for the area; either an underpriced asset or a hidden risk that comps aren't pricing in. Stress-test before assuming the spread holds.
Location & tenants
- Location reads 75/100 on livability (#123 in CA, #4,206 nationally) — a middle-class / working-renter tenant base. Strengths: amenities A+, commute A+, employment A+; Watch: health & safety C-, crime D+, cost of living F.
- Poway Unified (urban): math 25% / reading 25% proficiency, ranked #317 of 517 in CA (top 61%) — low school quality limits family demand, transient renter base, plan for 1-2y turnover; only 12% free/reduced lunch — higher-income household profile.
- Market conditions: Rents rising (+2.7%/yr); 169 active listings in the ZIP; high-income renter base; 11,759 units permitted in San Diego County in 2024 (7,244 in 5+ unit buildings).
Forward outlook
- In year one you build about $4k of equity ($3k loan paydown + $678 appreciation (0.2% local appreciation)).
- San Diego County population projected at +20% by 2050 — long-run rental-demand tailwind backs the buy-and-hold thesis.
- By year 8, paydown + projected appreciation supports a ~$35k cash-out refi (75% LTV) — recoverable capital for the next deal without selling this one.
Negotiation context
- Only 6 days on market — expect competitive offers; lowballing is unlikely to land.
Questions for the listing agent
- What does the HOA fee cover, when was the last increase, and are there any pending special assessments or reserve-fund shortfalls?
- Any open or pending special assessments — roof, HVAC, plumbing, elevator, façade? What's the per-unit balance and payoff schedule, and is the seller paying it off at close or rolling it to the buyer?
- Is there a deadline driving the sale (1031 exchange, divorce, estate, relocation)? That informs how much negotiation room exists.
- Schools are B-rated — typically a magnet for longer-tenancy family renters. What's the average tenant stay here, and is there a school-zone premium baked into asking?
- Crime grade is D in this area — have there been break-ins, vandalism, or insurance claims at this property in the last 3 years? What carrier currently insures it and at what premium?
- The area grade is low — what's the realistic commute time and amenity access for the typical tenant pool here? Any planned neighborhood developments (good or bad) we should know about?
- What's the average days-on-market for RENTAL listings here right now (not sales)? A rising rental-DOM trend means longer vacancies and softer asking-rent achievability than the comps imply.
- What's the recent tenant-quality profile in this submarket — average credit score on applications, eviction rate, late-payment / NSF rate, and stable-employment percentage? A property-management company in the area should have these aggregated.
- How much new apartment / multifamily construction is in the pipeline within 1–3 miles? Heavy new supply (>2% of stock underway) typically softens rents 12–24 months out; light construction supports rent growth.
Investment metrics
- 1% rule
- 0.95% ✗
- Cap rate
- 6.66%
- Cash-on-cash
- 1.32%
- DSCR
- 1.06
- GRM
- 8.8
CMA / ARV
No comps found within radius.
Projected returns pro-forma
0.16% appreciation · 2.71% rent growth · sell at horizon
- IRR
- -0.3%
- Equity multiple
- 0.98×
- Total profit
- $-1,979
- Equity at exit
- $128,111
- IRR
- 4.9%
- Equity multiple
- 1.54×
- Total profit
- $64,840
- Equity at exit
- $156,735
Cash invested: $120,258 (down + closing). Projections, not guarantees.
Landlord ↔ Tenant lean methodology
- Overall (STATE)
- 18 Strongly Tenant-Friendly
- State California
- 18 Strongly Tenant-Friendly · D+13
- County
- — inherits STATE
- City
- — inherits STATE
ZIP-level market 92127
- Home prices YoY
- 0.0%
- Rents YoY
- 2.7%
- Active inventory
- 169
- Price-to-rent
- 8.8×
Monthly cashflow live
- Estimated rent
- $4,086 medium interval (Pro) →
- Mortgage (P&I)
- −$2,252
- Tax from tax record
- −$319 /mo · $3,832/yr
- Insurance
- −$179
- HOA
- −$345
- Vacancy / Maint / Mgmt
- −$858
- Net cashflow
- $132
Break-even live
UW: 25.0% down · 7.5% · 30yr · 1.5% tax · 5.0% vac · 8.0% maint · 8.0% mgmt
Financing live
Cash to close
- Down payment
- $107,373
- Closing costs
- $12,885
- Reserves months
- —
- Total cash needed
- —
Loan-product check · same deal, 3 products live
Conventional
25% down · 7.5% · 30yr
- Down + closing
- —
- Monthly P&I
- —
- Monthly cashflow
- —
- DSCR
- —
- Eligible?
- —
Personal DTI + credit; lowest rate.
DSCR
20% down · 8.5% · 30yr
- Down + closing
- —
- Monthly P&I
- —
- Monthly cashflow
- —
- DSCR
- —
- Eligible?
- —
No personal income docs; deal must DSCR.
Hard money
10% down · 12.0% · 12mo
- Down + closing
- —
- Monthly P&I
- —
- Monthly cashflow
- —
- DSCR
- —
- Eligible?
- —
Short-term bridge; refi at stabilization.
HOA detail condo
- Monthly dues
- $345 · $4,140/yr
- Likely covers
- pool
- Assessments
- None detected in remarks — confirm with the listing agent.
Listing history 6 events
-
2026-06-18days on market $429,492 Active 6 DOM
-
2026-06-17days on market $429,492 Active 5 DOM
-
2026-06-16days on market $429,492 Active 4 DOM
-
2026-06-15days on market $429,492 Active 3 DOM
-
2026-06-13remarks 699-char remark
-
2026-06-13$429,492 Active 1 DOM
ⓘ Source: listings_history table (triggers on properties + properties_extension) + one-shot
backfill from property_details.listing_events for pre-trigger history.
Tax reassessment forecast CA · Resets to sale price
- Current annual tax
- $3,832 · $319/mo
- Projected year-2 tax
- $3,832 · $319/mo
- Expected delta
- $0/yr ($0/mo · 0.0%)
ⓘ Screening estimate from a state-policy table — verify with the county assessor before closing.
Climate risk First Street
- Flood 1/10 Low FEMA zone X (unshaded) · 0% chance over 30 yrs
- Wildfire 4/10 Moderate
- Heat 4/10 Moderate 7 d/yr ≥91°F today · 19 d/yr by 30 yrs out
- Wind 1/10 Low
- Air quality 4/10 Moderate 4 unhealthy d/yr today · 5 by 30 yrs out
Nearby sold comps map
Loading sold comps map…
Walkable amenities ~0.75 mi
Loading nearby amenities…
Taxation est. · year 1
- Rental income
- $49,034
- − Mortgage interest
- −$24,058
- − Property taxes
- −$3,832
- − Insurance
- −$2,147
- − Repairs & maintenance
- −$3,923
- − Management
- −$3,923
- − HOA
- −$4,140
- − Depreciation
- −$12,494
- Taxable loss
- −$5,483
- Est. tax savings @ 24.0%
- +$1,316
- After-tax cash flow
- $2,906/yr
For passive investors: Depreciation is non-cash, so a rental often shows a tax loss while cash-flowing — sheltering income. Rental losses are passive: they offset passive income freely, and up to $25,000/yr can offset ordinary (W-2) income if you actively participate and your MAGI is under $100k (phasing out to $0 by $150k); unused losses carry forward. On sale, claimed depreciation is recaptured at up to 25%, and gains may owe capital-gains tax (a 1031 exchange can defer both). Figures are a year-1 estimate at your 24.0% rate — not tax advice; consult a CPA.
Schools (NCES district)
- District
- Poway Unified
- NCES district ID
- 0631530
- Math proficiency
- 25% ▼ -45.00%
- Reading proficiency
- 25% ▼ -50.00%
- Median HH income
- $102,903
- Composite
- 27.12/100
- National rank
- #7036
- State rank
- #317 of 517 in CA
Livability — San Diego
- Score
- 75/100
- State rank
- #123
- US rank
- #4206
Category grades
Schools grade is shown separately in the Schools card above.
Census & demographics
- Census place
- San Diego, CA
- County
- San Diego County · 3,178,799 people
- City population
- 1,397,612
- Metro
- San Diego-Chula Vista-Carlsbad, CA
- Population (ZIP)
- 50,555
- Household income
- $195,520
- Rent vs Own
- Severe rent burden
- 1105.0
Population outlook (San Diego County) Hauer SSP2
- Today (2025)
- 3,678,185 people
- By 2030
- 3,856,546 · +4.8%
- By 2040
- 4,171,407 · +13.4%
- By 2050
- 4,421,607 · +20.2%
- By 2075
- 4,831,599 · +31.4%
- By 2100
- 4,832,502 · +31.4%
Race, ethnicity, and origin ACS 2023
- Neighborhood character
- Diverse neighborhood (Simpson 0.65)
- Race & ethnicity
- White 49% Asian 32% Two or more races 13% Hispanic / Latino 8% Black 2%
- Hispanic origin (detail)
- Mexican 5%
- Common ancestry
- Italian 3% Lithuanian 2% Romanian 2%
- Foreign-born
- 30% · China, Canada, South Korea
- Languages at home
- 64% English-only · Other Indo-European 12% Chinese 6% Spanish 3%
Political lean MEDSL · San Diego
- 2024 margin
- D (+16.8) · D 56.9% · R 40.1% · Other 2.9%
- 2008→2024 swing
- +6.6pp toward D · 2008: 10.2pp · 2024: 16.8pp
- All cycles
- 2024: D+16.8 2020: D+22.8 2016: D+17.8 2012: D+5.1 2008: D+10.2
Not yet ingested
- Civics
- —
Market trends
- HPI YoY
- ▲ 0.16%
- Current HPI
- 417.8222
- Rent YoY
- ▲ 2.71%
- Metro
- San Diego-Chula Vista-Carlsbad, CA
- State GDP YoY
- ▲ 3.21%
- F500 in state
- 116
Industry mix (Fortune 500 HQ in CA)
| Industry | F500 HQs | Revenue |
|---|---|---|
| Technology | 27 | $1,492B |
|
||
| Financial Services | 3 | $174B |
|
||
| Retail | 3 | $44B |
|
||
| Insurance | 3 | $26B |
|
||
| Media / Entertainment | 2 | $115B |
|
||
| Pharmaceuticals / Biotech | 2 | $62B |
|
||
Price history
1 event — show timeline
- 2026-06-13 Listed $429,492 CRMLS
Property tax history
+4.7%/yrLatest (2025): $3,832 · +2.1% YoY. Source: county tax records.
Cash-flow waterfall
monthlySold comps — $/sqft
last 12 mo · ≤1 miLoading sold comps…