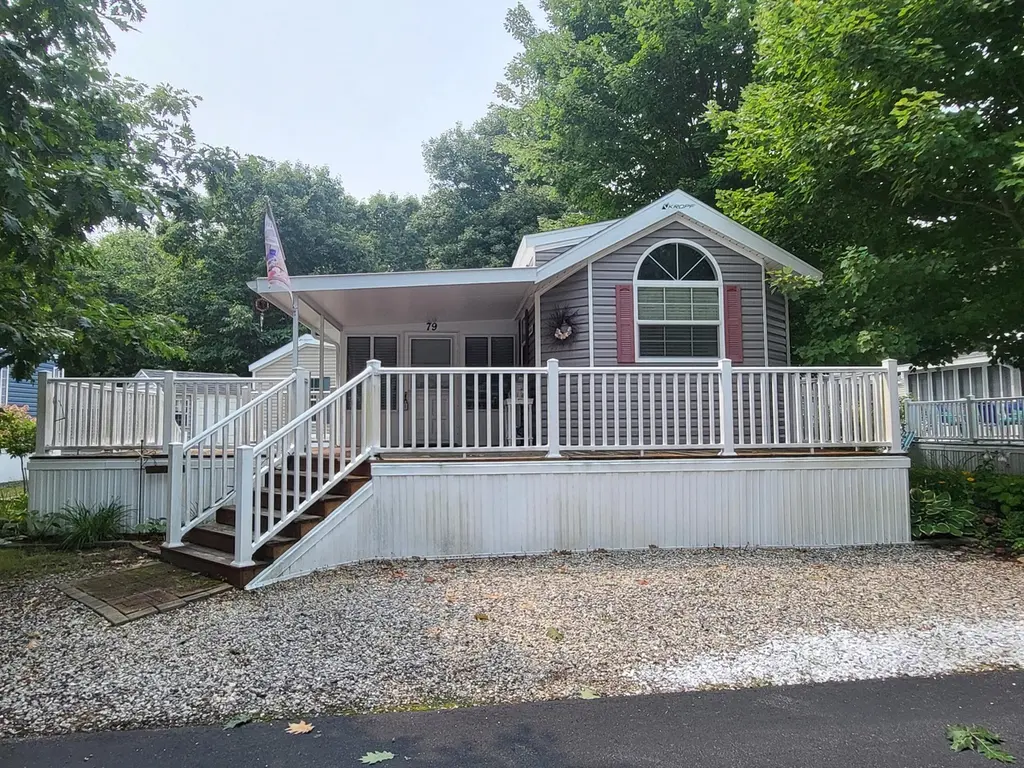
79 Kenzie Trl · Old Orchard Beach, ME
Flood risk 1/10 · Minimal
- FEMA flood zone
- X
- Chance of flooding over 30 yrs
- 0.0%
- Est. flood insurance / yr
- $507 – $1,088
Fire risk 1/10 · Minimal
- Est. fire insurance / yr
- $669 – $1,243
Heat risk 4/10 · Minor
- Hot days now (above 89°F)
- 7 days/yr
- Hot days in 30 yrs
- 17 days/yr
Wind risk 6/10 · Moderate
- Chance of severe wind over 30 yrs
- 57.0%
Air-quality risk 2/10 · Minimal
- Unhealthy air days now
- 1 days/yr
- Unhealthy air days in 30 yrs
- 1 days/yr
Risk factors via First Street. Map © Google.
Why this score? — see what drove the B grade
The composite is a weighted blend of 9 inputs, each scored 0–100. Each bar is that input's sub-score; the figure is the points it added to the 100-point composite (weight × sub-score).
- Cash flow +30.0/30.0
- 1% rule +10.0/10.0
- DSCR +10.0/10.0
- Schools +6.7/10.0
- ARV discount +5.6/15.0
- Condition / age +3.8/5.0
- Rent growth +3.7/5.0
- Livability +3.4/5.0
- Appreciation +0.0/10.0
$90,000
🖨 Deal sheet 📄 Offer letter ✓ Due diligence
Listing remarks
Stunning Park model with cathedral ceiling sleeps 6. Less than 2 miles from famed Old Orchard Beach. Resort includes cable water sewer trash and offers playground heated pool clubhouse hot tub grill area fire pit and dog park. Large 3 season room with 2 beds. Stove dishwasher and refrigerator to remain. Beautiful gated community. 2 golf courses nearby. Many restaurants and stores in the area. Portland is 20 minutes away. 2nd floor room off the livingroom is bright and sunny. Train station is also near
Key facts
- Gated community
- 3 season room
- Clubhouse
Tags
Property features AI
Finance
- Financial info: Annual taxes reported for 2025
- HOA & community: Land lease property
Exterior
- Parking: Gravel parking with 1–4 spaces
- Utilities: Electric with circuit breakers; Private sewer; Seasonal water source; Electric water heater
- Home design: Mobile home; Built in 2015; Flat roof
- Construction: Mobile construction; Seller-reported building area: 630 sq ft
- Exterior features: Near golf course; Near public beach; Near shopping; Paved road access
Interior
- Bedrooms: One bedroom on the first level
- Flooring: Carpet; Vinyl
- Bathrooms: 1 full bathroom
- Heating & cooling: Forced air heating; Central air conditioning
- Interior features: Sunroom on the first level; Living room on the first level; Additional upper-level room; Total of 4 rooms
Neighborhood map
What this means for you Summary
Snapshot
- This is a 1-bed/1.0-bath manufactured listed at $90k. Condition is rated good.
Deal economics
- At list price, monthly cash flow is $687 ($8k/yr) — positive.
- The deal already cash-flows at list — no discount required.
- Meets the 1% rule at list price ($2k rent vs $90k).
- Recommended offer: $89k (1.5% below list) — sets the bar for market timing.
- Cap rate 15.5% vs local median 2.1% in Old Orchard Beach — top-decile yield for the area; either an underpriced asset or a hidden risk that comps aren't pricing in. Stress-test before assuming the spread holds.
Location & tenants
- Location reads 68/100 on livability (#88 in ME) — a middle-class / working-renter tenant base. Strengths: crime A+, housing A+, cost of living B+; Watch: schools D, amenities F, commute F.
- RSU 23 (suburban): math 78% / reading 80% proficiency, ranked #87 of 112 in ME (top 78%) — strong family-tenant draw, lease renewals of 3-5y typical.
- Market conditions: Rents rising fast (+4.9%/yr); 171 active listings in the ZIP; 1,386 units permitted in York County in 2024 (338 in 5+ unit buildings).
- This rent runs 33% of the median local income ($60k/yr) — at the standard rent-burdened threshold; future hikes will face affordability resistance.
Forward outlook
- Local home prices are declining (-3.0%/yr); year-one equity from $622 of loan paydown is wiped out by about $3k of value loss. Plan a longer hold.
- At projected returns (-3.0% appreciation + 4.9% rent growth), your $25k cash investment doubles in ~4 years — after that, you're playing with house money.
Negotiation context
- It's been on market 23 days — a 2% lower offer ($89k) is reasonable based on typical stale-listing flexibility.
Risks & watch-outs
- Climate carrying-cost: major wind risk, 57% chance of damaging wind over 30y — expect insurance premiums to compound above CPI over the hold.
Questions for the listing agent
- Is there a deadline driving the sale (1031 exchange, divorce, estate, relocation)? That informs how much negotiation room exists.
- Schools are D-rated, which usually means shorter tenancies and higher turnover. Who's the typical renter profile here, and what's been the actual vacancy rate?
- What's the average days-on-market for RENTAL listings here right now (not sales)? A rising rental-DOM trend means longer vacancies and softer asking-rent achievability than the comps imply.
- What's the recent tenant-quality profile in this submarket — average credit score on applications, eviction rate, late-payment / NSF rate, and stable-employment percentage? A property-management company in the area should have these aggregated.
- How much new for-sale + rental construction is in the pipeline within 1–3 miles? Heavy new supply typically softens prices + rents 12–24 months out; constrained supply supports both.
Investment metrics
- 1% rule
- 1.84% ✓
- Cap rate
- 15.45%
- Cash-on-cash
- 32.72%
- DSCR
- 2.46
- GRM
- 4.5
CMA / ARV
- ARV (on-the-fly)
- $86,310
- Comps found
- 4
Show comp detail 4 sales within ~0.75 mi
| Address | Dist | Beds/Ba | Sqft | Sold | Price | $/sf | Match |
|---|---|---|---|---|---|---|---|
| 1 Seacoast Ln #52 | 0.07mi | 2/1.0 (+1) | 636 (+1%) | 9mo | $90,000 | $142 | 82 |
| 1 Seacoast Ln #100 | 0.15mi | 2/1.0 (+1) | 636 (+1%) | 10mo | $87,000 | $137 | 78 |
| 13 Seacoast Trl | 0.12mi | 2/1.0 (+1) | 638 (+1%) | 23mo | $78,000 | $122 | 68 |
| 1 Seacoast Ln #98 | 0.03mi | 1/1.0 | 720 (+14%) | 21mo | $95,000 | $132 | 57 |
Match score weights: distance 35% · size 25% · config 20% · recency 20%. Top-matched comps best support the ARV.
Projected returns pro-forma
-3.0% appreciation · 4.93% rent growth · sell at horizon
- IRR
- 30.0%
- Equity multiple
- 2.29×
- Total profit
- $32,482
- Equity at exit
- $13,419
- IRR
- 38.4%
- Equity multiple
- 4.92×
- Total profit
- $98,737
- Equity at exit
- $7,782
Cash invested: $25,200 (down + closing). Projections, not guarantees.
Landlord ↔ Tenant lean methodology
- Overall (STATE)
- 41 Moderately Tenant-Leaning
- State Maine
- 41 Moderately Tenant-Leaning · D+2
- County
- — inherits STATE
- City
- — inherits STATE
ZIP-level market 04064
- Home prices YoY
- -11.6%
- Rents YoY
- 4.9%
- Active inventory
- 171
- Price-to-rent
- 4.5×
Monthly cashflow live
- Estimated rent
- $1,657 medium interval (Pro) →
- Mortgage (P&I)
- −$472
- Tax est. 1.5%
- −$112 /mo · $1,350/yr
- Insurance
- −$38
- HOA
- −$0
- Vacancy / Maint / Mgmt
- −$348
- Net cashflow
- $687
Break-even live
UW: 25.0% down · 7.5% · 30yr · 1.5% tax · 5.0% vac · 8.0% maint · 8.0% mgmt
Financing live
Cash to close
- Down payment
- $22,500
- Closing costs
- $2,700
- Reserves months
- —
- Total cash needed
- —
Loan-product check · same deal, 3 products live
Conventional
25% down · 7.5% · 30yr
- Down + closing
- —
- Monthly P&I
- —
- Monthly cashflow
- —
- DSCR
- —
- Eligible?
- —
Personal DTI + credit; lowest rate.
DSCR
20% down · 8.5% · 30yr
- Down + closing
- —
- Monthly P&I
- —
- Monthly cashflow
- —
- DSCR
- —
- Eligible?
- —
No personal income docs; deal must DSCR.
Hard money
10% down · 12.0% · 12mo
- Down + closing
- —
- Monthly P&I
- —
- Monthly cashflow
- —
- DSCR
- —
- Eligible?
- —
Short-term bridge; refi at stabilization.
Listing history 15 events
-
2026-06-18days on market $90,000 Active 23 DOM
-
2026-06-17days on market $90,000 Active 22 DOM
-
2026-06-16days on market $90,000 Active 21 DOM
-
2026-06-15days on market $90,000 Active 20 DOM
-
2026-06-14days on market $90,000 Active 18 DOM
-
2026-06-10days on market $90,000 Active 15 DOM
-
2026-06-09days on market $90,000 Active 14 DOM
-
2026-06-08days on market $90,000 Active 13 DOM
-
2026-06-07days on market $90,000 Active 12 DOM
-
2026-06-03days on market $90,000 Active 8 DOM
-
2026-06-02days on market $90,000 Active 7 DOM
-
2026-06-01days on market $90,000 Active 6 DOM
-
2026-05-31days on market $90,000 Active 5 DOM
-
2026-05-30days on market $90,000 Active 4 DOM
-
2026-05-26$90,000 Active
ⓘ Source: listings_history table (triggers on properties + properties_extension) + one-shot
backfill from property_details.listing_events for pre-trigger history.
Climate risk First Street
- Flood 1/10 Low FEMA zone X · 0% chance over 30 yrs
- Wildfire 1/10 Low
- Heat 4/10 Moderate 7 d/yr ≥89°F today · 17 d/yr by 30 yrs out
- Wind 6/10 Major 57% chance of damaging wind over 30 yrs
- Air quality 2/10 Low 1 unhealthy d/yr today · 1 by 30 yrs out
Nearby sold comps map
Loading sold comps map…
Walkable amenities ~0.75 mi
Loading nearby amenities…
Taxation est. · year 1
- Rental income
- $19,885
- − Mortgage interest
- −$5,041
- − Property taxes
- −$1,350
- − Insurance
- −$450
- − Repairs & maintenance
- −$1,591
- − Management
- −$1,591
- − Depreciation
- −$2,618
- Taxable income
- $7,243
- Est. tax owed @ 24.0%
- −$1,738
- After-tax cash flow
- $6,507/yr
For passive investors: Depreciation is non-cash, so a rental often shows a tax loss while cash-flowing — sheltering income. Rental losses are passive: they offset passive income freely, and up to $25,000/yr can offset ordinary (W-2) income if you actively participate and your MAGI is under $100k (phasing out to $0 by $150k); unused losses carry forward. On sale, claimed depreciation is recaptured at up to 25%, and gains may owe capital-gains tax (a 1031 exchange can defer both). Figures are a year-1 estimate at your 24.0% rate — not tax advice; consult a CPA.
Condition & rehab AI · 12 photos
This manufactured home is in good condition with cosmetic updates needed to enhance its curb appeal and interior. It's located in a gated community with amenities, making it a good investment.
Value-add opportunities
- Both update flooring to hardwood — enhances curb appeal and interior
- Both paint interior walls — refreshes the space and enhances curb appeal
- Both replace window treatments — modernizes the space and enhances curb appeal
Renovation cost estimate screening
Value-add ROI direction
- Both update flooring to hardwood — enhances curb appeal and interior ↑
- Both paint interior walls — refreshes the space and enhances curb appeal ↑
- Both replace window treatments — modernizes the space and enhances curb appeal ↑
ⓘ Cost ranges are severity-bucket heuristics (US national rule-of-thumb). Get contractor quotes + a written scope before underwriting a rehab budget.
Schools (NCES district)
- District
- RSU 23
- NCES district ID
- 2314784
- Math proficiency
- 78% ▲ 51.00%
- Reading proficiency
- 80% ▲ 27.00%
- Median HH income
- $49,630
- Composite
- 66.79/100
- National rank
- #406
- State rank
- #87 of 112 in ME
Livability — Old Orchard Beach
- Score
- 68/100
- State rank
- #88
- US rank
- #9943
Category grades
Schools grade is shown separately in the Schools card above.
Census & demographics
- Census place
- Old Orchard Beach, ME
- County
- York County · 80,026 people
- City population
- 8,632
- Metro
- Portland-South Portland, ME
- Population (ZIP)
- 8,632
- Household income
- $59,887
- Rent vs Own
- Severe rent burden
- 441.0
Population outlook (York County) Hauer SSP2
- Today (2025)
- 209,961 people
- By 2030
- 212,816 · +1.4%
- By 2040
- 214,360 · +2.1%
- By 2050
- 210,350 · +0.2%
- By 2075
- 201,686 · -3.9%
- By 2100
- 183,392 · -12.7%
Race, ethnicity, and origin ACS 2023
- Neighborhood character
- Predominantly White (90%)
- Race & ethnicity
- White 90% Two or more races 6% Hispanic / Latino 3% Black 1% Native American 1%
- Common ancestry
- Lithuanian 9% Slovak 7% Romanian 3%
- Foreign-born
- 6% · Canada
- Languages at home
- 91% English-only · French/Haitian/Cajun 6% Russian/Polish/Slavic 1% Other Indo-European 1%
Political lean MEDSL · York
- 2024 margin
- D (+10.5) · D 54.3% · R 43.8% · Other 1.9%
- 2008→2024 swing
- -10.1pp toward R · 2008: 20.5pp · 2024: 10.5pp
- All cycles
- 2024: D+10.5 2020: D+12.6 2016: D+4.8 2012: D+16.4 2008: D+20.5
Not yet ingested
- Civics
- —
Market trends
- HPI YoY
- ▼ -64.32%
- Current HPI
- 489.543
- Rent YoY
- ▲ 4.93%
- Metro
- Portland-South Portland, ME
- State GDP YoY
- —
- F500 in state
- 0
Price history
1 event — show timeline
- 2026-05-26 Listed $90,000 MREIS
Cash-flow waterfall
monthlySold comps — $/sqft
last 12 mo · ≤1 miLoading sold comps…