287 S Oak St · Whitwell, TN
Flood risk 1/10 · Minimal
- FEMA flood zone
- X (unshaded)
- Chance of flooding over 30 yrs
- 0.0%
- Est. flood insurance / yr
- $507 – $1,088
Fire risk 5/10 · Moderate
- Est. fire insurance / yr
- $949 – $1,763
Heat risk 5/10 · Moderate
- Hot days now (above 105°F)
- 8 days/yr
- Hot days in 30 yrs
- 22 days/yr
Wind risk 4/10 · Minor
- Chance of severe wind over 30 yrs
- 10.0%
Air-quality risk 3/10 · Minor
- Unhealthy air days now
- 2 days/yr
- Unhealthy air days in 30 yrs
- 2 days/yr
Risk factors via First Street. Map © Google.
Why this score? — see what drove the C- grade
The composite is a weighted blend of 9 inputs, each scored 0–100. Each bar is that input's sub-score; the figure is the points it added to the 100-point composite (weight × sub-score).
- ARV discount +15.0/15.0
- Cash flow +12.6/30.0
- Appreciation +7.4/10.0
- DSCR +3.8/10.0
- Livability +2.8/5.0
- Rent growth +2.5/5.0
- Condition / age +2.5/5.0
- 1% rule +2.4/10.0
- Schools +2.1/10.0
$164,000
🖨 Deal sheet (PDF) 📄 Offer letter ✓ Due diligence
Listing remarks
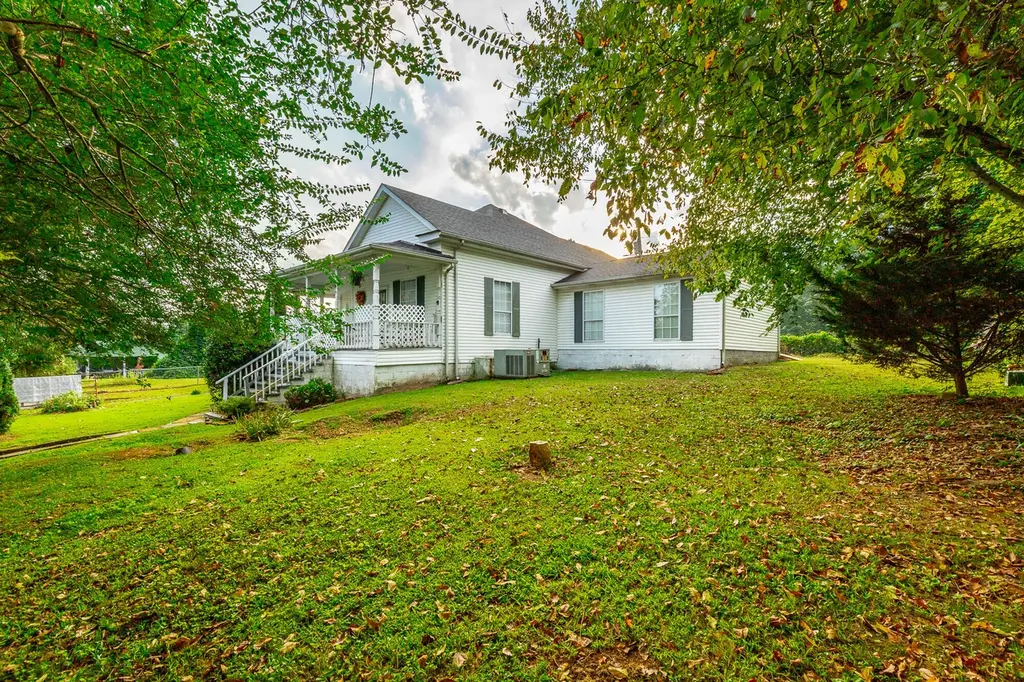
Welcome to 287 S Oak Street, Whitwell, TN. This 3 bedroom, 2 bath home offers over 2,200 sq ft of space and sits on a peaceful lot that invites you to slow down and enjoy small-town living. The home has a new roof (30-yr architectural shingles) installed in 2024, adding some peace of mind for the next owner. Relax on the inviting front porch, or step into the backyard where mountain views provide a serene backdrop and, on occasion, you can even catch sight of base jumpers gliding from the distant mountain cliffs above. The home is being sold AS IS, giving the next owner the perfect opportunity to bring fresh vision and updates that reflect their personal style. With its generous square foot
Key facts
- Brand new roof
- Front porch
- Backyard
Tags
Property features AI
Exterior
- Parking: Carport; Driveway (paved); Off-street parking
- Utilities: Public water; Septic tank; Electricity connected; Cable available; Phone available; Water connected
- Home design: Single-family residence; Residential property
- Construction: Built with block and vinyl siding; Other construction materials; Block and stone foundation; Shingle roof
- Exterior features: Private yard; Front yard; Back yard; Full fencing; Front porch; Rain gutters; Views
Interior
- Bathrooms: 2 full bathrooms
- Heating & cooling: Central heating (natural gas); Central air conditioning (electric)
- Interior features: Fireplace; Ceiling fans
Neighborhood map
What this means for you Summary
Snapshot
- This is a 3-bed/1.0-bath single-family listed at $164k.
Deal economics
- At list price, monthly cash flow is $-20 ($-241/yr) — negative.
- To cash-flow at today's rent, offer at most $160k (2.2% below list).
- To meet the 1% rule (rent ≥ 1% of price), the offer needs to be $121k (26.1% below list).
- Recommended offer: $121k (26.1% below list) — sets the bar for 1% rule.
- Cap rate 6.1% vs local median 2.5% in Whitwell — top-decile yield for the area; either an underpriced asset or a hidden risk that comps aren't pricing in. Stress-test before assuming the spread holds.
Location & tenants
- Location reads 56/100 on livability (#346 in TN) — a working-class tenant base; expect higher turnover. Strengths: cost of living A+, housing A+, crime B; Watch: amenities F, commute F, health & safety F.
- Marion County (town): math 24% / reading 25% proficiency, ranked #89 of 139 in TN (top 64%) — low school quality limits family demand, transient renter base, plan for 1-2y turnover.
- Zoned schools: Whitwell Elementary (math 47% / reading 37%, grade F, #191 of 952 statewide, top 22%, 492 students, 0% FRL); Whitwell Middle School (math 23% / reading 19%, grade F, #187 of 333 statewide, top 58%, 308 students, 0% FRL); Whitwell High School (math 12% / reading 32%, grade F, #163 of 332 statewide, top 51%, 343 students, 0% FRL) — zoned schools average 0% FRL vs 57% district-wide (57 pts lower); this property's tenant base skews higher-income than the district average.
- Market conditions: 81 active listings in the ZIP; 225 units permitted in Marion County in 2024 (0 in 5+ unit buildings).
Forward outlook
- In year one you build about $9k of equity ($1k loan paydown + $8k appreciation (4.8% local appreciation)).
- At projected returns (4.8% appreciation + 3.0% rent growth), your $46k cash investment doubles in ~5 years — after that, you're playing with house money.
- By year 4, paydown + projected appreciation supports a ~$31k cash-out refi (75% LTV) — recoverable capital for the next deal without selling this one.
Negotiation context
- It's been on market 41 days — a 3% lower offer ($159k) is reasonable based on typical stale-listing flexibility.
- 5 sale attempts since 4y ago with the ask held roughly flat each time — persistent listings suggest the price (not the market) is what's stuck; bring a comps-based counter.
Risks & watch-outs
- Watch-outs: built in 1925 — expect roof / HVAC / electrical / plumbing capex.
- Climate carrying-cost: moderate wildfire risk; extreme-heat days projected 8→22/yr by 2055 (HVAC capex compounding) — expect insurance premiums to compound above CPI over the hold.
Questions for the listing agent
- What do current leases actually rent for vs. the listed asking? Can we see a recent rent roll and the last 12 months of T-12 income?
- It's been on market 41 days. Have you received any prior offers? Is the seller open to a 26% concession, seller financing, or rate buy-down credit?
- Built in 1925 — when were the roof, HVAC, electrical panel, plumbing, and water heater last replaced?
- Is there a deadline driving the sale (1031 exchange, divorce, estate, relocation)? That informs how much negotiation room exists.
- Schools are F-rated, which usually means shorter tenancies and higher turnover. Who's the typical renter profile here, and what's been the actual vacancy rate?
- What's the average days-on-market for RENTAL listings here right now (not sales)? A rising rental-DOM trend means longer vacancies and softer asking-rent achievability than the comps imply.
- What's the recent tenant-quality profile in this submarket — average credit score on applications, eviction rate, late-payment / NSF rate, and stable-employment percentage? A property-management company in the area should have these aggregated.
- How much new for-sale + rental construction is in the pipeline within 1–3 miles? Heavy new supply typically softens prices + rents 12–24 months out; constrained supply supports both.
Investment metrics
- 1% rule
- 0.74% ✗
- Cap rate
- 6.15%
- Cash-on-cash
- -0.52%
- DSCR
- 0.98
- GRM
- 11.3
CMA / ARV
- ARV (on-the-fly)
- $277,140
- Comps found
- 10
Show comp detail 10 sales within ~0.75 mi
| Address | Dist | Beds/Ba | Sqft | Sold | Price | $/sf | Match |
|---|---|---|---|---|---|---|---|
| 307 S Oak St | 0.02mi | 3/2.0 | 1,950 (+5%) | 10mo | $60,000 | $31 | 78 |
| 1065 N Main St | 0.24mi | 3/2.0 | 1,743 (-6%) | 10mo | $264,900 | $152 | 66 |
| 746 Walnut St | 0.27mi | 3/2.0 | 1,872 (+1%) | 22mo | $224,500 | $120 | 64 |
| 124 S Chestnut St | 0.50mi | 3/1.0 | 1,776 (-4%) | 13mo | $85,000 | $48 | 58 |
| 746 Maple St | 0.56mi | 3/1.0 | 2,028 (+9%) | 2mo | $280,000 | $138 | 57 |
| 398 S Magnolia St | 0.54mi | 3/2.0 | 1,832 (-2%) | 15mo | $350,000 | $191 | 56 |
| 169 E Maryland Ave | 0.24mi | 2/2.0 (-1) | 1,584 (-15%) | 1mo | $219,000 | $138 | 54 |
| 225 E Massachusetts Ave | 0.63mi | 4/2.0 (+1) | 1,700 (-9%) | 1mo | $330,000 | $194 | 46 |
| 805 Highway 108 | 0.67mi | 3/2.5 | 1,948 (+5%) | 13mo | $290,000 | $149 | 44 |
| 640 Incline Rd | 0.52mi | 3/2.0 | 1,644 (-12%) | 12mo | $318,900 | $194 | 42 |
Match score weights: distance 35% · size 25% · config 20% · recency 20%. Top-matched comps best support the ARV.
Projected returns pro-forma
4.83% appreciation · 3.0% rent growth · sell at horizon
- IRR
- 12.0%
- Equity multiple
- 1.76×
- Total profit
- $34,884
- Equity at exit
- $91,278
- IRR
- 13.1%
- Equity multiple
- 3.33×
- Total profit
- $107,196
- Equity at exit
- $156,180
Cash invested: $45,920 (down + closing). Projections, not guarantees.
Landlord ↔ Tenant lean methodology
- Overall (STATE)
- 87 Strongly Landlord-Friendly
- State Tennessee
- 87 Strongly Landlord-Friendly · R+13
- County
- — inherits STATE
- City
- — inherits STATE
ZIP-level market 37397
- Home prices YoY
- 1.6%
- Active inventory
- 81
- Price-to-rent
- 11.3×
Monthly cashflow live
- Estimated rent
- $1,212 medium interval (Pro) →
- Mortgage (P&I)
- −$860
- Tax from tax record
- −$49 /mo · $588/yr
- Insurance
- −$68
- HOA
- −$0
- Vacancy / Maint / Mgmt
- −$254
- Net cashflow
- $-20
Break-even live
Sensitivity live
| Price | -10% $73 | -5% $26 | +0% $-20 | +5% $-66 | +10% $-113 |
|---|---|---|---|---|---|
| Rent | -10% $-116 | -5% $-68 | +0% $-20 | +5% $28 | +10% $76 |
| Rate | -1.0pp $63 | -0.5pp $22 | base $-20 | +0.5pp $-63 | +1.0pp $-106 |
UW: 25.0% down · 7.5% · 30yr · 1.5% tax · 5.0% vac · 8.0% maint · 8.0% mgmt
Financing live
Cash to close
- Down payment
- $41,000
- Closing costs
- $4,920
- Reserves months
- —
- Total cash needed
- —
Loan-product check · same deal, 3 products live
Conventional
25% down · 7.5% · 30yr
- Down + closing
- —
- Monthly P&I
- —
- Monthly cashflow
- —
- DSCR
- —
- Eligible?
- —
Personal DTI + credit; lowest rate.
DSCR
20% down · 8.5% · 30yr
- Down + closing
- —
- Monthly P&I
- —
- Monthly cashflow
- —
- DSCR
- —
- Eligible?
- —
No personal income docs; deal must DSCR.
Hard money
10% down · 12.0% · 12mo
- Down + closing
- —
- Monthly P&I
- —
- Monthly cashflow
- —
- DSCR
- —
- Eligible?
- —
Short-term bridge; refi at stabilization.
Listing history 36 events
-
2026-06-10days on market $164,000 Active 41 DOM
-
2026-06-09days on market $164,000 Active 40 DOM
-
2026-06-08days on market $164,000 Active 39 DOM
-
2026-06-07days on market $164,000 Active 38 DOM
-
2026-06-05days on market $164,000 Active 35 DOM
-
2026-06-03days on market $164,000 Active 34 DOM
-
2026-06-02days on market $164,000 Active 33 DOM
-
2026-06-01days on market $164,000 Active 32 DOM
-
2026-05-31days on market $164,000 Active 31 DOM
-
2026-05-30days on market $164,000 Active 30 DOM
-
2026-05-16price $164,000
-
2026-04-30$169,000 Active
-
2026-02-26price $169,000
-
2026-02-03price $175,000
-
2026-01-14price $184,000
-
2025-07-28price $189,000
-
2025-07-10price $195,000
-
2025-01-24price $159,900
-
2024-12-30price $169,900
-
2024-11-04price $185,000
-
2024-10-08price $218,000
-
2024-09-30price $185,900
-
2024-08-19historical
-
2024-07-24price $218,000
-
2024-07-24price $218,000
-
2024-07-11$239,900 Active
-
2024-06-20historical
-
2024-06-07price $239,990
-
2024-06-06price $239,990
-
2024-05-18$249,900 Active
-
2023-11-07historical
-
2023-10-03$249,900 Active
-
2022-08-22historical
-
2022-08-22$249,000 Active
-
2022-08-11price $249,000
-
2022-08-06historical
ⓘ Source: listings_history table (triggers on properties + properties_extension) + one-shot
backfill from property_details.listing_events for pre-trigger history.
Tax reassessment forecast TN · Resets to sale price
- Current annual tax
- $588 · $49/mo
- Projected year-2 tax
- $1,164 · $97/mo
- Expected delta
- +$577/yr (+$48/mo · 98.1%)
ⓘ Screening estimate from a state-policy table — verify with the county assessor before closing.
Climate risk First Street
- Flood 1/10 Low FEMA zone X (unshaded) · 0% chance over 30 yrs
- Wildfire 5/10 Major
- Heat 5/10 Major 8 d/yr ≥105°F today · 22 d/yr by 30 yrs out
- Wind 4/10 Moderate 10% chance of damaging wind over 30 yrs
- Air quality 3/10 Moderate 2 unhealthy d/yr today · 2 by 30 yrs out
Nearby sold comps map
Loading sold comps map…
Walkable amenities ~0.75 mi
Loading nearby amenities…
Taxation est. · year 1
- Rental income
- $14,541
- − Mortgage interest
- −$9,187
- − Property taxes
- −$588
- − Insurance
- −$820
- − Repairs & maintenance
- −$1,163
- − Management
- −$1,163
- − Depreciation
- −$4,771
- Taxable loss
- −$3,151
- Est. tax savings @ 24.0%
- +$756
- After-tax cash flow
- $515/yr
For passive investors: Depreciation is non-cash, so a rental often shows a tax loss while cash-flowing — sheltering income. Rental losses are passive: they offset passive income freely, and up to $25,000/yr can offset ordinary (W-2) income if you actively participate and your MAGI is under $100k (phasing out to $0 by $150k); unused losses carry forward. On sale, claimed depreciation is recaptured at up to 25%, and gains may owe capital-gains tax (a 1031 exchange can defer both). Figures are a year-1 estimate at your 24.0% rate — not tax advice; consult a CPA.
Schools (NCES district)
- District
- Marion County
- NCES district ID
- 4702640
- Math proficiency
- 24% ▼ -2.00%
- Reading proficiency
- 25% ▼ -3.00%
- Median HH income
- $41,941
- Composite
- 20.88/100
- National rank
- #8494
- State rank
- #89 of 139 in TN
Livability — Whitwell
- Score
- 56/100
- State rank
- #346
- US rank
- #22851
Category grades
Schools grade is shown separately in the Schools card above.
Census & demographics
- Census place
- Whitwell, TN
- City population
- 10,044
- Population (ZIP)
- 10,044
Population outlook (Marion County) Hauer SSP2
- Today (2025)
- 28,889 people
- By 2030
- 28,915 · +0.1%
- By 2040
- 28,662 · -0.8%
- By 2050
- 28,053 · -2.9%
- By 2075
- 26,855 · -7.0%
- By 2100
- 24,404 · -15.5%
Race, ethnicity, and origin ACS 2023
- Neighborhood character
- Predominantly White (94%)
- Race & ethnicity
- White 94% Two or more races 3% Hispanic / Latino 2% Black 1%
- Common ancestry
- Serbian 2% Lithuanian 1% Slovak 1%
- Foreign-born
- 1% · Canada
- Languages at home
- 99% English-only · Spanish 1%
Political lean MEDSL · Marion
- 2024 margin
- Solid R (+55.7) · D 21.7% · R 77.4%
- 2008→2024 swing
- -34.3pp toward R · 2008: -21.4pp · 2024: -55.7pp
- All cycles
- 2024: R+55.7 2020: R+50.8 2016: R+44.8 2012: R+22.3 2008: R+21.4
Not yet ingested
- Civics
- —
Market trends
- HPI YoY
- ▲ 4.83%
- Current HPI
- 307.3072
- Rent YoY
- —
- Metro
- —
- State GDP YoY
- ▲ 2.78%
- F500 in state
- 22
Industry mix (Fortune 500 HQ in TN)
| Industry | F500 HQs | Revenue |
|---|---|---|
| Healthcare | 3 | $91B |
|
||
| Retail | 3 | $72B |
|
||
| Transportation / Logistics | 1 | $88B |
|
||
| Paper / Packaging | 1 | $19B |
|
||
| Insurance | 1 | $13B |
|
||
| Energy | 1 | $12B |
|
||
Price history
-34.1% since first listed26 events — show timeline
- 2026-05-16 Price Changed $164,000 GCAR
- 2026-04-30 Listed $169,000 GCAR
- 2026-02-26 Price Changed $169,000 GCAR
- 2026-02-03 Price Changed $175,000 GCAR
- 2026-01-14 Price Changed $184,000 GCAR
- 2025-07-28 Price Changed $189,000 GCAR
- 2025-07-10 Price Changed $195,000 GCAR
- 2025-01-24 Price Changed $159,900 GCAR
- 2024-12-30 Price Changed $169,900 GCAR
- 2024-11-04 Price Changed $185,000 GCAR
- 2024-10-08 Price Changed $218,000 GCAR
- 2024-09-30 Price Changed $185,900 GCAR
- 2024-08-19 Listing Removed — REALTRACS as Distributed by MLS Grid
- 2024-07-24 Price Changed $218,000 GCAR
- 2024-07-24 Price Changed $218,000 REALTRACS as Distributed by MLS Grid
- 2024-07-11 Listed $239,900 REALTRACS as Distributed by MLS Grid
- 2024-06-20 Listing Removed — REALTRACS as Distributed by MLS Grid
- 2024-06-07 Price Changed $239,990 GCAR
- 2024-06-06 Price Changed $239,990 REALTRACS as Distributed by MLS Grid
- 2024-05-18 Listed $249,900 REALTRACS as Distributed by MLS Grid
- 2023-11-07 Listing Removed — REALTRACS as Distributed by MLS Grid
- 2023-10-03 Listed $249,900 REALTRACS as Distributed by MLS Grid
- 2022-08-22 Listing Removed — REALTRACS as Distributed by MLS Grid
- 2022-08-22 Listed $249,000 REALTRACS as Distributed by MLS Grid
- 2022-08-11 Price Changed $249,000 REALTRACS as Distributed by MLS Grid
- 2022-08-06 Coming Soon — REALTRACS as Distributed by MLS Grid
Property tax history
+0.6%/yrLatest (2025): $588 · +0.0% YoY. Source: county tax records.
Cash-flow waterfall
monthlySold comps — $/sqft
last 12 mo · ≤1 miLoading sold comps…