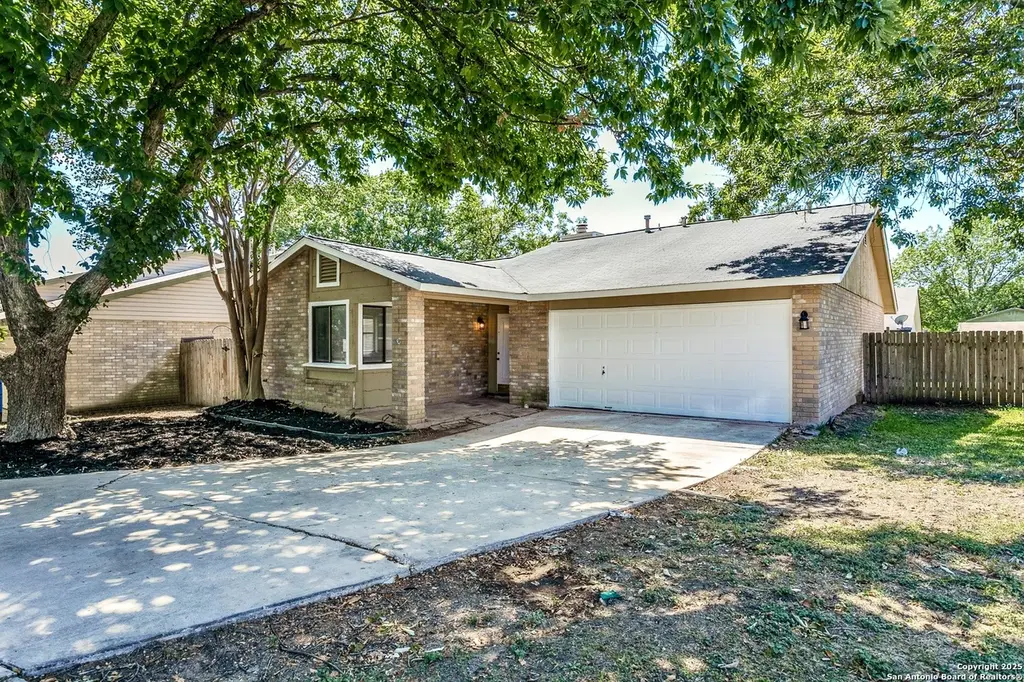
13239 Larkway · San Antonio, TX
Flood risk 1/10 · Minimal
- FEMA flood zone
- X (unshaded)
- Chance of flooding over 30 yrs
- 0.0%
- Est. flood insurance / yr
- $507 – $1,088
Fire risk 1/10 · Minimal
- Est. fire insurance / yr
- $1,222 – $2,270
Heat risk 8/10 · Major
- Hot days now (above 107°F)
- 7 days/yr
- Hot days in 30 yrs
- 22 days/yr
Wind risk 8/10 · Major
- Chance of severe wind over 30 yrs
- 80.0%
Air-quality risk 2/10 · Minimal
- Unhealthy air days now
- 1 days/yr
- Unhealthy air days in 30 yrs
- 1 days/yr
Risk factors via First Street. Map © Google.
Why this score? — see what drove the D grade
The composite is a weighted blend of 9 inputs, each scored 0–100. Each bar is that input's sub-score; the figure is the points it added to the 100-point composite (weight × sub-score).
- ARV discount +15.0/15.0
- Cash flow +7.6/30.0
- Livability +4.0/5.0
- Schools +3.8/10.0
- 1% rule +3.7/10.0
- Rent growth +2.5/5.0
- Condition / age +2.5/5.0
- DSCR +1.7/10.0
- Appreciation +0.0/10.0
$169,900
🖨 Deal sheet (PDF) 📄 Offer letter ✓ Due diligence
Listing remarks MLS
Great move-in ready bungalow style home nestled quietly at end of Cul-de-sac* Big main Living area with desirable brick Fireplace, Vaulted ceiling, Recess lighting* Living & Dining combo* New Stainless steel kitchen Stove/Oven & built-in Microwave, New desirable Corian countertops, Eat-in Kitchen area* Primary Bedroom w/big Walk-in Closet* Inside Utility Rm* New Flooring throughout* 2-Car Garage w/new auto garage door opener* Big driveway/plenty of parking; Boat or RV Parking*
Key facts
- Brick fireplace
- Vaulted ceiling
- Recess lighting
Tags
Neighborhood map
What this means for you Summary
Snapshot
- This is a 2-bed/2.0-bath single-family listed at $170k.
Deal economics
- At list price, monthly cash flow is $-201 ($-2k/yr) — negative.
- To cash-flow at today's rent, offer at most $134k (20.9% below list).
- To meet the 1% rule (rent ≥ 1% of price), the offer needs to be $148k (12.7% below list).
- Recommended offer: $134k (20.9% below list) — sets the bar for cash-flow.
- Cap rate 4.9% vs local median 3.8% in San Antonio — meaningfully above typical; check what's discounted (condition, days-on-market, listing class) to confirm the premium yield is real.
Location & tenants
- Location reads 80/100 on livability (#31 in TX, #1,616 nationally) — a professional / high-income tenant draw. Strengths: amenities A+, commute A+, cost of living A+; Watch: crime F.
- North East ISD (urban): math 38% / reading 49% proficiency, ranked #276 of 826 in TX (top 33%) — families likely to look elsewhere, expect single-tenant / working-renter base with shorter leases.
- Zoned schools: Woodstone El (math 38% / reading 38%, grade F, #1,709 of 4,322 statewide, top 40%, 552 students, 74% FRL); Wood Middle (math 20% / reading 34%, grade F, #1,177 of 1,662 statewide, top 72%, 706 students, 72% FRL); Madison H S (math 26% / reading 49%, grade F, #888 of 1,632 statewide, top 55%, 2,850 students, 53% FRL) — zoned schools average 66% FRL vs 41% district-wide (25 pts higher); higher-poverty schools than district average — tighter screening recommended.
- Market conditions: Rents soft (-0.1%/yr); 308 active listings in the ZIP; 40 comparable units currently listed for rent nearby; rentals at typical pace (median 26d on market — plan ~3-4 weeks tenant-placement turnaround); solid renter incomes; 8,308 units permitted in Bexar County in 2024 (2,506 in 5+ unit buildings).
Forward outlook
- Local home prices are declining (-3.0%/yr); year-one equity from $1k of loan paydown is wiped out by about $5k of value loss. Plan a longer hold.
- Bexar County population projected at +50% by 2050 — long-run rental-demand tailwind backs the buy-and-hold thesis.
Negotiation context
- It's been on market 91 days — a 9% lower offer ($155k) is reasonable based on typical stale-listing flexibility.
- 6 sale attempts; this cycle's ask has dropped $15k (8%) from the opening price — seller is motivated, your offer sets the floor, not the list.
Risks & watch-outs
- Watch-outs: property tax is 2.9% of price.
- Climate carrying-cost: severe wind risk, 80% chance of damaging wind over 30y; extreme-heat days projected 7→22/yr by 2055 (HVAC capex compounding) — expect insurance premiums to compound above CPI over the hold.
Questions for the listing agent
- What do current leases actually rent for vs. the listed asking? Can we see a recent rent roll and the last 12 months of T-12 income?
- It's been on market 91 days. Have you received any prior offers? Is the seller open to a 21% concession, seller financing, or rate buy-down credit?
- Property tax is high relative to price — has the assessment been appealed recently, and will the sale trigger a re-assessment?
- Why hasn't it sold? Are there any deal-killer items the seller is aware of (foundation, flood, title, zoning, code violations)?
- Is there a deadline driving the sale (1031 exchange, divorce, estate, relocation)? That informs how much negotiation room exists.
- Crime grade is F in this area — have there been break-ins, vandalism, or insurance claims at this property in the last 3 years? What carrier currently insures it and at what premium?
- The area grade is low — what's the realistic commute time and amenity access for the typical tenant pool here? Any planned neighborhood developments (good or bad) we should know about?
- What's the average days-on-market for RENTAL listings here right now (not sales)? A rising rental-DOM trend means longer vacancies and softer asking-rent achievability than the comps imply.
- What's the recent tenant-quality profile in this submarket — average credit score on applications, eviction rate, late-payment / NSF rate, and stable-employment percentage? A property-management company in the area should have these aggregated.
- How much new for-sale + rental construction is in the pipeline within 1–3 miles? Heavy new supply typically softens prices + rents 12–24 months out; constrained supply supports both.
Investment metrics
- 1% rule
- 0.87% ✗
- Cap rate
- 4.87%
- Cash-on-cash
- -5.08%
- DSCR
- 0.77
- GRM
- 9.5
CMA / ARV
- ARV (median comp)
- $232,207
- List price
- $169,900
- Delta
- -26.83%
- Verdict
- UNDERPRICED
- Comps
- 20 within 1.0 mi
Show comp detail 12 sales within ~0.75 mi
| Address | Dist | Beds/Ba | Sqft | Sold | Price | $/sf | Match |
|---|---|---|---|---|---|---|---|
| 13246 Larkwalk | 0.02mi | 3/2.0 (+1) | 1,339 (-2%) | 8mo | $237,990 | $178 | 85 |
| 5707 Larkdale Dr | 0.10mi | 3/2.0 (+1) | 1,258 (-8%) | 1mo | $239,000 | $190 | 77 |
| 13214 Larkbrook St | 0.12mi | 3/2.0 (+1) | 1,488 (+9%) | 0mo | $234,990 | $158 | 74 |
| 12903 Parton | 0.38mi | 3/2.0 (+1) | 1,399 (+3%) | 0mo | $255,000 | $182 | 72 |
| 13231 Wood Climb | 0.16mi | 3/2.0 (+1) | 1,478 (+9%) | 6mo | $228,000 | $154 | 68 |
| 5527 Colewood | 0.39mi | 3/2.0 (+1) | 1,319 (-3%) | 5mo | $179,900 | $136 | 68 |
| 13722 Earlywood | 0.32mi | 3/2.0 (+1) | 1,296 (-5%) | 8mo | $198,800 | $153 | 65 |
| 12331 Constitution St | 0.68mi | 3/2.0 (+1) | 1,331 (-2%) | 1mo | $215,000 | $162 | 59 |
| 5819 Champions Hl | 0.70mi | 3/2.0 (+1) | 1,416 (+4%) | 3mo | $236,500 | $167 | 53 |
| 5619 Sunup Dr | 0.40mi | 3/2.0 (+1) | 1,216 (-11%) | 7mo | $204,999 | $169 | 52 |
| 13106 Feather Pt | 0.60mi | 3/2.0 (+1) | 1,509 (+11%) | 8mo | $199,500 | $132 | 42 |
| 13907 Mission Vly | 0.64mi | 3/2.0 (+1) | 1,198 (-12%) | 8mo | $145,000 | $121 | 39 |
Match score weights: distance 35% · size 25% · config 20% · recency 20%. Top-matched comps best support the ARV.
Projected returns pro-forma
-3.0% appreciation · 0.0% rent growth · sell at horizon
- IRR
- -28.9%
- Equity multiple
- 0.06×
- Total profit
- $-44,550
- Equity at exit
- $25,333
- IRR
- -51.7%
- Equity multiple
- -0.50×
- Total profit
- $-71,504
- Equity at exit
- $14,690
Cash invested: $47,572 (down + closing). Projections, not guarantees.
Landlord ↔ Tenant lean methodology
- Overall (STATE)
- 87 Strongly Landlord-Friendly
- State Texas
- 87 Strongly Landlord-Friendly · R+5
- County
- — inherits STATE
- City
- — inherits STATE
ZIP-level market 78233
- Home prices YoY
- -31.0%
- Rents YoY
- -0.1%
- Active inventory
- 308
- Price-to-rent
- 9.5×
Monthly cashflow live
- Estimated rent
- $1,483 high interval (Pro) →
- Mortgage (P&I)
- −$891
- Tax from tax record
- −$411 /mo · $4,929/yr
- Insurance
- −$71
- HOA
- −$0
- Vacancy / Maint / Mgmt
- −$311
- Net cashflow
- $-201
Break-even live
Sensitivity live
| Price | -10% $-105 | -5% $-153 | +0% $-201 | +5% $-249 | +10% $-297 |
|---|---|---|---|---|---|
| Rent | -10% $-318 | -5% $-260 | +0% $-201 | +5% $-143 | +10% $-84 |
| Rate | -1.0pp $-116 | -0.5pp $-158 | base $-201 | +0.5pp $-245 | +1.0pp $-290 |
UW: 25.0% down · 7.5% · 30yr · 1.5% tax · 5.0% vac · 8.0% maint · 8.0% mgmt
Financing live
Cash to close
- Down payment
- $42,475
- Closing costs
- $5,097
- Reserves months
- —
- Total cash needed
- —
Loan-product check · same deal, 3 products live
Conventional
25% down · 7.5% · 30yr
- Down + closing
- —
- Monthly P&I
- —
- Monthly cashflow
- —
- DSCR
- —
- Eligible?
- —
Personal DTI + credit; lowest rate.
DSCR
20% down · 8.5% · 30yr
- Down + closing
- —
- Monthly P&I
- —
- Monthly cashflow
- —
- DSCR
- —
- Eligible?
- —
No personal income docs; deal must DSCR.
Hard money
10% down · 12.0% · 12mo
- Down + closing
- —
- Monthly P&I
- —
- Monthly cashflow
- —
- DSCR
- —
- Eligible?
- —
Short-term bridge; refi at stabilization.
Rent comps 40 comps
| Address | Beds | Baths | Sqft | Rent | $/sqft | DOM | Units | Dist |
|---|---|---|---|---|---|---|---|---|
| 13202 Larkwalk St San Antonio, TX | 3.0 | 2.0 | 1371 | $1,500 | $1.09 | 17d | 1 | 0.11mi |
| 13406 Fawnwood St San Antonio, TX | 3.0 | 2.0 | 1132 | $1,700 | $1.50 | 46d | 1 | 0.22mi |
| 5511 Eaglewood St San Antonio, TX | 3.0 | 2.0 | 1100 | $1,700 | $1.55 | 4d | 1 | 0.26mi |
| 13719 Earlywood St San Antonio, TX | 3.0 | 1.5 | 1197 | $1,399 | $1.17 | 46d | 1 | 0.29mi |
| 13514 Fawnwood St San Antonio, TX | 3.0 | 2.0 | 1100 | $1,555 | $1.41 | 20d | 1 | 0.33mi |
| 13031 Oconnor Cv San Antonio, TX | 3.0 | 2.0 | 1250 | $1,395 | $1.12 | 26d | 1 | 0.35mi |
| 13025 O'Connor Cv San Antonio, TX | 3.0 | 2.0 | 1212 | $1,295 | $1.07 | 46d | 1 | 0.35mi |
| 13023 Oconnor Cv San Antonio, TX | 3.0 | 2.0 | 1212 | $1,295 | $1.07 | 20d | 1 | 0.35mi |
| 13023 Oconnor Cv San Antonio, TX | 3.0 | 2.0 | 1212 | $1,295 | $1.07 | 46d | 1 | 0.35mi |
| 12923 Parton Ln San Antonio, TX | 3.0 | 2.0 | 1568 | $1,600 | $1.02 | 26d | 1 | 0.40mi |
| 13656 O'Connor Rd Apt 710 San Antonio, TX | 2.0 | 2.0 | 970 | $944 | $0.97 | 0d | 1 | 0.40mi |
| 13658 Oconnor Rd San Antonio, TX | 1.0–3.0 | 1.0–2.0 | 948 | $1,288 | $1.36 | 0d | 26 | 0.49mi |
| 14343 Judson Rd San Antonio, TX | 2.0 | 1.0–2.0 | 854 | $1,237 | $1.45 | 10d | 6 | 0.51mi |
| 14343 Judson Rd San Antonio, TX | 1.0–2.0 | 1.0–2.0 | 794 | $1,475 | $1.86 | 26d | 5 | 0.51mi |
| 5410 Champions Hill Dr San Antonio, TX | 3.0 | 2.0 | 1097 | $1,550 | $1.41 | 46d | 1 | 0.52mi |
| 12423 Cannonade St San Antonio, TX | 3.0 | 2.0 | 1330 | $1,560 | $1.17 | 6d | 1 | 0.54mi |
| 13934 Mission Vly San Antonio, TX | 3.0 | 2.0 | 1762 | $1,900 | $1.08 | 6d | 1 | 0.58mi |
| 6111 Quail Feather Ln San Antonio, TX | 3.0 | 2.5 | 1456 | $1,895 | $1.30 | 22d | 1 | 0.59mi |
| 6011 Little Brandywine Crk San Antonio, TX | 3.0 | 2.0 | 1314 | $1,550 | $1.18 | 0d | 1 | 0.60mi |
| 14310 Nacogdoches Rd Unit 710 San Antonio, TX | 2.0 | 2.0 | 1261 | $1,272 | $1.01 | 0d | 1 | 0.61mi |
| 5801 Lake Champlain St San Antonio, TX | 3.0 | 2.0 | 1288 | $2,300 | $1.79 | 26d | 1 | 0.64mi |
| 14311 Arrowood San Antonio, TX | 3.0 | 2.0 | 1409 | $2,100 | $1.49 | 26d | 1 | 0.68mi |
| 14650 Nacogdoches Rd San Antonio, TX | 2.0 | 2.0 | 1141 | $1,049 | $0.92 | 26d | 1 | 0.71mi |
| 14650 Nacogdoches Rd San Antonio, TX | 3.0 | 2.0 | 1380 | $1,249 | $0.91 | 6d | 1 | 0.71mi |
| 12315 Constitution St San Antonio, TX | 3.0 | 2.0 | 1450 | $1,675 | $1.16 | 46d | 1 | 0.71mi |
| 12315 Constitution St San Antonio, TX | 3.0 | 2.0 | 1398 | $1,675 | $1.20 | 26d | 1 | 0.71mi |
| 13811 Flairwood St San Antonio, TX | 3.0 | 2.0 | 1283 | $2,000 | $1.56 | 26d | 1 | 0.77mi |
| 12714 La Quinta San Antonio, TX | 3.0 | 2.0 | 1626 | $1,950 | $1.20 | 26d | 1 | 0.78mi |
| 14650 Nacogdoches Rd Unit 2-0603 San Antonio, TX | 2.0 | 2.0 | 1067 | $1,279 | $1.20 | 46d | 1 | 0.79mi |
| 14650 Nacogdoches Rd Unit 1-0501 San Antonio, TX | 2.0 | 2.0 | 1012 | $1,479 | $1.46 | 46d | 1 | 0.79mi |
| 6311 Marrogot Run St San Antonio, TX | 3.0 | 2.0 | 1278 | $1,690 | $1.32 | 0d | 1 | 0.79mi |
| 14722 Nacogdoches Rd San Antonio, TX | 1.0–2.0 | 1.0–2.0 | 807 | $1,205 | $1.49 | 0d | 20 | 0.81mi |
| 13147 Independence Ave San Antonio, TX | 2.0 | 2.0 | 1100 | $1,175 | $1.07 | 5d | 1 | 0.85mi |
| 6306 Luglio Ln Unit 104 San Antonio, TX | 3.0 | 2.5 | 1324 | $1,495 | $1.13 | 6d | 1 | 0.86mi |
| 12426 Magnifico St San Antonio, TX | 3.0 | 2.0 | 1501 | $2,000 | $1.33 | 46d | 1 | 0.89mi |
| 4971 Dare Ln San Antonio, TX | 3.0 | 2.0 | 1386 | $1,500 | $1.08 | 16d | 1 | 0.89mi |
| 14211 Yellow Warbler San Antonio, TX | 3.0 | 2.0 | 1251 | $1,550 | $1.24 | 46d | 1 | 0.90mi |
| 6311 Melanzane Ave Unit 1 San Antonio, TX | 3.0 | 2.5 | 1218 | $1,395 | $1.15 | 18d | 1 | 0.90mi |
| 6308 Worchester Knl San Antonio, TX | 3.0 | 2.0 | 1147 | $1,350 | $1.18 | 26d | 1 | 0.90mi |
| 14900 Nacogdoches Rd Unit 710 San Antonio, TX | 2.0 | 2.0 | 1324 | $1,319 | $1.00 | 0d | 1 | 0.91mi |
Listing history 27 events
-
2026-06-02status $169,900 Pending 91 DOM
-
2026-06-01days on market $169,900 Active Option 91 DOM
-
2026-05-31days on market $169,900 Active Option 90 DOM
-
2026-05-14historical Active Option 489-char remark
Show marketing remark (489 chars)
Great move-in ready bungalow style home nestled quietly at end of Cul-de-sac* Big main Living area with desirable brick Fireplace, Vaulted ceiling, Recess lighting* Living & Dining combo* New Stainless steel kitchen Stove/Oven & built-in Microwave, New desirable Corian countertops, Eat-in Kitchen area* Primary Bedroom w/big Walk-in Closet* Inside Utility Rm* New Flooring throughout* 2-Car Garage w/new auto garage door opener* Big driveway/plenty of parking; Boat or RV Parking*
-
2026-05-05price $169,900 489-char remark
Show marketing remark (489 chars)
Great move-in ready bungalow style home nestled quietly at end of Cul-de-sac* Big main Living area with desirable brick Fireplace, Vaulted ceiling, Recess lighting* Living & Dining combo* New Stainless steel kitchen Stove/Oven & built-in Microwave, New desirable Corian countertops, Eat-in Kitchen area* Primary Bedroom w/big Walk-in Closet* Inside Utility Rm* New Flooring throughout* 2-Car Garage w/new auto garage door opener* Big driveway/plenty of parking; Boat or RV Parking*
-
2026-03-21price $179,900 489-char remark
Show marketing remark (489 chars)
Great move-in ready bungalow style home nestled quietly at end of Cul-de-sac* Big main Living area with desirable brick Fireplace, Vaulted ceiling, Recess lighting* Living & Dining combo* New Stainless steel kitchen Stove/Oven & built-in Microwave, New desirable Corian countertops, Eat-in Kitchen area* Primary Bedroom w/big Walk-in Closet* Inside Utility Rm* New Flooring throughout* 2-Car Garage w/new auto garage door opener* Big driveway/plenty of parking; Boat or RV Parking*
-
2026-03-02$184,900 New 489-char remark
Show marketing remark (489 chars)
Great move-in ready bungalow style home nestled quietly at end of Cul-de-sac* Big main Living area with desirable brick Fireplace, Vaulted ceiling, Recess lighting* Living & Dining combo* New Stainless steel kitchen Stove/Oven & built-in Microwave, New desirable Corian countertops, Eat-in Kitchen area* Primary Bedroom w/big Walk-in Closet* Inside Utility Rm* New Flooring throughout* 2-Car Garage w/new auto garage door opener* Big driveway/plenty of parking; Boat or RV Parking*
-
2026-02-28historical
-
2026-02-26price $184,900
-
2026-01-06status Back on Market
-
2025-12-31historical Active Option
-
2025-12-18price $189,900
-
2025-11-05price $194,900
-
2025-10-16price $199,900
-
2025-09-28$208,000 New
-
2025-07-06historical
-
2025-05-30status Back on Market
-
2025-05-23historical Active Option
-
2025-05-21price $149,900
-
2025-04-30price $155,900
-
2025-04-07status Back on Market
-
2025-03-31historical Active Option
-
2025-03-10$169,900 New
-
2005-04-20soldstatus
-
1999-11-18soldstatus
-
1997-02-01soldstatus
-
1987-08-01soldstatus
ⓘ Source: listings_history table (triggers on properties + properties_extension) + one-shot
backfill from property_details.listing_events for pre-trigger history.
Tax reassessment forecast TX · Resets to sale price
- Current annual tax
- $4,929 · $411/mo
- Projected year-2 tax
- $4,929 · $411/mo
- Expected delta
- $0/yr ($0/mo · 0.0%)
ⓘ Screening estimate from a state-policy table — verify with the county assessor before closing.
Climate risk First Street
- Flood 1/10 Low FEMA zone X (unshaded) · 0% chance over 30 yrs
- Wildfire 1/10 Low
- Heat 8/10 Severe 7 d/yr ≥107°F today · 22 d/yr by 30 yrs out
- Wind 8/10 Severe 80% chance of damaging wind over 30 yrs
- Air quality 2/10 Low 1 unhealthy d/yr today · 1 by 30 yrs out
Nearby sold comps map
Loading sold comps map…
Walkable amenities ~0.75 mi
Loading nearby amenities…
Taxation est. · year 1
- Rental income
- $17,791
- − Mortgage interest
- −$9,517
- − Property taxes
- −$4,929
- − Insurance
- −$850
- − Repairs & maintenance
- −$1,423
- − Management
- −$1,423
- − Depreciation
- −$4,943
- Taxable loss
- −$5,293
- Est. tax savings @ 24.0%
- +$1,270
- After-tax cash flow
- $-1,145/yr
For passive investors: Depreciation is non-cash, so a rental often shows a tax loss while cash-flowing — sheltering income. Rental losses are passive: they offset passive income freely, and up to $25,000/yr can offset ordinary (W-2) income if you actively participate and your MAGI is under $100k (phasing out to $0 by $150k); unused losses carry forward. On sale, claimed depreciation is recaptured at up to 25%, and gains may owe capital-gains tax (a 1031 exchange can defer both). Figures are a year-1 estimate at your 24.0% rate — not tax advice; consult a CPA.
Schools (NCES district)
- District
- North East ISD
- NCES district ID
- 4832940
- Math proficiency
- 38% ▼ -14.00%
- Reading proficiency
- 49% ▼ -4.00%
- Median HH income
- $57,715
- Composite
- 38.1/100
- National rank
- #4276
- State rank
- #276 of 826 in TX
Livability — San Antonio
- Score
- 80/100
- State rank
- #31
- US rank
- #1616
Category grades
Schools grade is shown separately in the Schools card above.
Census & demographics
- Census place
- San Antonio, TX
- County
- Bexar County · 1,990,555 people
- City population
- 1,806,925
- Metro
- San Antonio-New Braunfels, TX
- Population (ZIP)
- 48,911
- Household income
- $76,421
- Rent vs Own
- Severe rent burden
- 1635.0
Population outlook (Bexar County) Hauer SSP2
- Today (2025)
- 2,336,851 people
- By 2030
- 2,560,728 · +9.6%
- By 2040
- 3,020,569 · +29.3%
- By 2050
- 3,493,522 · +49.5%
- By 2075
- 4,668,459 · +99.8%
- By 2100
- 5,533,242 · +136.8%
Race, ethnicity, and origin ACS 2023
- Neighborhood character
- Diverse neighborhood (Simpson 0.62)
- Race & ethnicity
- Hispanic / Latino 52% White 31% Two or more races 23% Black 11% Asian 3% Native American 1%
- Hispanic origin (detail)
- Mexican 42% Puerto Rican 3%
- Common ancestry
- Romanian 1% Lithuanian 1% Italian 1%
- Foreign-born
- 12% · Canada, South Korea, Vietnam
- Languages at home
- 69% English-only · Spanish 27% Korean 1% Other Asian/Pacific 1%
Political lean MEDSL · Bexar
- 2024 margin
- Lean D (+9.8) · D 54.3% · R 44.6% · Other 1.1%
- 2008→2024 swing
- +4.2pp toward D · 2008: 5.6pp · 2024: 9.8pp
- All cycles
- 2024: D+9.8 2020: D+18.2 2016: D+13.5 2012: D+4.6 2008: D+5.6
Not yet ingested
- Civics
- —
Market trends
- HPI YoY
- ▼ -123.27%
- Current HPI
- 274.943
- Rent YoY
- ▼ -0.06%
- Metro
- San Antonio-New Braunfels, TX
- State GDP YoY
- ▲ 3.95%
- F500 in state
- 110
Industry mix (Fortune 500 HQ in TX)
| Industry | F500 HQs | Revenue |
|---|---|---|
| Energy | 16 | $1,198B |
|
||
| Technology | 5 | $198B |
|
||
| Engineering / Construction | 4 | $72B |
|
||
| Energy Services | 3 | $60B |
|
||
| Utilities | 3 | $41B |
|
||
| Healthcare | 2 | $330B |
|
||
Price history
+0.0% since first listed24 events — show timeline
- 2026-05-14 Contingent — LERA
- 2026-05-05 Price Changed $169,900 LERA
- 2026-03-21 Price Changed $179,900 LERA
- 2026-03-02 Listed $184,900 LERA
- 2026-02-28 Listing Removed — LERA
- 2026-02-26 Price Changed $184,900 LERA
- 2026-01-06 Relisted — LERA
- 2025-12-31 Contingent — LERA
- 2025-12-18 Price Changed $189,900 LERA
- 2025-11-05 Price Changed $194,900 LERA
- 2025-10-16 Price Changed $199,900 LERA
- 2025-09-28 Listed $208,000 LERA
- 2025-07-06 Listing Removed — LERA
- 2025-05-30 Relisted — LERA
- 2025-05-23 Contingent — LERA
- 2025-05-21 Price Changed $149,900 LERA
- 2025-04-30 Price Changed $155,900 LERA
- 2025-04-07 Relisted — LERA
- 2025-03-31 Contingent — LERA
- 2025-03-10 Listed $169,900 LERA
- 2005-04-20 Sold (Public Records) — Public Records
- 1999-11-18 Sold (Public Records) — Public Records
- 1997-02-01 Sold (Public Records) — Public Records
- 1987-08-01 Sold (Public Records) — Public Records
Property tax history
+5.2%/yrLatest (2025): $4,929 · -6.4% YoY. Source: county tax records.
Cash-flow waterfall
monthlySold comps — $/sqft
last 12 mo · ≤1 miLoading sold comps…