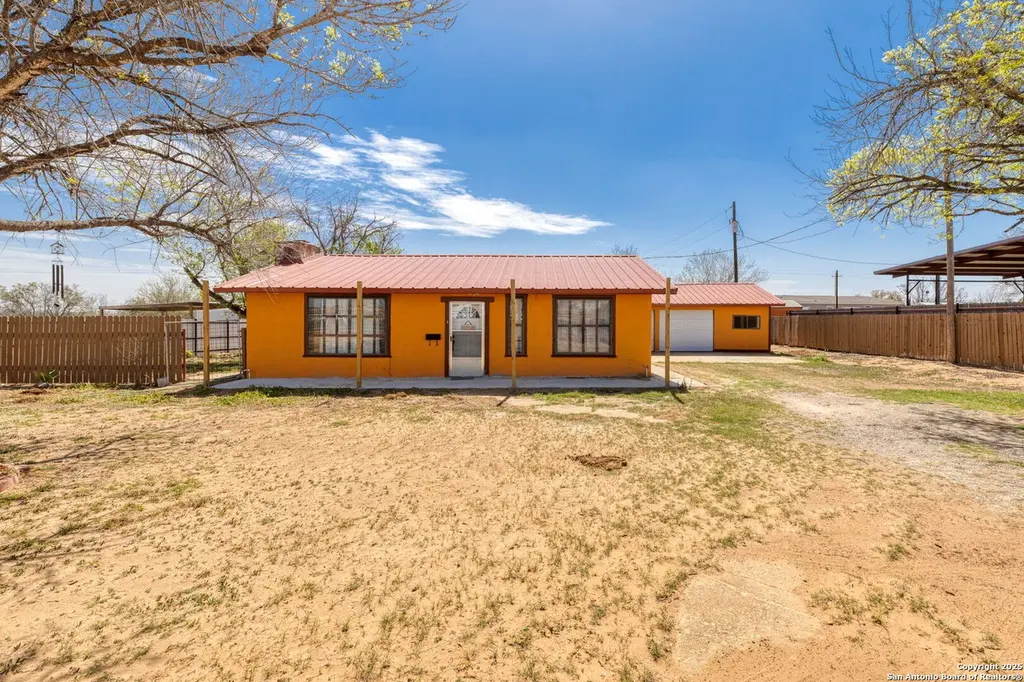
13934 N Interstate 35 · Moore, TX
Flood risk 1/10 · Minimal
- FEMA flood zone
- —
- Chance of flooding over 30 yrs
- 0.0%
- Est. flood insurance / yr
- —
Fire risk 7/10 · Major
- Est. fire insurance / yr
- $1,222 – $2,270
Heat risk 8/10 · Major
- Hot days now (above 110°F)
- 7 days/yr
- Hot days in 30 yrs
- 23 days/yr
Wind risk 8/10 · Major
- Chance of severe wind over 30 yrs
- 80.0%
Air-quality risk 1/10 · Minimal
- Unhealthy air days now
- 0 days/yr
- Unhealthy air days in 30 yrs
- 0 days/yr
Risk factors via First Street. Map © Google.
Why this score? — see what drove the C+ grade
The composite is a weighted blend of 9 inputs, each scored 0–100. Each bar is that input's sub-score; the figure is the points it added to the 100-point composite (weight × sub-score).
- Cash flow +20.8/30.0
- ARV discount +15.0/15.0
- DSCR +6.6/10.0
- Appreciation +5.6/10.0
- 1% rule +5.4/10.0
- Rent growth +2.5/5.0
- Condition / age +2.5/5.0
- Livability +1.8/5.0
- Schools +1.3/10.0
$195,000
🖨 Deal sheet (PDF) 📄 Offer letter ✓ Due diligence
Listing remarks MLS
Enjoy this move in ready, country living home on over a 1/2 acre lot. easy access to highway.
Key facts
- 0.65 acre lot
- 2 garage spots
- Built 1985
Property features AI
Exterior
- Parking: 2-car garage
- Utilities: Water system
- Home design: Pre-owned property; Approximate age: 41 years
- Construction: Stucco and siding exterior; Slab foundation; Metal roof
- Exterior features: Privacy fence; Chain link fence; Wrought iron fence; Stone/masonry fence; Storage building / shed; Mature trees; Level lot; Horses allowed; Street paved; Easement road access; Interstate highway within 1 mile
Interior
- Kitchen: Microwave; Stove/Range; Refrigerator; Smooth cooktop; Solid countertops; Eat-in layout
- Bedrooms: Master bedroom with multiple closets and ceiling fan (15 x 17); Bedroom 2 (11 x 11); Bedroom 3 (11 x 18)
- Flooring: Ceramic tile flooring
- Bathrooms: 1 full bathroom
- Heating & cooling: Central heating (electric); Central air conditioning
- Interior features: Ceiling fans; High ceilings; Cable TV available; High speed internet; Telephone service available; Some window coverings remain; Living/dining room combination; Eat-in kitchen; Two living areas; Utility room inside; Laundry room; Walk-in closets; Smooth cooktop; Solid countertops; Electric water heater
- Laundry & utility: Washer connection; Dryer connection; Utility room (3 x 10); Laundry room
Neighborhood map
What this means for you Summary
Snapshot
- This is a 3-bed/1.0-bath single-family listed at $195k.
Deal economics
- At list price, monthly cash flow is $266 ($3k/yr) — positive.
- The deal already cash-flows at list — no discount required.
- Meets the 1% rule at list price ($2k rent vs $195k).
Location & tenants
- Location reads 35/100 on livability (#1,662 in TX) — a limited-amenity area; tenant pool skews transient or value-seeking. Strengths: cost of living A+, crime A; Watch: amenities F, commute F, employment F.
- Pearsall ISD (town): math 12% / reading 19% proficiency, ranked #810 of 826 in TX (top 98%) — low school quality limits family demand, transient renter base, plan for 1-2y turnover; 76% free/reduced lunch — lower-income household profile, screen leases tightly.
- Zoned schools: Pearsall Int (math 11% / reading 17%, grade F, #4,127 of 4,322 statewide, top 96%, 427 students, 80% FRL); Pearsall J H (math 9% / reading 17%, grade F, #1,609 of 1,662 statewide, top 97%, 457 students, 80% FRL); Pearsall H S (math 17% / reading 28%, grade F, #1,354 of 1,632 statewide, top 83%, 614 students, 86% FRL).
- Market conditions: 119 active listings in the ZIP; 12 units permitted in Frio County in 2024 (0 in 5+ unit buildings).
Forward outlook
- In year one you build about $4k of equity ($1k loan paydown + $2k appreciation (1.1% local appreciation)).
- Frio County population projected at +50% by 2050 — long-run rental-demand tailwind backs the buy-and-hold thesis.
- At projected returns (1.1% appreciation + 3.0% rent growth), your $55k cash investment doubles in ~7 years — after that, you're playing with house money.
- By year 9, paydown + projected appreciation supports a ~$32k cash-out refi (75% LTV) — recoverable capital for the next deal without selling this one.
Negotiation context
- Only 14 days on market — expect competitive offers; lowballing is unlikely to land.
- 5 sale attempts since 17y ago with the ask held roughly flat each time — persistent listings suggest the price (not the market) is what's stuck; bring a comps-based counter.
Risks & watch-outs
- Climate carrying-cost: severe wind risk, 80% chance of damaging wind over 30y; major wildfire risk; extreme-heat days projected 7→23/yr by 2055 (HVAC capex compounding) — expect insurance premiums to compound above CPI over the hold.
Questions for the listing agent
- Is there a deadline driving the sale (1031 exchange, divorce, estate, relocation)? That informs how much negotiation room exists.
- Schools are F-rated, which usually means shorter tenancies and higher turnover. Who's the typical renter profile here, and what's been the actual vacancy rate?
- What's the average days-on-market for RENTAL listings here right now (not sales)? A rising rental-DOM trend means longer vacancies and softer asking-rent achievability than the comps imply.
- What's the recent tenant-quality profile in this submarket — average credit score on applications, eviction rate, late-payment / NSF rate, and stable-employment percentage? A property-management company in the area should have these aggregated.
- How much new for-sale + rental construction is in the pipeline within 1–3 miles? Heavy new supply typically softens prices + rents 12–24 months out; constrained supply supports both.
Investment metrics
- 1% rule
- 1.04% ✓
- Cap rate
- 7.93%
- Cash-on-cash
- 5.85%
- DSCR
- 1.26
- GRM
- 8.0
CMA / ARV
- ARV (median comp)
- $235,349
- List price
- $195,000
- Delta
- -19.69%
- Verdict
- UNDERPRICED
- Comps
- 14 within 1.0 mi
Show comp detail 1 sale within ~0.75 mi
| Address | Dist | Beds/Ba | Sqft | Sold | Price | $/sf | Match |
|---|---|---|---|---|---|---|---|
| 335 CR 1643 Clearview Dr | 0.45mi | 3/2.0 | 1,400 (-2%) | 4mo | $235,000 | $168 | 69 |
Match score weights: distance 35% · size 25% · config 20% · recency 20%. Top-matched comps best support the ARV.
Projected returns pro-forma
1.14% appreciation · 3.0% rent growth · sell at horizon
- IRR
- 7.9%
- Equity multiple
- 1.40×
- Total profit
- $21,988
- Equity at exit
- $68,028
- IRR
- 11.8%
- Equity multiple
- 2.45×
- Total profit
- $79,370
- Equity at exit
- $91,542
Cash invested: $54,600 (down + closing). Projections, not guarantees.
Landlord ↔ Tenant lean methodology
- Overall (STATE)
- 87 Strongly Landlord-Friendly
- State Texas
- 87 Strongly Landlord-Friendly · R+5
- County
- — inherits STATE
- City
- — inherits STATE
ZIP-level market 78057
- Home prices YoY
- 1.4%
- Active inventory
- 119
- Price-to-rent
- 8.0×
Monthly cashflow live
- Estimated rent
- $2,020 medium interval (Pro) →
- Mortgage (P&I)
- −$1,023
- Tax from tax record
- −$226 /mo · $2,713/yr
- Insurance
- −$81
- HOA
- −$0
- Vacancy / Maint / Mgmt
- −$424
- Net cashflow
- $266
Break-even live
Sensitivity live
| Price | -10% $377 | -5% $321 | +0% $266 | +5% $211 | +10% $156 |
|---|---|---|---|---|---|
| Rent | -10% $107 | -5% $186 | +0% $266 | +5% $346 | +10% $426 |
| Rate | -1.0pp $364 | -0.5pp $316 | base $266 | +0.5pp $216 | +1.0pp $164 |
UW: 25.0% down · 7.5% · 30yr · 1.5% tax · 5.0% vac · 8.0% maint · 8.0% mgmt
Financing live
Cash to close
- Down payment
- $48,750
- Closing costs
- $5,850
- Reserves months
- —
- Total cash needed
- —
Loan-product check · same deal, 3 products live
Conventional
25% down · 7.5% · 30yr
- Down + closing
- —
- Monthly P&I
- —
- Monthly cashflow
- —
- DSCR
- —
- Eligible?
- —
Personal DTI + credit; lowest rate.
DSCR
20% down · 8.5% · 30yr
- Down + closing
- —
- Monthly P&I
- —
- Monthly cashflow
- —
- DSCR
- —
- Eligible?
- —
No personal income docs; deal must DSCR.
Hard money
10% down · 12.0% · 12mo
- Down + closing
- —
- Monthly P&I
- —
- Monthly cashflow
- —
- DSCR
- —
- Eligible?
- —
Short-term bridge; refi at stabilization.
Listing history 21 events
-
2026-06-12status $195,000 Pending 14 DOM
-
2026-06-10days on market $195,000 Active Option 14 DOM
-
2026-06-08days on market $195,000 Active Option 13 DOM
-
2026-06-08days on market $195,000 Active Option 12 DOM
-
2026-06-05days on market $195,000 Active Option 10 DOM
-
2026-06-03days on market $195,000 Active Option 8 DOM
-
2026-06-02days on market $195,000 Active Option 7 DOM
-
2026-06-01days on market $195,000 Active Option 6 DOM
-
2026-05-31days on market $195,000 Active Option 5 DOM
-
2026-02-03price $189,000 1176-char remark
-
2025-08-27price $199,000 1176-char remark
-
2025-04-28price $215,000 1176-char remark
-
2025-03-10$225,000 New 1176-char remark
-
2020-08-12soldstatus Sold 94-char remark
Show marketing remark (94 chars)
Enjoy this move in ready, country living home on over a 1/2 acre lot. easy access to highway.
-
2020-06-08status Pending 94-char remark
Show marketing remark (94 chars)
Enjoy this move in ready, country living home on over a 1/2 acre lot. easy access to highway.
-
2020-06-02historical Active Option 94-char remark
Show marketing remark (94 chars)
Enjoy this move in ready, country living home on over a 1/2 acre lot. easy access to highway.
-
2020-05-08$99,000 New 94-char remark
Show marketing remark (94 chars)
Enjoy this move in ready, country living home on over a 1/2 acre lot. easy access to highway.
-
2010-07-05historical
-
2009-06-02$73,000
-
2004-01-16soldstatus
-
1999-09-30soldstatus
ⓘ Source: listings_history table (triggers on properties + properties_extension) + one-shot
backfill from property_details.listing_events for pre-trigger history.
Tax reassessment forecast TX · Resets to sale price
- Current annual tax
- $2,713 · $226/mo
- Projected year-2 tax
- $3,568 · $297/mo
- Expected delta
- +$856/yr (+$71/mo · 31.5%)
ⓘ Screening estimate from a state-policy table — verify with the county assessor before closing.
Climate risk First Street
- Flood 1/10 Low 0% chance over 30 yrs
- Wildfire 7/10 Severe
- Heat 8/10 Severe 7 d/yr ≥110°F today · 23 d/yr by 30 yrs out
- Wind 8/10 Severe 80% chance of damaging wind over 30 yrs
- Air quality 1/10 Low 0 unhealthy d/yr today · 0 by 30 yrs out
Nearby sold comps map
Loading sold comps map…
Walkable amenities ~0.75 mi
Loading nearby amenities…
Taxation est. · year 1
- Rental income
- $24,244
- − Mortgage interest
- −$10,923
- − Property taxes
- −$2,713
- − Insurance
- −$975
- − Repairs & maintenance
- −$1,940
- − Management
- −$1,940
- − Depreciation
- −$5,673
- Taxable income
- $81
- Est. tax owed @ 24.0%
- −$20
- After-tax cash flow
- $3,174/yr
For passive investors: Depreciation is non-cash, so a rental often shows a tax loss while cash-flowing — sheltering income. Rental losses are passive: they offset passive income freely, and up to $25,000/yr can offset ordinary (W-2) income if you actively participate and your MAGI is under $100k (phasing out to $0 by $150k); unused losses carry forward. On sale, claimed depreciation is recaptured at up to 25%, and gains may owe capital-gains tax (a 1031 exchange can defer both). Figures are a year-1 estimate at your 24.0% rate — not tax advice; consult a CPA.
Schools (NCES district)
- District
- Pearsall ISD
- NCES district ID
- 4834470
- Math proficiency
- 12% ▼ -18.00%
- Reading proficiency
- 19% ▼ -12.00%
- Median HH income
- $36,681
- Composite
- 12.89/100
- National rank
- #9588
- State rank
- #810 of 826 in TX
Livability — Moore
- Score
- 35/100
- State rank
- #1662
- US rank
- #27697
Category grades
Schools grade is shown separately in the Schools card above.
Census & demographics
- Census place
- Moore, TX
- City population
- 509
- Population (ZIP)
- 509
Population outlook (Frio County) Hauer SSP2
- Today (2025)
- 22,420 people
- By 2030
- 24,445 · +9.0%
- By 2040
- 28,783 · +28.4%
- By 2050
- 33,604 · +49.9%
- By 2075
- 46,166 · +105.9%
- By 2100
- 52,553 · +134.4%
Race, ethnicity, and origin ACS 2023
- Neighborhood character
- Diverse neighborhood (Simpson 0.59)
- Race & ethnicity
- Asian 51% White 38% Hispanic / Latino 10% Two or more races 6% Black 2%
- Hispanic origin (detail)
- Mexican 10%
- Common ancestry
- Slovak 20% Lithuanian 3%
- Foreign-born
- 62% · China, Canada
- Languages at home
- 89% English-only · German/W. Germanic 6% Spanish 4% Other Indo-European 1%
Political lean MEDSL · Frio
- 2024 margin
- Strong R (+24.6) · D 37.5% · R 62.0%
- 2008→2024 swing
- -43.3pp toward R · 2008: 18.7pp · 2024: -24.6pp
- All cycles
- 2024: R+24.6 2020: R+7.6 2016: D+6.3 2012: D+20.6 2008: D+18.7
Not yet ingested
- Civics
- —
Market trends
- HPI YoY
- ▲ 1.14%
- Current HPI
- 85.2233
- Rent YoY
- —
- Metro
- —
- State GDP YoY
- ▲ 3.95%
- F500 in state
- 110
Industry mix (Fortune 500 HQ in TX)
| Industry | F500 HQs | Revenue |
|---|---|---|
| Energy | 16 | $1,198B |
|
||
| Technology | 5 | $198B |
|
||
| Engineering / Construction | 4 | $72B |
|
||
| Energy Services | 3 | $60B |
|
||
| Utilities | 3 | $41B |
|
||
| Healthcare | 2 | $330B |
|
||
Price history
+167.1% since first listed16 events — show timeline
- 2026-06-10 Pending — LERA
- 2026-05-26 Listed — LERA
- 2026-05-26 Listing Removed — LERA
- 2026-05-26 Listed $195,000 LERA
- 2026-02-03 Price Changed $189,000 LERA
- 2025-08-27 Price Changed $199,000 LERA
- 2025-04-28 Price Changed $215,000 LERA
- 2025-03-10 Listed $225,000 LERA
- 2020-08-12 Sold (MLS) — LERA
- 2020-06-08 Pending — LERA
- 2020-06-02 Contingent — LERA
- 2020-05-08 Listed $99,000 LERA
- 2010-07-05 Listing Removed — LERA
- 2009-06-02 Listed $73,000 LERA
- 2004-01-16 Sold (Public Records) — Public Records
- 1999-09-30 Sold (Public Records) — Public Records
Property tax history
+6.6%/yrLatest (2025): $2,713 · +27.0% YoY. Source: county tax records.
Cash-flow waterfall
monthlySold comps — $/sqft
last 12 mo · ≤1 miLoading sold comps…